Look to Orion and Help Measure the Darkness of Your Night Sky

Orion as seen from Easter Island. Credit: Wally Pacholka / AstroPics.com / TWAN. Used by permission.

[/caption]

How dark are your skies? GLOBE at Night wants to know! Join the 6th annual worldwide GLOBE at Night campaign, which is going on right now in the northern hemisphere. “We are running two campaigns this year, from February 22nd to March 6th and from March 22nd to April 4th in the northern hemisphere and March 24th to April 6th in the southern hemisphere,” said Rob Sparks from the National Optical Astronomy Observatory, which is one of the sponsors for this year’s campaign.

By participating in the international star-hunting campaign, you will help address the problems of light pollution locally as well as globally. More participants are needed this year, so sign up to be a citizen scientist today!

Light pollution is a serious and growing global concern. With half of the world’s population now living in cities, many urban dwellers have never experienced the wonder of pristinely dark skies and perhaps, maybe never will. But light pollution is also a concern in areas of safety, energy conservation, cost, health and effects on wildlife, as well as our ability to view the stars.

But this is also one of the easiest environmental problems you can address on local levels.

GLOBE at Night is a wonderful way for everyone around the world to participate to raise public awareness of the impact of artificial lighting on local environments. This event encourages everyone – students, educators, dark sky advocates and the general public – to measure the darkness of their local skies and contribute their observations online to a world map.

The campaign is easy and fun to do, and as in previous years, there are just five easy steps to participate. But this year, there is now an app for that, where participants can submit their measurements in real time if they have a smart phone or tablet.

“There is now a mobile website to submit data,” Sparks told Universe Today. “It will take the GPS data, time and date from your phone and has a cool little graphic to help you determine the brightness of the sky. It even had a red screen feature for night use.” The app can be found at this link.

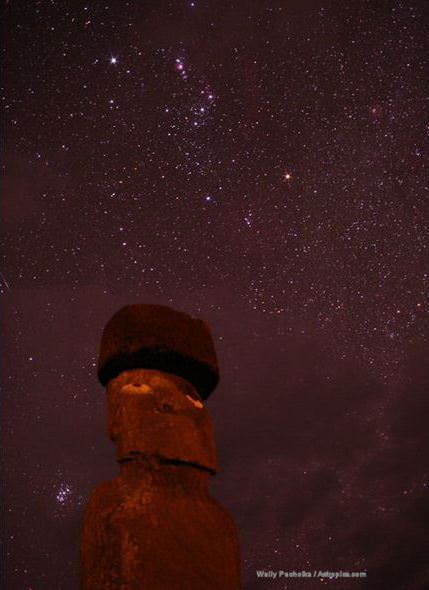
To participate, you will match the appearance of the constellation Orion in the first campaign (and Leo or Crux in the second campaign) with simple star maps of progressively fainter stars found. Then you submit your measurements, including the date, time, and location of your comparison. After all the campaign’s observations are submitted, the project’s organizers release a map of light-pollution levels worldwide. Over the last five annual 2-week campaigns, volunteers from more than 100 nations contributed 52,000 measurements, one third of which came from last year’s campaign.

The five easy star-hunting steps are:

1) Find your latitude and longitude.

2) Find Orion by going outside an hour after sunset (about 7-10pm local time).

3) Match your nighttime sky to one of the GLOBE at Night magnitude charts

4) Report your observation.

5) Compare your observation to thousands around the world.

Go to the GLOBE at Night website for all the details. There is even a 10-minute audio podcast on light pollution and GLOBE at Night. Or download a 45-minute powerpoint and accompanying audio. GLOBE at Night is also on Facebook and Twitter.

Be a part of GLOBE at Night and help the campaign exceed the 17,800 observations contributed last year. Your measurements will make a world of difference.

Thanks to the GLOBE at Night team for securing permission for Universe Today to post the lead image, from Wally Pacholka from AstroPics.com and TWAN (The World At Night).

20 Million Observations by Amateur Astronomers!

Graph showing the rapidly growing number of observations in the AAVSO International Database. Courtesy AAVSO.

[/caption]Early into the celebration of its centennial year, observers of the American Association of Variable Star Observers (AAVSO) passed another milestone over the weekend, when an amateur astronomer from Belgium contributed the 20 millionth observation of a variable star on February 19, 2011.

Amateur astronomers have been recording changes in the brightness of stars for centuries. The world’s largest database is run by the AAVSO. Started in 1911, it is one of the oldest, continuously operating citizen science projects in the world.

“The long-term study of stellar brightness variation is critical to understanding how stars work and the impact they have on their surroundings. The noble efforts of the engaged AAVSO volunteers play an important role in astronomy and help expand human knowledge,” said Dr. Kevin Marvel, Executive Officer of the American Astronomical Society.

The AAVSO currently receives variable star brightness estimates from about 1,000 amateur astronomers per year. Some variable stars are bright enough to be seen with the unaided eye while others require high-tech equipment. The AAVSO also has a network of robotic telescopes available to members free of charge.

“Because some variable stars are unpredictable and/or change their brightness over long time scales, it is not practical for professional astronomers to watch them every night. Thus, amateurs were recruited to keep tabs on these stars on behalf of professionals,” Dr. Arne Henden, Director of the AAVSO, said.

The 20 millionth observation was made by Dr. Franz-Josef “Josch” Hambsch of Belgium. The observation was of GV Andromeda, member of a class of older, pulsating stars smaller than our Sun. “I like these stars because you can see their entire variation cycle in one night. There have not been many recent observations made of this particular star, so that is why I am monitoring it,” Hambsch said. Hambsch is also a member of the Belgian variable star organization, Vereniging Voor Sterrenkunde, Werkgroep Veranderlijke Sterren (VVS, WVS).

Actual light curve of GV And created from Josch Hambsh's data. One of these points is the 20 millionth observation! Courtesy AAVSO.

The process of estimating a star’s brightness can range from less than a minute to many hours per estimate, but typically takes about five minutes. At that rate, observers have invested the equivalent of about 1.67 million hours of time in collecting observations for the database. Assuming a current median salary of US$33,000, this would be the roughly equivalent to 27.5 million dollars worth of donated time if all the observations were reported today.

“The reality is these observations are invaluable. The database spans many generations and includes data that cannot be reproduced elsewhere. If an astronomer wants to know the history of a particular star, they come to the AAVSO,” Henden said.

The AAVSO’s mission is to coordinate, collect, and distribute variable star data to support scientific research and education. The AAVSO International Database is openly available to the public through their web site (www.aavso.org), where it is queried hundreds of times per day.

Become an Exoplanet Hunter With Newest Zooniverse Citizen Science Project

Artist's impression of an extrasolar planet. Image credit: CfA

[/caption]

You knew it was only a matter of time until the hunt for extrasolar planets joined the Zooniverse family of Citizen Science projects. And the time has now arrived for your chance to make one of the biggest discoveries of the 21st century by finding other planets out there in the Universe.

Planet Hunters is the latest addition to the Zooniverse, and users will help scientists analyze data taken by NASA’s Kepler mission, the biggest, badest exoplanet hunting telescope in space. The project goes live on December 16 at http://www.planethunters.org.


“The Kepler mission has given us another mountain of data to sort through,” said Kevin Schawinski, a Yale University astronomer and Planet Hunters co-founder. Schawinski was one of the original forces behind Galaxy Zoo, the citizen science project that started it all back in 2007, which enlisted hundreds of thousands of Web users round the world to help sort through and classify a million images of galaxies taken by a robotic telescope.

The Kepler telescope has been in space since 2009, continually monitoring nearly 150,000 stars in the constellations Cygnus and Lyra, recording their brightness over time. In June of this year, the Kepler team announced they had found over 750 exoplanet candidates in just the first 43 days of the spacecraft’s observations.

They also just announced they will make an early release of a complete 3 months of observations early in 2011, which will contain light curves for approximately 165,000 stars, most of which are late-type Main Sequence stars.

“The Kepler mission will likely quadruple the number of planets that have been found in the last 15 years, and it’s terrific that NASA is releasing this amazing data into the public domain,” said Debra Fischer, a Yale astronomer and leading exoplanet hunter.

Although Planet Hunters is not tied directly to the Kepler mission, the website will serve as a complement to the work being done by the Kepler team to analyze the data, the team said.

Granted, the Citizen Scientists looking for extrasolar planets will be doing a search akin to looking for a needle in a haystack. But its one of the most exciting needles to be searching for.

Because of the huge amount of data being made available by Kepler, astronomers rely on computers to help them sort through the data and search for possible planet candidates. “But computers are only good at finding what they’ve been taught to look for,” said Meg Schwamb, another Yale astronomer and Planet Hunters co-founder, “whereas the human brain has the uncanny ability to recognize patterns and immediately pick out what is strange or unique, far beyond what we can teach machines to do.”

Galaxy Zoo project has shown how successful this concept of using a network of global volunteers can be, as the Citizen Scientists has helped the Galaxy Zoo team publish over 20 papers about galaxy shapes and distributions, as well as making some unusual discoveries, like Hanny’s Voorwerp.

To participate, you don’t need to have any astronomical or exoplanet expertise. When users log on to the Planet Hunters website, they’ll be asked to answer a series of simple questions about one of the stars’ light curves — a graph displaying the amount of light emitted by the star over time — to help the Yale astronomers determine whether it displays a repetitive dimming of light, identifying it as an exoplanet candidate.

And exoplanet research is one of the hottest topics in astronomy today. Over 500 planets have been found orbiting other stars since 1995. Most of these are large, Jupiter-like planets, but astronomers are refining their searches to try and find smaller planets more the size of Earth.

“The search for planets is the search for life,” Fischer said. “And at least for life as we know it, that means finding a planet similar to Earth.” Scientists believe Earth-like planets are the best place to look for life because they are the right size and orbit their host stars at the right distance to support liquid water, an essential ingredient for every form of life found on Earth.

The point of citizen science is to actively involve people in real research,” Schawinski said. “When you join Planet Hunters, you’re contributing to actual science — and you might just make a real discovery.”

Galaxy Zoo Searches for Supernovae

Aside from categorizing galaxies, another component of the Galaxy Zoo project has been asking participants to identify potential supernovae (SNe). The first results are out and have identified “nearly 14,000 supernova candidates from [Palomar Transient Factory, (PTF)] were classified by more than 2,500 individuals within a few hours of data collection.”

Although the Galaxy Zoo project is the first to employ citizens as supernova spotters, the background programs have long been in place but were generating vast amounts of data to be processed. “The Supernova Legacy Survey used the MegaCam instrument on the 3.6m Canada-France-Hawaii Telescope to survey 4 deg2” every few days, in which “each square degree would typically generate ~200 candidates for each night of observation.” Additionallly, “[t]he Sloan Digital Sky Survey-II Supernova Survey used the SDSS 2.5m telescope to survey a larger area of 300 deg2” and “human scanners viewed 3000-5000 objects each night spread over six scanners”.

To ease this burden, the highly successful Galaxy Zoo implemented a Supernova Search in which users would be directed through a decision tree to help them determine what computer algorithms were proposing as transient events. Each image would be viewed and decided on by several participants increasing the likelihood of a correct appraisal. Also, “with a large number of people scanning candidates, more candidates can be examined in a shorter amount of time – and with the global Zooniverse (the parent project of Galaxy Zoo) user base this can be done around the clock, regardless of the local time zone the science team happens to be based in” allowing for “interesting candidates to be followed up on the same night as that of the SNe discovery, of particular interest to quickly evolving SNe or transient sources.”

To identify candidates for viewing, images are taken using the 48 inch Samuel Oschin telescope at the
Palomar Observatory. Images are then calibrated to correct instrumental noise and compared automatically to reference images. Those in which an object appears with a change greater than five standard deviations from the general noise are flagged for inspection. While it may seem that this high threshold would eliminate other events, the Supernova Legacy Survey, starting with 200 candidates per night, would only end up identifying ~20 strong candidates. As such, nearly 90% of these computer generated identifications were spurious, likely generated by cosmic rays striking the detector, objects within our own solar system, or other such nuisances and demonstrating the need for human analysis.

Still, the PTF identifies between 300 and 500 candidates each night of operation. When exported to the Galaxy Zoo interface, users are presented with three images: The first is the old, reference image. The second is the recent image, and the third is the difference between the two, with brightness values subtracted pixel for pixel. Stars which didn’t change brightness would be subtracted to nothing, but those with a large change (such as a supernova), would register as a still noticeable star.

Of course, this method is not flawless, which also contributes to the false positives from the computer system that the decision tree helps weed out. The first question (Is there a candidate centered in the crosshairs of the right-hand [subtracted] image?) eliminates misprocessing by the algorithm due to misalignment. The second question (Has the candidate itself subtracted correctly?) serves to drop stars that were so bright, they saturated the CCD, causing odd errors often resulting in a “bullseye” pattern. Third (Is the candidate star-like and approximately circular?), users eliminate cosmic ray strikes which generally only fill one or two pixels or leave long trails (depending on the angle at which they strike the CCD). Lastly, users are asked if “the candidate centered in a circular host galaxy?” This sets aside identifications of variable stars within our own galaxy that are not events in other galaxies as well as supernovae that appear in the outskirts of their host galaxies.

Each of these questions is assigned a number of positive or negative “points” to give an overall score for the identification. The higher the score, the more likely it is to be a true supernova. With the way the structure is set up, “candidates can only end up with a score of -1, 1 or 3 from each classification, with the most promising SN candidates scored 3.” If enough users rank an event with the appropriate score, the event is added to a daily subscription sent out to interested parties.

To confirm the reliability of identifications, the top 20 candidates were followed up spectroscopically with the 4.2m William Herschel Telescope. Of them, 15 were confirmed as SNe, with 1 cataclysmic variable, and 4 remain unknown. When compared to followup observations from the PTF team, the Galaxy Zoo correctly identified 93% of supernova that were confirmed spectroscopically from them. Thus, the identification is strong and this large volume of known events will certainly help astronomers learn more about these events in the future.

If you’d like to join, head over to their website and register. Presently, all supernovae candidates have been processed, but the next observing run is coming up soon!

PSA: Bars Kill Galaxies

Barred Spiral Galaxy NGC 6217

[/caption]

Many spiral galaxies are known to harbor bars. Not the sort in which liquor is served as a social lubricant, but rather, the kind in which gas is served to the central regions of a galaxy. But just as recent studies have identified alcohol as one of the most risky drugs, a new study using results from the Galaxy Zoo 2 project have indicated galactic bars may be associated with dead galaxies as well.

The Galaxy Zoo 2 project is the continuation of the original Galaxy Zoo. Whereas the original project asked participants to categorize galaxies into Hubble Classifications, the continuation adds the additional layer of prompting users to provide further classification including whether or not the nearly quarter of a million galaxies showed the presence of a bar. While relying on only quickly trained volunteers may seem like a risky venture, the percentage of galaxies reported to have bars (about 30%) was in good agreement with previous studies using more rigorous methods.

The new study, led by Karen Masters of the Institute of Cosmology and Gravitation at the University of Portsmouth, analyzed the presence or lack of bars in relation to other variables, such as “colour, luminosity, and estimates of the bulge size, or prominence.” When looking to see if the percent of galaxies with bars evolved over the redshifts observed, the team found no evidence that this had changed in the sample (the GZ2 project contains galaxies to a lookback time of ~6 billion years).

When comparing the fraction with bars to the overall color of the galaxy, the team saw strong trends. In blue galaxies (which have more ongoing star formation) only about 20% of galaxies contained bars. Meanwhile, red galaxies (which contain more older stars) had as many as 50% of their members hosting bars. Even more striking, when the sample was further broken down into grouping by overall galaxy brightness, the team found that dimmer red galaxies were even more likely to harbor bars, peaking at ~70%!

Before considering the possible implications, the team stopped to consider whether or not there was some inherent biasing in the selection based on color. Perhaps bars just stood out more in red galaxies and the ongoing star formation in blue galaxies managed to hide their presence? The team referenced previous studies that determined visual identification for the presence of bars was not hindered in the wavelengths presented and only dipped in the ultraviolet regime which was not presented. Thus, the conclusion was deemed safe.

While the findings don’t establish a causal relationship, the connection is still apparent: If a galaxy has a bar, it is more likely to lack ongoing star formation. This discovery could help astronomers understand how bars form in the first place. Given both structure, such as bars and spiral arms, and star formation are associated with galactic interactions, the expectation would be that we should observe more bars in galaxies in which interactions have caused them to form as well as triggering star formation. As such, this study helps to constrain modes of bar formation. Another possible connection is the ability of bars to assist in movement of gas, potentially shuttling and shielding it from being accessible for formation. As Masters states, “It’s not yet clear whether the bars are some side effect of an external process that turns spiral galaxies red, or if they alone can cause this transformation. We should get closer to answering that question with more work on the Galaxy Zoo dataset.”

New Galaxy Zoo Project Crowd-sources Old Climate Data

The newest citizen science project from the Galaxy Zoo team lets the public travel back in time and join the crews of over 280 different World War I royal navy warships. While an engaging historical journey, the project will help scientists better understand the climate of the past. There are gaps in weather and climate data records, particularly before 1920, prior to when weather station observations were accurately recorded. But old naval ships routinely recorded the weather they encountered – marking down temperatures and conditions even while in battle. The information in many of these weather logbooks has not been utilized – until now, as the “Old Weather” project has made its debut as the newest way for the public to contribute in scientific research.

The project is designed to provide a detailed map of the world’s climate around 100 years ago, which will help tell us more about the climate today. Anyone can take part, read the logs, follow events aboard the vessels and contribute to this fun and historical project, which could tell us more about our climate’s future.

“These naval logbooks contain an amazing treasure trove of information but because the entries are handwritten they are incredibly difficult for a computer to read,’ said Dr. Chris Lintott of Oxford University, a Galaxy Zoo founder and developer of the OldWeather.org project. “By getting an army of online human volunteers to retrace these voyages and transcribe the information recorded by British sailors we can relive both the climate of the past and key moments in naval history.”

By transcribing information about weather, and any interesting events, from images of each ship’s logbook web volunteers will help scientists to build a more accurate picture of how our climate has changed over the last century, as well as adding to our knowledge of this important period of British history.

HMS Acacia, one of the ships in the Old Weather project.

“Historical weather data is vital because it allows us to test our models of the Earth’s climate,”said Dr. Peter Stott, Head of Climate Monitoring and Attribution at the British meteorology, or Met Office. “If we can correctly account for what the weather was doing in the past, then we can have more confidence in our predictions of the future. Unfortunately, the historical record is full of gaps, particularly from before 1920 and at sea, so this project is invaluable.”

Weather observations by Royal Navy sailors were made every four hours without fail, said Dr. Robert Simpson of Oxford University, who added that this project is almost like “launching a weather satellite into the skies at a time when manpowered flight was still in its infancy.”

What is Old Weather from National Maritime Museum on Vimeo.

If you are not yet familiar yet with the Zooniverse, which includes citizen science projects like Galaxy Zoo and Moon Zoo, you are really missing out on a fun and engaging way to do actual, meaningful science. In those projects, 320,000 people have made over 150 million classifications and published several scientific papers – which shown that ordinary web users can make observations that are as accurate as those made by experts.

Old Weather is unique among the eight scientific projects encompassed by the Zooniverse because of how old the data is, and participating really is a trip back in time. The ‘virtual sailors’ visiting OldWeather.org are rewarded for their efforts by a rise through the ratings from cadet to captain of a particular ship according to the number of pages they transcribe. Historians are also hoping that a look into these old records will provide a fresh insight into naval history and encourage people to find out more about the past.

Here’s a tutorial on how to participate in Old Weather:

Old Weather – Getting Started from The Zooniverse on Vimeo.

To find out more, and participate visit OldWeather.org. There’s also an Old Weather blog at http://blogs.zooniverse.org/oldweather

You can also follow the project on Twitter (@OldWeather) and Facebook.

Follow-up Studies on June 3rd Jupiter Impact

Color image of impact on Jupiter on June 3, 2010. Credit: Anthony Wesley

[/caption]

Poor Jupiter just can’t seem to catch a break. Ever since 1994, when our largest planet was hit by Comet Shoemaker-Levy, detections of impacts on Jupiter have occurred with increasing regularity. Most recently, an impact was witnessed on August 20. On June 3rd of 2010, (coincidentally the same day pictures from Hubble were released from a 2009 impact) Jupiter was hit yet again. Shortly after the June 3rd impact, several other telescopes joined the observing.

A paper to appear in the October issue of The Astrophysical Journal Letters discusses the science that has been gained from these observations.

The June 3rd impact was novel in several respects. It was the first unexpected impact that was reported from two independent locations simultaneously. Both discoverers were observing Jupiter with aims of engaging in a bit of astrophotography. Their cameras were both set to take a series of quick images, each lasting a fifth to a tenth of a second. This short time duration is the first time astronomers have had the ability to recreate the light curve for the meteor. Additionally, both observers were using different filters (one red and one blue) allowing for exploration of the color distribution.

Analysis of the light curve revealed that the flash lasted nearly two seconds and was not symmetric; The decay in brightness occurred faster than the increase at onset. Additionally, the curve showed several distinct “bumps” which indicated a flickering that is commonly seen on meteors on Earth.

The light released in the burning up of the object was used to estimate the total energy-released and in turn the mass of the object.  The total energy released was estimated to be between roughly (1.0–4.0) × 1015 Joules (or 250–1000 kilotons).

Follow-up observations from Hubble three days later revealed no scars from the impact. In the July 2009 impact, a hole punched in the clouds remained for several days. This indicated the object in the June 3 impact was considerably smaller and burned up before it was able to reach the visible cloud decks.

Observations intended to find debris came up empty. Infrared observations showed that no thermal signature was left even as little as 18 hours following the discovery.

Assuming that the object was an asteroid with a relative speed of ~60 km/sec and a density of ~2 g/cm3, the team estimated the size of the object to be between 8 and 13 meters, similar to the size of the two asteroids that recently passed Earth. This represents the smallest meteor yet observed on Jupiter. An object of similar size was estimated to be responsible for the impact on Earth in 1994 near the Marshall Islands. Estimates “predict objects of this size to collide with our planet every 6–15 years” with significantly higher rates on Jupiter ranging from one to one hundred such events annually.

Clearly, amateur observations led to some fantastic science. Modest telescopes, “in the range 15–20 cm in diameter equipped with webcams and video recorders” can easily allow for excellent coverage of Jupiter and continued observation could help in determining the impact rate and lead to a better understanding of the population of such small bodies in the outer solar system.

Tumbling Boulders Leave Trails on the Moon

mages from Moon Zoo showing trails from tumbling boulders in the Montes Alpes/Vallis Alpes region on the Moon. Credit: NASA/LRO/Moon Zoo.

[/caption]

There’s probably a great story in this image, if only someone was there to witness it as it happened! This is an image from Moon Zoo, the citizen science project from the Zooniverse that asks people to look at images from the Lunar Reconnaissance Orbiter and search for craters, boulders and more. And often, the Zooites find some very interesting features on the Moon, like this one and the ones below that include tracks from rolling, bounding, tumbling and sometimes bouncing boulders. Then the task for the scientists is to figure out what actually happened to get these boulders moving — was it an impact, are the boulder on the bottom of a hill, or was it some other unknown catalyst? As Zooniverse founder Chris Lintott says, “The Moon has its own landscape that is really quite dramatic, so it’s a world well worth exploring.”

LRO image from Moon Zoo.

Why look for tumbling boulders? Moon Zoo scientist Dr. Katie Joy gave this explanation:

“One of the main reasons we are asking Moon Zoo users to search for scars left behind by tumbling boulders is to help support future lunar exploration initiatives. Boulders that have rolled down hillsides from crater walls, or massifs like the Apollo 17 landing site, provide samples of geologic units that may be high up a hillside and thus difficult to access otherwise by a rover or a manned crew vehicle. If mission planning can include traverses to boulders that have rolled down hills, and we can track these boulders back up to the part of hillside from where they have originated, it provides a neat sampling strategy to accessing more geological units than would have been possible otherwise… Thus we hope to use Moon Zoo user data to produce a map of known boulder tracks (and terminal boulders) across the Moon.”

LRO image from Moon Zoo of boulder tracks.

See more unique boulder tracks images in the Moon Zoo forum thread on boulders.

If you want to join in on the fun of looking for mysteries on the Moon, check out Moon Zoo, or the Zooniverse for more citizen science projects where you can get involved in helping scientists do real science.

New Citizen Science Opportunity: Solar Storm Watch

A coronal mass ejection. Credit: Solar Storm Watch

[/caption]

Sun-worshiper alert! Now you can have the chance to help scientists spot and track solar storms and be involved in the latest solar research. The ‘hottest’ new Citizen Science project from the “Zooniverse” is Solar Storm Watch. Volunteers can spot storms and track their progress as they hurtle across space towards our planet. Your “clicks” and input will help solar scientists better understand these potentially dangerous storms and help to forecast their arrival time at Earth. “The more people looking at our data, the more discoveries we will make,” said Dr. Chris Davis, Project Scientist with the STEREO mission. “We encourage everyone to track these spectacular storms through space. These storms are a potential radiation hazard for spacecraft and astronauts alike and together we hope to provide advanced warning of their arrival at Earth.”

Solar Storm Watch has been in Beta testing for about two months, but is now officially open for business. “It’s been wonderful to watch the team get ready for a flood of data,” said Chris Lintott, one of the founders of the original Galaxy Zoo, and now Zooniverse — new citizen science projects that that use the Galaxy Zoo model — of which Solar Storm Watch is a part. ” I’m sure there are discoveries there already.”

“I’ve been sitting at my desk watching the results roll in and there are plenty of CMEs that just need a few more clicks,” said Arfon Smith from Oxford University, one of the developers of Zooniverse, who has helped solar astronomers at the Royal Observatory in Greenwich integrate their science projects into the Galaxy Zoo model.

STEREO spacecraft. Credit: NASA

The project uses real data from NASA’s STEREO spacecraft, a pair of satellites in orbit around the Sun which give scientists a constant eye on the ever-changing solar surface. STEREO’s two wide-field instruments, the Heliospheric Imagers provide Solar Stormwatch with its data. Each imager has two cameras helping STEREO stare across the 150 million kilometers from the Earth to the Sun.

“The Solar Stormwatch website has a game-like feel without losing any of the science,” said Julia Wilkinson, Solar Stormwatch volunteer. “I can click away identifying features and watch solar storms head towards Earth on the video clips and learn about solar science at the same time. It’s fun, it’s addictive, it’s educational and you get to contribute to real astronomy research without being an expert in astrophysics … The fact that any Solar Stormwatch volunteer could make a brand new discovery about our neighboring star is very cool indeed. All you need is a computer and an interest in finding out more about what the sun is really like. Solar astronomy has never been easier!”

Solar Storm Watch has made their project very interactive with social media, as you can share your discoveries on the user forum and Flickr, as well as follow the space weather forecast on Twitter. SSW also has a blog to shre the latest news and challenges.

To participate, go to the Solar Storm Watch website. You can get a “Mission Briefing”, or watch informative videos on why the solar science community needs you!

Sources: Royal Observatory, Zooniverse

New Amazing Mars Flyover Videos


Doug Ellison from UnmannedSpaceflight.com has done it again… and again… and again. Here are new Mars flyover videos Doug has created from data from the HiRISE camera on the Mars Reconnaissance Orbiter. Using DEM (Digital Elevation Model)– (also known as DTM Digital Terrain Model) files provided by the HiRISE team, Doug is able to render 3-D movies of a specific location on Mars. Since he is using actual high-resolution data from HiRISE, Doug says the terrain seen in the movies has accurate vertical scaling and is not exaggerated. These new views of the Red Planet are also stunningly beautiful! The video above is of the Mojave Crater wall on Mars, and below is Athabasca Valles. And Doug says more are on the way! If you recall, Doug created the flyover video of the Spirit rover’s location that was on Astronomy Picture of the Day.
Continue reading “New Amazing Mars Flyover Videos”