We’re in uncharted territory as the world faces the Coronavirus (COVID-19) pandemic. While the medical community is on the front lines of dealing with this, as well as others who provide critical services in our communities, the best thing many of us can do is to stay home (and wash our hands).
If you’re looking for ways to keep occupied, keep your kids in learning-mode while school is canceled, and expand your horizons — all at the same time — luckily there are lots of space and astronomy-related activities you can do at home and online. We’ve compiled a few of our favorites, including this first one, one that just became available yesterday.
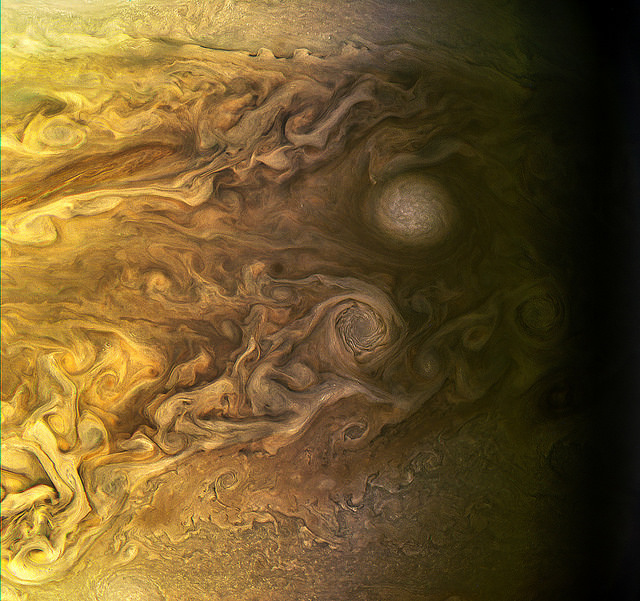
Though Jupiter and Earth are wildly differing places, some things are the same on both worlds. Image Credit: NASA
Jupiter: a massive, lifeless gas giant out there on the other side of the asteroid belt. It’s a behemoth, containing 2.5 times as much mass as all the other planets combined. To top it off, it’s named after the Roman God of War.
Earth: a tiny rocky world, almost too close to the Sun, where life rises and falls, punctuated repeatedly by extinctions. Compared to Jupiter, it’s a gum-drop world: Jupiter is 317.8 times the mass of Earth. And Earth is named after a goddess in German paganism, or so we think.
“Out of all the complexity flows beauty…”
Norman Kuring, NASA’s Goddard Space Flight Center.
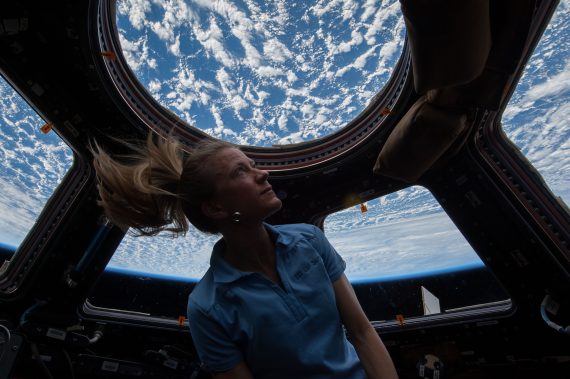
Astronaut Karen Nyberg looks out at Earth from the International Space Station's Cupola. You can too! Credit: NASA.
Calling all citizen scientists, geography buffs, fans of the International Space Station and those who love that orbital perspective!
CosmoQuest has a brand new project in coordination with NASA and the Astronomical Society of the Pacific (ASP) where you can help identify features in photographs taken by astronauts from the space station.
The project is called Image Detective. I’ve tried it out, and wow, THIS is a lot of fun!
Now, I absolutely love seeing the images taken of Earth from the ISS, and I routinely follow all the astronauts on board on social media so I can see their latest images. And I also love the concept of regular, everyday people doing science. Plus I’m a big fan of CosmoQuest and their ‘quest’ to bring science to the public.
But still, the setup CosmoQuest has is really great and the process is easy. Citizen scientists are asked to help identify geographic features (natural or human-made) and then determine the location on Earth where the photo is centered.
I found that last part to be the most difficult, but I’ve been known to have trouble reading a map … so I’m hoping that I can improve a bit with more practice.
“The astronauts’ photos of Earth are visually stunning, but more than that, they can be used to study our changing Earth,” said our good friend Dr. Pamela Gay, who is the Director of Technology and Citizen Science at ASP. “From erupting volcanoes, to seasonal flooding, these images document the gradual changes that happen to our landscape. The trick is, we need to make these images searchable, and that means taking the time to sort through, analyze, and label (add metadata) the unidentified images within the database of 1.5 million plus photos.”
The team says that Image Detective spreads the significant work necessary to label all of the images out to citizen scientists across the world.
“This is a unique, powerful, and beautiful image data set that has already yielded excellent research science. But the data set needs the many eyes and minds of citizen scientists to reach its full potential as a publicly available, searchable catalog,” said Dr. Jennifer Grier, a Senior Scientist and Senior Education and Communication Specialist at Planetary Science Institute (PSI) and CosmoQuest’s lead support scientist. “With the additions that citizen scientists as detectives can make, professional research scientists will be able to conduct more research into our changing world, and do so much more effectively.”
Special Guest:
This week’s guests are Dr Brad Tucker (@btucker22) and Dr Anais Möller (@anais_moller) of ANU Citizen Science Project for Supernovae. Brad is an Astrophysicist/Cosmologist, and currently a Research Fellow at the Research School of Astronomy and Astrophysics, Mt. Stromlo Observatory at the Australian National University. Anais is a cosmologist based in the Australian National University with an expertise in type Ia supernova cosmology. She has worked at low and high redshift supernovae surveys with the goal to study the effect of dark energy in our Universe.
Announcements:
If you would like to join the Weekly Space Hangout Crew, visit their site here and sign up. They’re a great team who can help you join our online discussions!
We record the Weekly Space Hangout every Wednesday at 5:00 pm Pacific / 8:00 pm Eastern. You can watch us live on Universe Today, or the Weekly Space Hangout YouTube page
Jupiter as seen by the Juno spacecraft during the Perijove 5 pass on March 27, 2017. Processed using raw data. Credit: NASA/JPL-Caltech/SwRI/MSSS/Kevin M. Gill.
The original plans for the Juno mission to Jupiter didn’t include a color camera. You don’t need color images when the mission’s main goals are to map Jupiter’s magnetic and gravity fields, determine the planet’s internal composition, and explore the magnetosphere.
But a camera was added to the manifest, and the incredible images from the JunoCam have been grabbing the spotlight.
As an instrument where students and the public can choose the targets, JunoCam is a “public outreach” camera, meant to educate and captivate everyday people.
“The whole endeavor of JunoCam was to get the public to participate in a meaningful way,” said Candy Hansen, Juno co-investigator at the Planetary Science Institute in Tucson, Arizona, speaking at a press conference last week to showcase Juno’s science and images.
And participate they have. Hundreds of ‘amateur’ image processing enthusiasts have been processing raw data from the JunoCam, turning them into stunning images, many reminiscent of a swirling Van Gogh ‘starry night’ or a cloudscape by Monet.
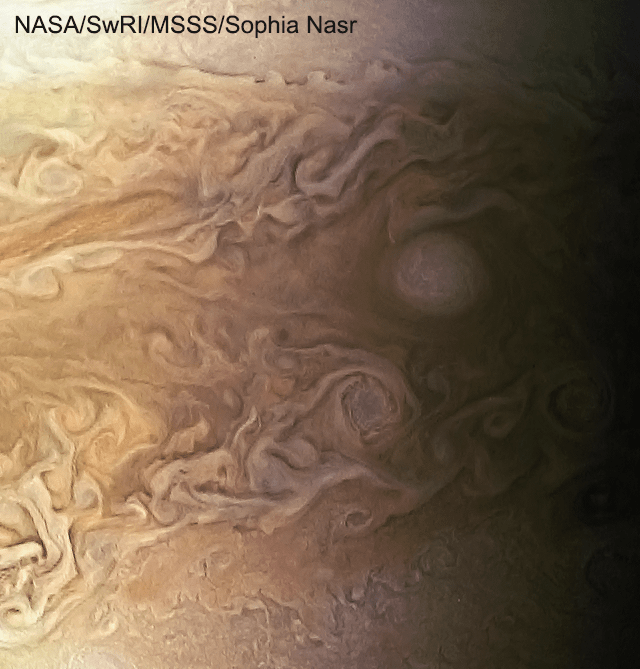
The swirling cloudtops of Jupiter, as seen by Juno during Perijove 5 on March 27, 2017. Credit: NASA/JPL-Caltech/SwRI/MSSS/Sophia Nasr.
“The contributions of the amateurs are essential,” Hansen said. “I cannot overstate how important the contributions are. We don’t have a way to plan our data without the contributions of the amateur astronomers. We don’t have a big image processing team, so we are completely relying on the help of our citizen scientists.”
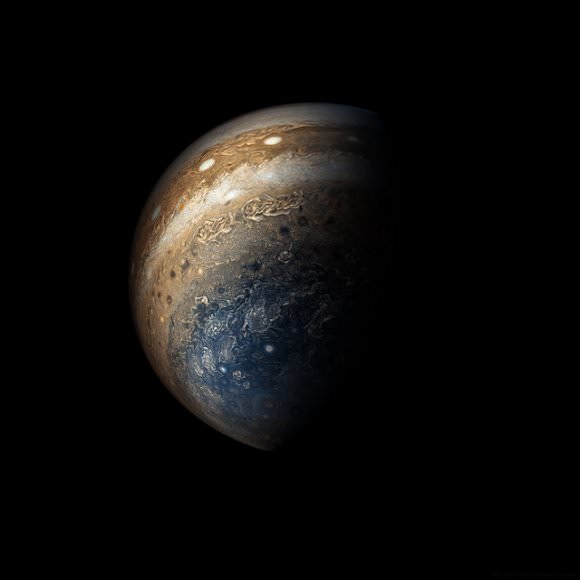
Jupiter as seen by Juno during Perijove 6 in May, 2017. Credit: NASA/SwRI/MSSS/Gerald Eichstädt / Seán Doran.
Click on this image to have access to a 125 Megapixel upscaled print portrait.
Featured here are images processed by Seán Doran, Sophia Nasr, Kevin Gill and Jason Major. Like hundreds of others around the world, they anxiously await for data to arrive to Earth, where it is uploaded to the public Juno website. Then they set to work to turn the data into images.
“What I find the most phenomenal of all is that this takes real work,” Hansen said. “When you download a JunoCam image and process it, it’s not something you do in five minutes. The pictures that we get that people upload back onto our site, they’ve invested hours and hours of their own time, and then generously returned that to us.”
This video shows Juno’s trajectory from Perijove 6, and is based on work by Gerald Eichstädt, compiled and edited by Seán Doran. “This is real imagery projected along orbit trajectory,” Doran explained on Twitter.
Intricate swirls on Jupiter Jupiter, from Juno’s Perijove 6 pass on May 19, 2017. Credit: NASA/JPL-Caltech/SwRI /MSSS/Kevin M. Gill.
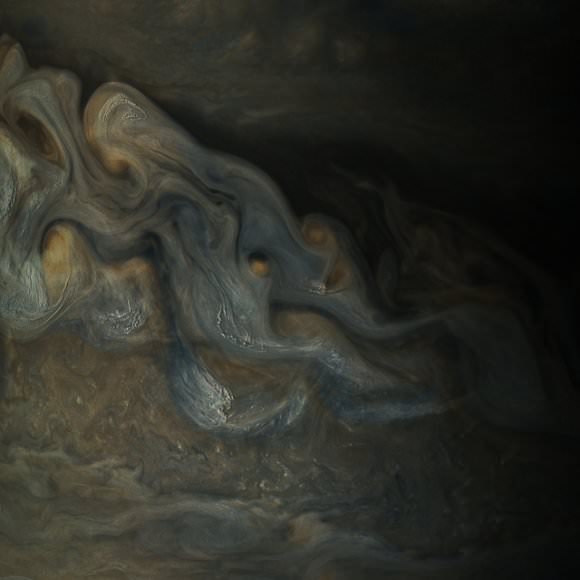
Details of Jupiter’s swirling gas clouds, as seen by Juno during the Perijove 6 pass in May, 2017. Credit: NASA / SwRI / MSSS / Gerald Eichstädt / Seán Doran.
JunoCam was built by Malin Space Science Systems, which has cameras on previous missions like the Curiosity Mars Rover, the Mars Global Surveyor and the Mars Color Imager on the Mars Reconnaissance Orbiter. To withstand the harsh radiation environment at Jupiter, the camera required special protection and a reinforced lens.
Whenever new images arrive, many of us feel exactly like editing enthusiast Björn Jónsson:
I never expected I'd ever say this but: The latest @NASAJuno images of Jupiter are the most spectacular images of Jupiter I've ever seen. pic.twitter.com/7HawZ9RSwe
Even the science team has expressed their amazement at these images.
“Jupiter looks different than what we expected,” said Scott Bolton, Juno’s principal investigator at the Southwest Research Institute. “Jupiter from the poles doesn’t look anything like it does from the equator. And the fact the north and south pole don’t look like each other, makes us wonder if the storms are stable, if they going to stay that way for years and years like the the Great Red Spot. Only time will tell us what is true.”
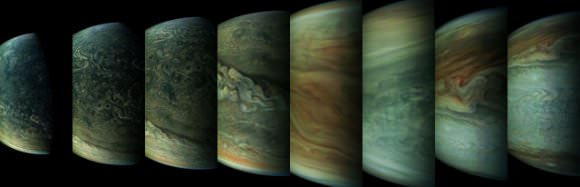
A sequence of images of Jupiter from Juno’s Perijove 6 pass during May, 2017. Credit: NASA / SwRI / MSSS / Gerald Eichstädt / Seán Doran.
Part of what makes these images so stunning is that Juno is closer to Jupiter than any previous spacecraft.
“Juno has an elliptical orbit that brings it between the inner edges of Jupiter’s radiation belt and the planet, passing only 5,000 km above the cloud tops,” Juno Project Manager Rick Nybakken told me in my book ‘Incredible Stories From Space: A Behind-the-Scenes Look at the Missions Changing Our View of the Cosmos.’ “This close proximity to Jupiter is unprecedented, as no other mission has conducted their science mission this close to the planet. We’re right on top of Jupiter, so to speak.”
Juno engineers designed the mission to enable the use of solar panels, which prior to Juno, have never been used on a spacecraft going so far from the Sun. Juno orbits Jupiter in a way that the solar panels are always pointed towards the Sun and the spacecraft never goes behind the planet. Juno’s orbital design not only enabled an historic solar-powered mission, it also established Juno’s unique science orbit.
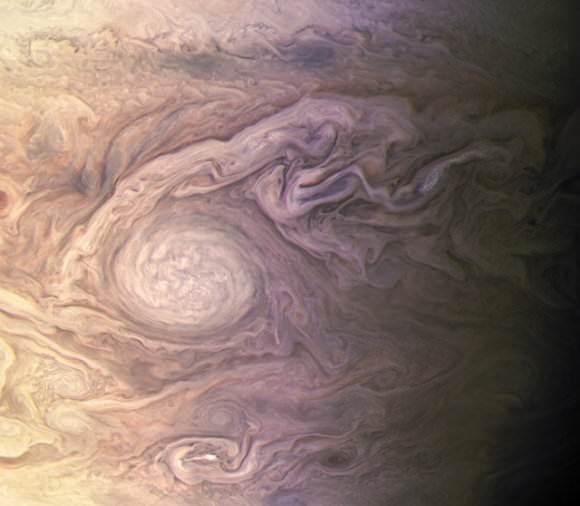
White oval on Jupiter during Juno’s Perijove 4 pass on February 2, 2017. Processed from raw data. Credit: NASA/JPL-Caltech/SwRI/MSSS/Kevin M. Gill.
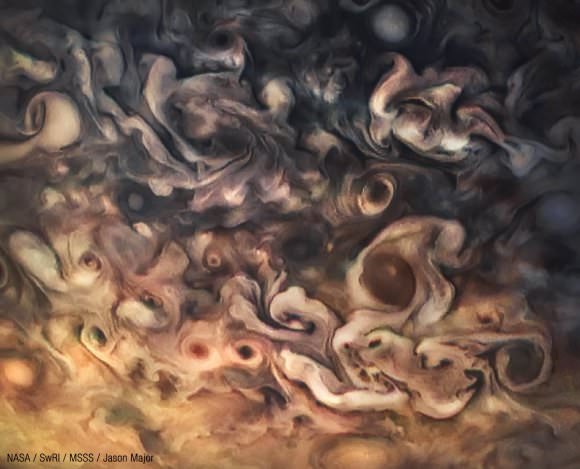
Uncalibrated, processed raw image from Juno’s Perijove 6 pass of Jupiter on May 19, 2017. Credit: NASA/SwRI/MSSS/Jason Major.
Juno spacecraft launched from Cape Canaveral on August 5, 2011. After traveling five years and 1.7 billion miles Juno arrived in orbit at Jupiter on July 4, 2016. The mission will last until at least February 2018, making 11 science orbits around Jupiter, instead of the 32 laps originally planned. Last year, engineers detected a problem with check valves in the propulsion system, and NASA decided to forego an engine burn to move Juno into a tighter 14-day orbit around Jupiter. The current 53.4 day orbit will be maintained, but depending on how the spacecraft responds, NASA could extend the mission another three years to give Juno more flybys near Jupiter.
The next science flyby will occur on July 11, when Juno will get some close-up views of the famous Great Red Spot.
Thanks to everyone who works on these images.
Animation of six images acquired by NASA’s Juno spacecraft on March 27, 2017. Credit: NASA/JPL-Caltech/SwRI/MSSS/Jason Major.
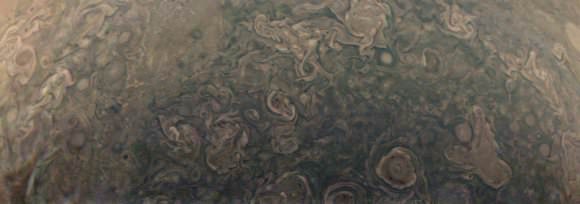
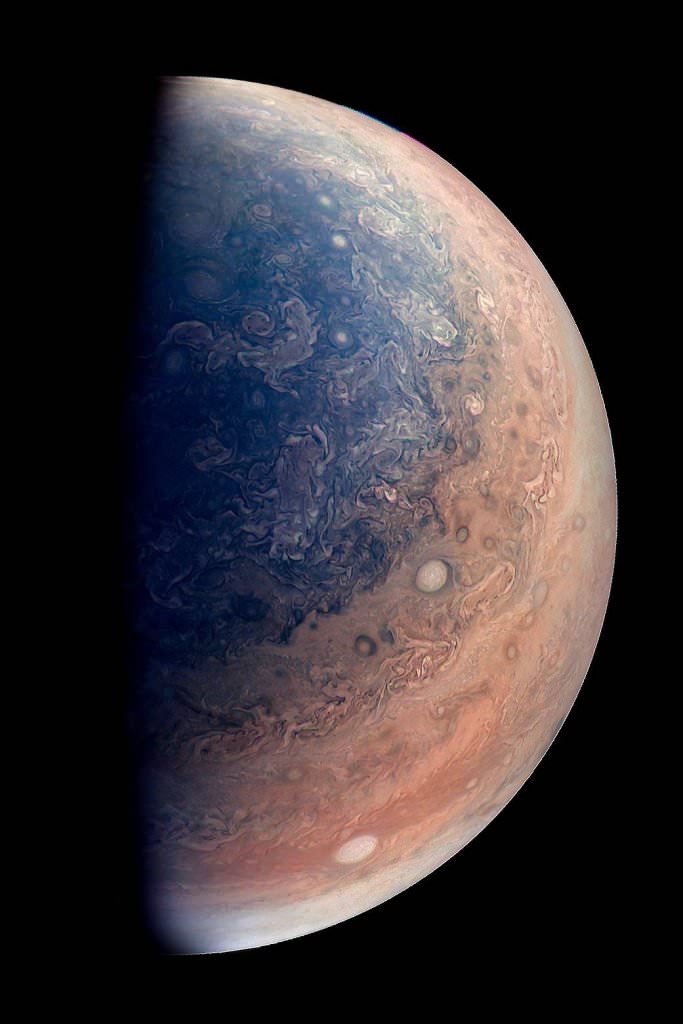
This enhanced color view of Jupiter’s south pole was created by citizen scientist Gabriel Fiset using data from the JunoCam instrument on NASA’s Juno spacecraft. Oval storms dot the cloudscape. Approaching the pole, the organized turbulence of Jupiter’s belts and zones transitions into clusters of unorganized filamentary structures, streams of air that resemble giant tangled strings. The image was taken on Dec. 11, 2016 at 9:44 a.m. PST (12:44 p.m. EST), from an altitude of about 32,400 miles (52,200 kilometers) above the planet’s beautiful cloud tops. Credits: NASA/JPL-Caltech/SwRI/MSSS/Gabriel Fiset
NASA's new app, the Globe Observer, will allow users to collect observations of clouds, and engage in a little citizen science. Image: NASA GLOBE Observer
It’s long been humanity’s dream to do something useful with our smartphones. Sure, we can take selfies, and post pictures of our meals, but true smartphone greatness has eluded us. Until now, that is.
Thanks to NASA, we can now do some citizen science with our ubiquitous devices.
For over 20 years, and in schools in over 110 countries, NASA’s Global Learning and Observations to Benefit the Environment (GLOBE) program has helped students understand their local environment in a global context. Now NASA has released the GLOBE Observer app, which allows users to capture images of clouds in their local environment, and share them with scientists studying the Earth’s climate.
“With the launch of GLOBE Observer, the GLOBE program is expanding beyond the classroom to invite everyone to become a citizen Earth scientist,” said Holli Riebeek Kohl, NASA lead of GLOBE Observer. The app will initially be used to capture cloud observations and images because they’re such an important part of the global climate system. But eventually, GLOBE Observer will also be used to observe land cover, and to identify types of mosquito larvae.
GLOBE has two purposes. One is to collect solid scientific data, the other is to increase users’ awareness of their own environments. “Once you collect environmental observations with the app, they are sent to the GLOBE data and information system for use by scientists and students studying the Earth,” said Kohl. “You can also use these observations for your own investigations and interact with a vibrant community of individuals from around the world who care about Earth system science and our global environment.”
Clouds are a dynamic part of the Earth’s climate system. Depending on their type, their altitude, and even the size of their water droplets, they either trap heat in the atmosphere, or reflect sunlight back into space. We have satellites to observe and study clouds, but they have their limitations. An army of citizen scientists observing their local cloud population will add a lot to the efforts of the satellites.
“Clouds are one of the most important factors in understanding how climate is changing now and how it’s going to change in the future,” Kohl said. “NASA studies clouds from satellites that provide either a top view or a vertical slice of the clouds. The ground-up view from citizen scientists is valuable in validating and understanding the satellite observations. It also provides a more complete picture of clouds around the world.”
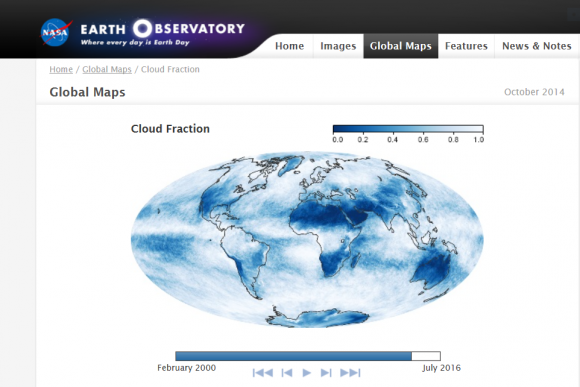
The observations collected by GLOBE users could end up as part of NASA’s Earth Observatory, which tracks the cloud fraction around the world. Image: NASA/NASA Earth Observation.
The GLOBE team has issued a challenge to any interested citizen scientists who want to use the app. Over the next two weeks, the team is hoping that users will make ground observations of clouds at the same time as a cloud-observing satellite passes overhead. “We really encourage all citizen scientists to look up in the sky and take observations while the satellites are passing over through Sept. 14,” said Kohl.
The app makes this easy to do. It informs users when a satellite will be passing overhead, so we can do a quick observation at that time. We can also use Facebook or Twitter to view daily maps of the satellite’s path.
“Ground measurements are critical to validate measurements taken from space through remote sensing,” said Erika Podest, an Earth scientist at NASA’s Jet Propulsion Laboratory in Pasadena, California, who is working with GLOBE data. “There are some places in the world where we have no ground data, so citizen scientists can greatly contribute to advancing our knowledge this important part of the Earth system.”
The app itself seems pretty straightforward. I checked for upcoming satellite flyovers and was notified of 6 flyovers that day. It’s pretty quick and easy to step outside and take an observation at one of those times.
I did a quick observation from the street in front of my house and it took about 2 minutes. To identify cloud types, you just match what you see with in-app photos of the different types of clouds. Then you estimate the percentage of cloud cover, or specify if the sky is obscured by blowing snow, or fog, or something else. You can also add pictures, and the app guides you in aiming the camera properly.
The GLOBE Observer app is easy to use, and kind of fun. It’s simple enough to fit a quick cloud observation in between selfies and meal pictures.
Download it and try it out.
You can download the IOS version from the App Store, and the Android version from Google Play.
A still photo from an animated flythrough of the universe using SDSS data. This image shows our Milky Way Galaxy. The galaxy shape is an artist’s conception, and each of the small white dots is one of the hundreds of thousands of stars as seen by the SDSS. Image credit:
Dana Berry / SkyWorks Digital, Inc. and Jonathan Bird (Vanderbilt University)
Imagine a single mission that would allow you to explore the Milky Way and beyond, investigating cosmic chemistry, hunting planets, mapping galactic structure, probing dark energy and analyzing the expansion of the wider Universe. Enter the Sloan Digital Sky Survey, a massive scientific collaboration that enables one thousand astronomers from 51 institutions around the world to do just that.
At Tuesday’s AAS briefing in Seattle, researchers announced the public release of data collected by the project’s latest incarnation, SDSS-III. This data release, termed “DR12,” represents the survey’s largest and most detailed collection of measurements yet: 2,000 nights’ worth of brand-new information about nearly 500 million stars and galaxies.
One component of SDSS is exploring dark energy by “listening” for acoustic oscillation signals from the the acceleration of the early Universe, and the team also shared a new animated “fly-through” of the Universe that was created using SDSS data.
The SDSS-III collaboration is based at the powerful 2.5-meter Sloan Foundation Telescope at the Apache Point Observatory in New Mexico. The project itself consists of four component surveys: BOSS, APOGEE, MARVELS, and SEGUE. Each of these surveys applies different trappings to the parent telescope in order to accomplish its own, unique goal.
BOSS (the Baryon Oscillation Spectroscopic Survey) visualizes the way that sound waves produced by interacting matter in the early Universe are reflected in the large-scale structure of our cosmos. These ancient imprints, which date back to the first 500,000 years after the Big Bang, are especially evident in high-redshift objects like luminous-red galaxies and quasars. Three-dimensional models created from BOSS observations will allow astronomers to track the expansion of the Universe over a span of 9 billion years, a feat that, later this year, will pave the way for rigorous assessment of current theories regarding dark energy.
At the press briefing, Daniel Eistenstein from the Harvard-Smithsonian Center for Astrophysics explained how BOSS requires huge volumes of data and that so far 1.4 million galaxies have been mapped. He indicated the data analyzed so far strongly confirm dark energy’s existence.
This tweet from the SDSS twitter account uses a bit of humor to explain how BOSS works:
It turns out that in space, everyone can hear you scream, if you do it in the early Universe and set up acoustic oscillations #aas225
APOGEE (the Apache Point Observatory Galactic Evolution Experiment) employs a sophisticated, near-infrared spectrograph to pierce through thick dust and gather light from 100,000 distant red giants. By analyzing the spectral lines that appear in this light, scientists can identify the signatures of 15 different chemical elements that make up the faraway stars – observations that will help researchers piece together the stellar history of our galaxy.
MARVELS (the Multi-Object APO Radial Velocity Exoplanet Large-Area Survey) identifies minuscule wobbles in the orbits of stars, movements that betray the gravitational influence of orbiting planets. The technology itself is unprecedented. “MARVELS is the first large-scale survey to measure these tiny motions for dozens of stars simultaneously,” explained the project’s principal investigator Jian Ge, “which means we can probe and characterize the full population of giant planets in ways that weren’t possible before.”
At the press briefing, Ge said that MARVELS observed 5,500 stars repeatedly, looking for giant exoplanets around these stars. So far, the data has revealed 51 giant planet candidates as well as 38 brown dwarf candidates. Ge added that more will be found with better data processing.
A still photo from an animated flythrough of the universe using SDSS data. This image shows a small part of the large-scale structure of the universe as seen by the SDSS — just a few of many millions of galaxies. The galaxies are shown in their proper positions from SDSS data. Image credit: Dana Berry / SkyWorks Digital, Inc.
SEGUE (the Sloan Extension for Galactic Understanding and Exploration) rounds out the quartet by analyzing visible light from 250,000 stars in the outer reaches of our galaxy. Coincidentally, this survey’s observations “segue” nicely into work being done by other projects within SDSS-III. Constance Rockosi, leader of the SDSS-III domain of SEGUE, recaps the importance of her project’s observations of our outer galaxy: “In combination with the much more detailed view of the inner galaxy from APOGEE, we’re getting a truly holistic picture of the Milky Way.”
One of the most exceptional attributes of SDSS-III is its universality; that is, every byte of juicy information contained in DR12 will be made freely available to professionals, amateurs, and lay public alike. This philosophy enables interested parties from all walks of life to contribute to the advancement of astronomy in whatever capacity they are able.
As momentous as the release of DR12 is for today’s astronomers, however, there is still much more work to be done. “Crossing the DR12 finish line is a huge accomplishment by hundreds of people,” said Daniel Eisenstein, director of the SDSS-III collaboration, “But it’s a big universe out there, so there is plenty more to observe.”
DR12 includes observations made by SDSS-III between July 2008 and June 2014. The project’s successor, SDSS-IV, began its run in July 2014 and will continue observing for six more years.
Here is the video animation of the fly-through of the Universe:
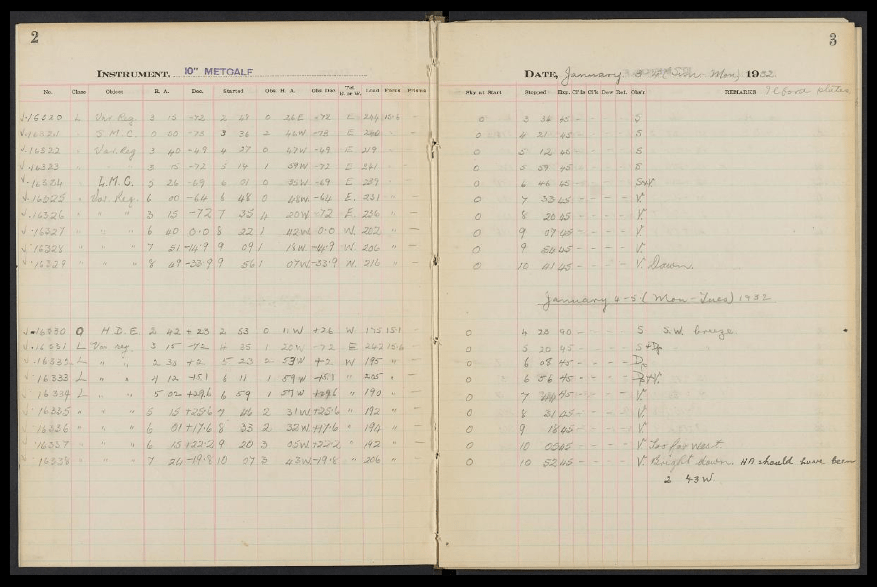
An example of a telescope logbook waiting to be transcribed. Credit: Smithsonian
An old brick building on Harvard’s Observatory Hill is overflowing with rows of dark green cabinets — each one filled to the brim with hundreds of astronomical glass plates in paper sleeves: old-fashioned photographic negatives of the night sky.
All in all there are more than 500,000 plates preserving roughly a century of information about faint happenings across the celestial sphere. But they’re gathering dust. So the Harvard College Observatory is digitizing its famed collection of glass plates. One by one, each plate is placed on a scanner capable of measuring the position of each tiny speck to within 11 microns. The finished produce will lead to one million gigabytes of data.
But each plate must be linked to a telescope logbook — handwritten entries recording details like the date, time, exposure length, and location in the sky. Now, Harvard is seeking your help to transcribe these logbooks.
The initial project is called Digital Access to a Sky Century at Harvard (DASCH). Although it has been hard at work scanning roughly 400 plates per day, without the logbook entries to accompany each digitized plate, information about the brightness and position of each object would be lost. Whereas with that information it will be possible to see a 100-year light curve of any bright object within 15 degrees of the north galactic pole.
The century of data allows astronomers to detect slow variations over decades, something otherwise impossible in today’s recent digital era.
Assistant Curator David Sliski is especially excited about the potential overlap in our hunt for exoplanets. “It covers the Kepler field beautifully,” Sliski told Universe Today. It should also be completed by the time next-generation exoplanet missions (such as TESS, PLATO, and Kepler 2) come online — allowing astronomers to look for long-term variability in a host star that may potentially affect an exoplanet’s habitability.
There are more than 100 logbooks containing about 100,000 pages of text. Volunteers will type in a few numbers per line of text onto web-based forms. It’s a task impossible for any scanner since optical character recognition doesn’t work on these hand-written entries.
Harvard is partnering with the Smithsonian Transcription Center to recruit digital volunteers. The two will then be able to bring the historic documents to a new, global audience via the web. To participate in this new initiative, visit Smithsonian’s transcription site here.
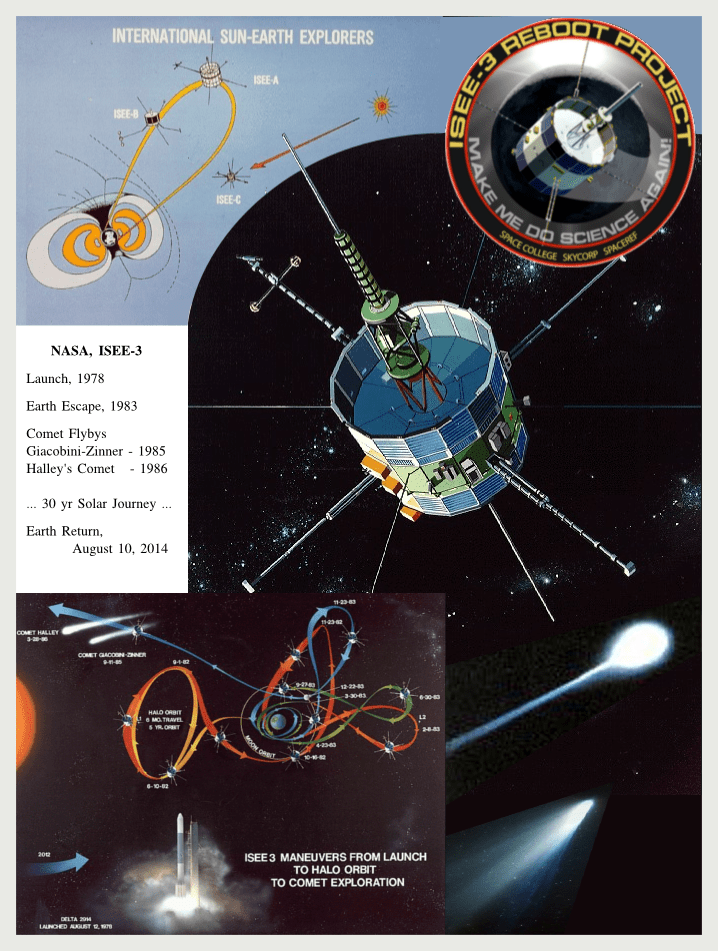
A graphic illustrating the ISEE-3 spacecraft's history. Courtesy Tim Reyes.
What is it like to make contact with a 36-year old dormant spacecraft?
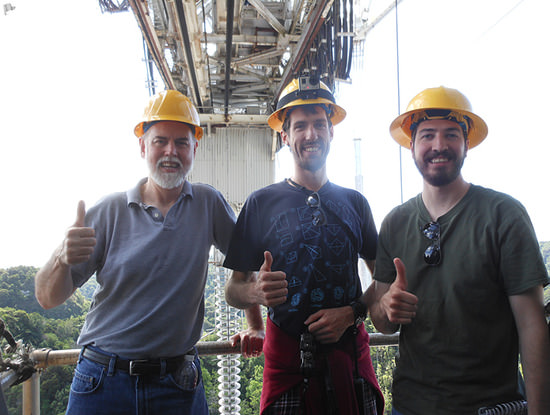
“The intellectual side of you systematically goes through all the procedures but you really end up doing a happy dance when it actually works,” Keith Cowing told Universe Today. Cowing, most notably from NASA Watch.com, and businessman Dennis Wingo are leading a group of volunteer engineers that are attempting to reboot the International Sun-Earth Explorer (ISEE-3) spacecraft after it has traveled 25 billion kilometers around the Solar System the past 30 years.
Its initial mission launched in 1978 to study Earth’s magnetosphere, and the spacecraft was later repurposed to study two comets. Now, on its final leg of a 30-plus year journey and heading back to the vicinity of Earth, the crowdfunding effort ISEE-3 Reboot has been working to reactivate the hibernating spacecraft since NASA wasn’t able to provide any funds to do so.
The team awakened the spacecraft by communicating from the Arecibo radio telescope in Puerto Rico, using a donated transmitter. While most of the team has been in Puerto Rico, Cowing is back at home in the US manning the surge of media attention this unusual mission has brought.
Those at Arecibo are now methodically going through all the systems, figuring out what the spacecraft can and can’t do.
“We did determine the spin rate of spacecraft is slightly below what it should be,” Cowing said, “but the point there is that we’re now understanding the telemetry that we’re getting and its coming back crystal clear.”
For you tech-minded folks, the team determined the spacecraft is spinning at 19.16 rpm. “The mission specification is 19.75 +/- 0.2 rpm. We have also learned that the spacecraft’s attitude relative to the ecliptic is 90.71 degrees – the specification is 90 +/- 1.5 degrees. In addition, we are now receiving information from the spacecraft’s magnetometer,” Cowing wrote in an update on the website.
The next task will be looking at the propulsion system and making sure they can actually fire the engines for a trajectory correction maneuver (TCM), currently targeted for June 17.
One thing this TCM will do is to make sure the spacecraft doesn’t hit the Moon. Initial interactions with the ISEE-3 from Arecibo showed the spacecraft was not where the JPL ephemeris predicted it was going to be.
“That’s a bit troublesome because if you look at the error bars, it could hit Moon, or even the Earth, which is not good,” Cowing said, adding that they’ve since been able to refine the trajectory and found the ephemeris was not off as much as initially thought, and so such an impact is quite unlikely.
“However, it’s not been totally ruled out, — as NASA would say it’s a not a non-zero chance,” Cowing said. “The fact that it was not where it was supposed to be shows there were changes in its position. But assuming we can fire the engines when we want to, it shouldn’t be a problem. As it stands now, if we didn’t do anything, the chance of it hitting the Moon is not zero. But it’s not that likely.”
But the fact that the predicted location of the spacecraft is only off by less than 30,000 km is actually pretty amazing.
Consider this, the spacecraft has completed almost 27 orbits of the sun since the last trajectory maneuver. That is 24.87 billion kilometers. They are off course by less than 30,000 km. I can’t even come up with an analogy to how darn good that is!! That is almost 1 part in ten million accuracy! We need to confirm this with a DSN ranging, but if this holds, the fuel needed to accomplish the trajectory change is only about 5.8 meters/sec, or less than 10% of what we thought last week!
We truly stand on the shoulders of steely eyed missile men giants..
Dennis Wingo and ISEE-3 Reboot engineers at Arecibo. Image courtesy ISEE-3 Reboot.
In 1982, NASA engineers at Goddard Space Flight Center, led by Robert Farquhar devised the maneuvers needed to send the spacecraft ISEE-3 out of the Earth-Moon system. It was renamed the International Cometary Explorer (ICE) to rendezvous with two comets – Giacobini-Zinner in 1985 and Comet Halley in 1986.
“Bob Farquhar and his team initially did it with pencils on the back of envelopes,” Cowing said, “so it is pretty amazing. And we’re really happy with the trajectory because we’ll need less fuel – we have 150 meters per second of fuel available, and we’ll only need about 6 meters per second of maneuvering, so that will give us a lot of margin to do the other things in terms of the final orbit, so we’re happy with that. But we have to fire the engines first before we pat ourselves on the back.”
And that’s where the biggest challenge of this amateur endeavor lies.
“The biggest challenge will be getting the engines to fire,” Cowing said. “The party’s over if we can’t get it to do that. The rest will be gravy. So that’s what we’re focusing on now.”
After the June 17 TCM, the next big date is August 10, when the team will attempt to put the spacecraft in Earth orbit and then resume its original mission that began back in 1978 – all made possible by volunteers and crowdfunding.
We’ll keep you posted on this effort, but follow the ISEE-3 Reboot Twitter feed, which is updated frequently and immediately after anything happens with the spacecraft. Also, for more detailed updates, check out the SpaceCollege website.
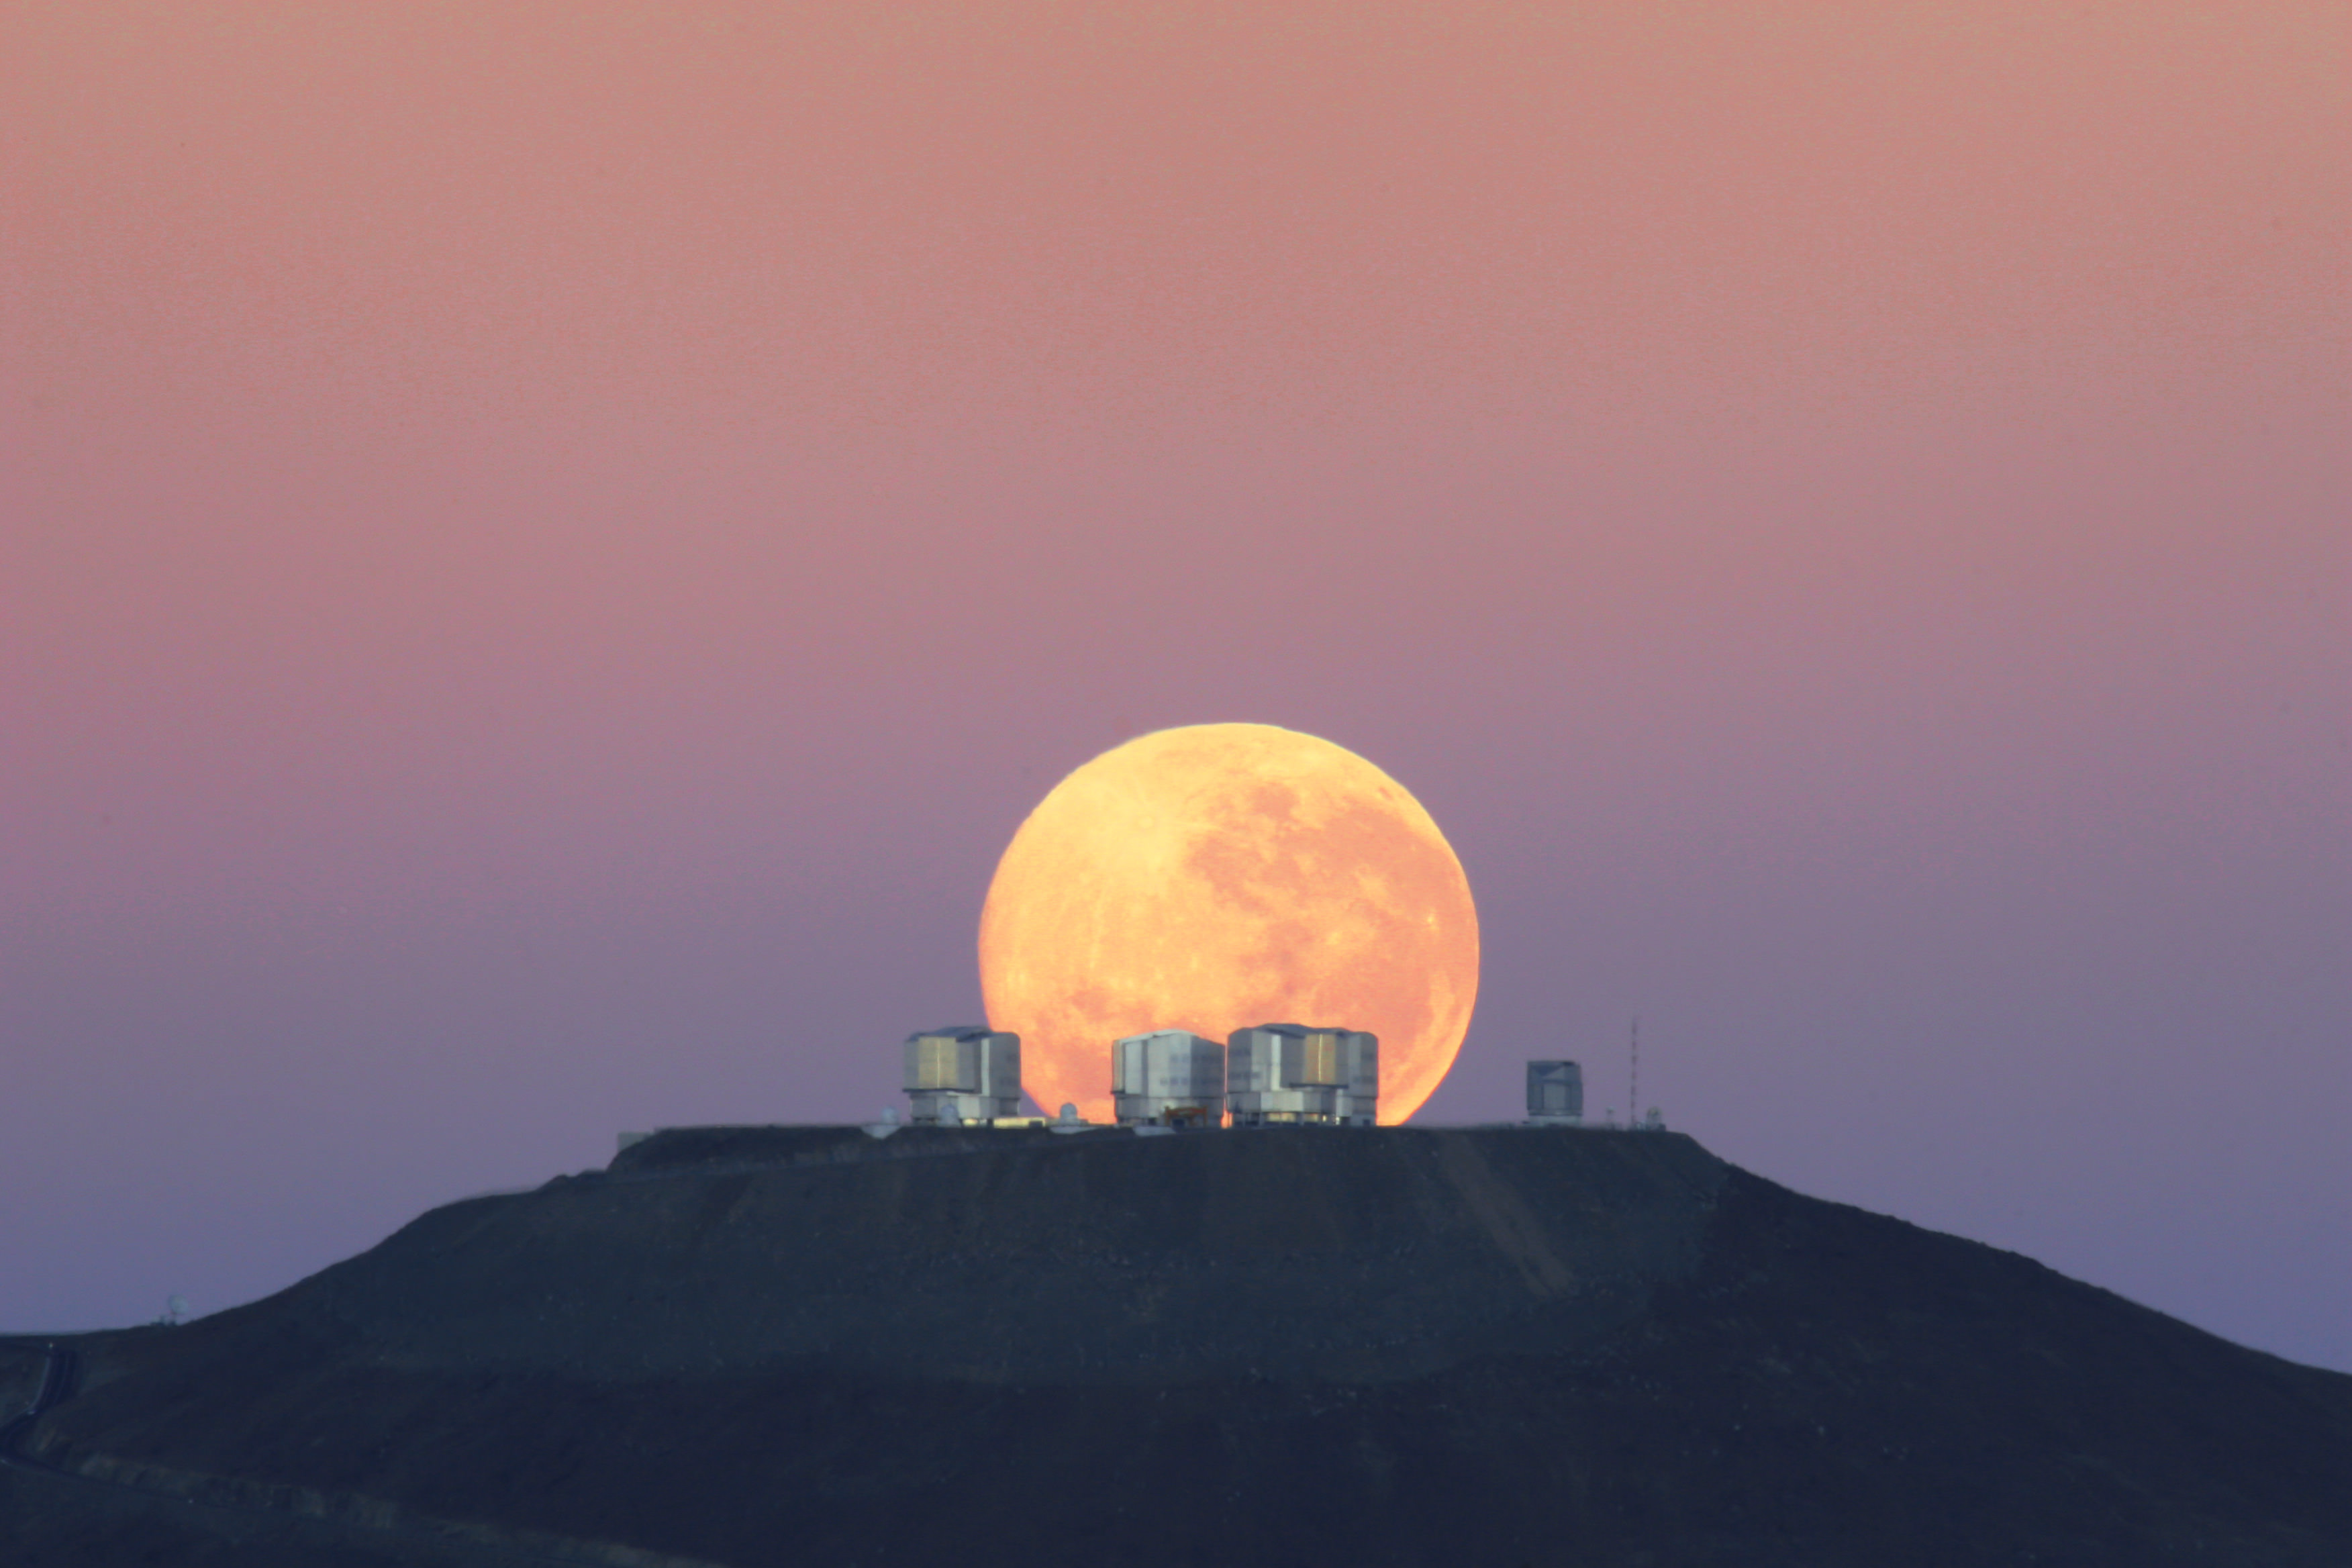
The dazzling full moon sets behind the Very Large Telescope in Chile’s Atacama Desert in this photo released June 7, 2010 by the European Southern Observatory. The moon appears larger than normal due to an optical illusion of perspective.
Image Credit: Gordon Gillet, ESO.
Astronomy is a discipline pursued at a distance. And yet, actually measuring that last word — distance — can be incredibly tricky, even if we set our sights as nearby as the Moon.
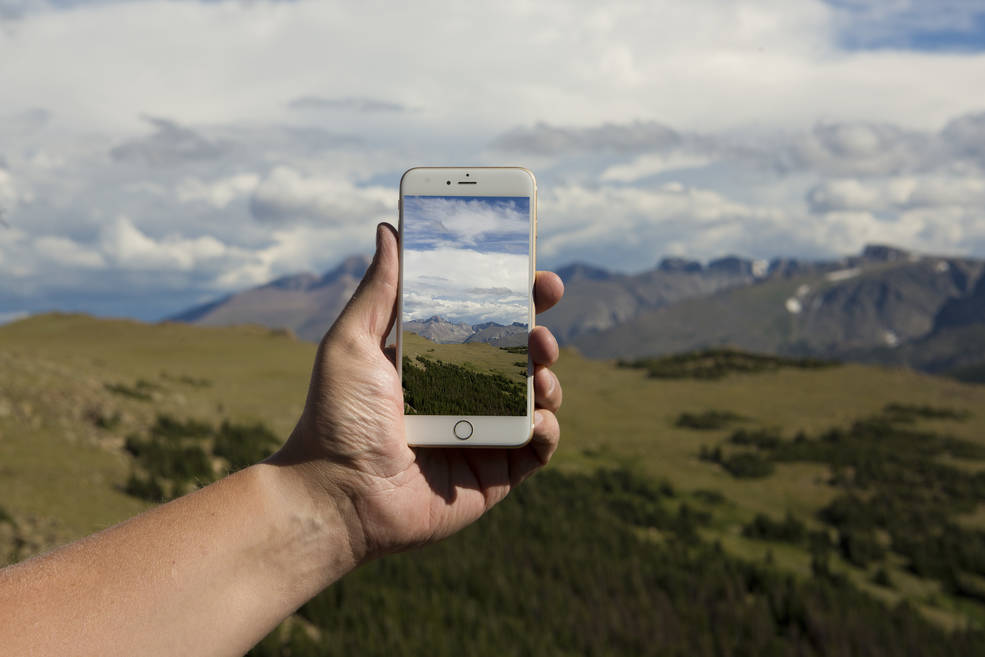
But now astronomers from the University of Antioquia, Colombia, have devised a clever method that allows citizen scientists to measure the Moon’s distance with only their digital camera and smartphone.
“Today a plethora of advanced and accessible technological devices such as smartphones, tablets, digital cameras and precise clocks, is opening a new door to the realm of ‘do-it-yourself-science’ and from there to the possibility of measuring the local Universe by oneself,” writes lead author Jorge Zuluaga in his recently submitted paper.
While ancient astronomers devised clever methods to measure the local Universe, it took nearly two millennia before we finally perfected the distance to the Moon. Now, we can bounce powerful lasers off the mirrors placed on the Lunar surface by the Apollo Astronauts. The amount of time it takes for the laser beam to return to Earth gives an incredibly precise measurement of the Moon’s distance, within a few centimeters.
But this modern technique is “far from the realm and technological capacities of amateur astronomers and nonscientist citizens,” writes Zuluaga. In order to bring the local Universe into the hands of citizen scientists, Zuluaga and colleagues have devised an easy method to measure the distance to the Moon.
The trick is in observing how the apparent size of the Moon changes with time.
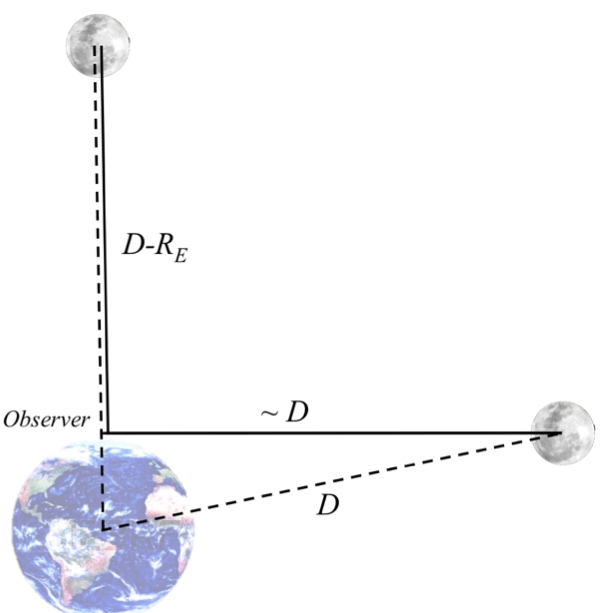
As the moon rises its distance to an observer on the surface of the Earth is slightly reduced. Image Credit: Zuluaga et al.
While the Moon might seem larger, and therefore closer, when it’s on the horizon than when it’s in the sky — it’s actually the opposite. The distance from the Moon to any observer on Earth decreases as the Moon rises in the sky. It’s more distant when it’s on the horizon than when it’s at the Zenith. Note: the Moon’s distance to the center of the Earth remains approximately constant throughout the night.
The direct consequence of this is that the angular size of the moon is larger — by as much as 1.7 percent — when it’s at the Zenith than when it’s on the horizon. While this change is far too small for our eyes to detect, most modern personal cameras have now reached the resolution capable of capturing the difference.
So with a good camera, a smart phone and a little trig you can measure the distance to the Moon yourself. Here’s how:
1.) Step outside on a clear night when there’s a full Moon. Set your camera up on a tripod, pointing at the Moon.
2.) With every image of the Moon you’ll need to know the Moon’s approximate elevation. Most smartphones have various apps that allow you to measure the camera’s angle based on the tilt of the phone. By aligning the phone with the camera you can measure the elevation of the Moon accurately.
3.) For every image you’ll need to measure the apparent diameter of the Moon in pixels, seeing an increase as the Moon rises higher in the sky.
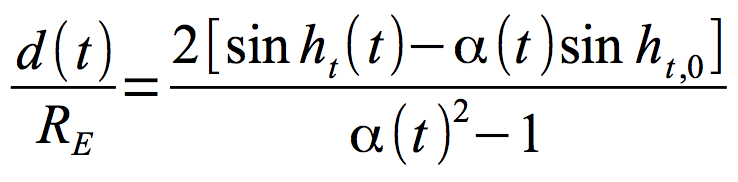
4.) Lastly, the Moon’s distance can be measured from only two images (of course the more images the better you beat down any error) using this relatively simple equation:
where d(t) is the distance from the Moon to your location on Earth, RE is the radius of the Earth, ht(t) is the elevation of the Moon for your second image, α(t)
is the relative apparent size of the Moon, or the apparent size of the Moon in your second image divided by the initial apparent size of the Moon in your first image and ht,0 is the initial elevation of the Moon for your first image.
So with a few pictures and a little math, you can measure the distance to the Moon.
“Our aim here is not to provide an improved measurement of a well-known astronomical quantity, but rather to demonstrate how the public could be engaged in scientific endeavors and how using simple instrumentation and readily available technological devices such as smartphones and digital cameras, any person can measure the local Universe as ancient astronomers did,” writes Zuluaga.
The paper has been submitted to the American Journal of Physics and is available for download here.