A Single Wave, Bigger Than the Milky Way, is Rolling Through the Perseus Galaxy Cluster

NASA has discovered a wave of hot gas larger than the Milky Way rolling through the Perseus galaxy cluster. This X-ray image is the result of 16 days of observing with the Chandra X-ray Observatory. The image was filtered to make details easier to see.Credit: NASA's Goddard Space Flight Center/Stephen Walker et al.
NASA has discovered a wave of hot gas larger than the Milky Way  rolling through the Perseus galaxy cluster. This X-ray image is the result of 16 days of observing with the Chandra X-ray Observatory. The image was filtered to make details easier to see. Credits: NASA's Goddard Space Flight Center/Stephen Walker et al.
NASA has discovered a wave of hot gas larger than the Milky Way rolling through the Perseus galaxy cluster. This X-ray image is the result of 16 days of observing with the Chandra X-ray Observatory. The image was filtered to make details easier to see. Credits: NASA’s Goddard Space Flight Center/Stephen Walker et al.

An international team of scientists has discovered an enormous wave of hot gas rolling its way through the Perseus galaxy cluster. The wave is a giant version of what’s called a Kelvin-Helmholtz wave. They’re created when two fluids intersect at different velocities: for example, when wind blows over water.

In this instance, the wave was caused by a small galaxy cluster grazing the Perseus cluster, and setting off a chain of events lasting billions of years. The findings appear in a paper in the June 2017 issue of the journal Monthly Notices of the Royal Astronomical Society.

“The wave we’ve identified is associated with the flyby of a smaller cluster, which shows that the merger activity that produced these giant structures is still ongoing.” – Stephen Walker, NASA’s Goddard Space Flight Center.

“Perseus is one of the most massive nearby clusters and the brightest one in X-rays, so Chandra data provide us with unparalleled detail,” said lead scientist Stephen Walker at NASA’s Goddard Space Flight Center in Greenbelt, Maryland. “The wave we’ve identified is associated with the flyby of a smaller cluster, which shows that the merger activity that produced these giant structures is still ongoing.”

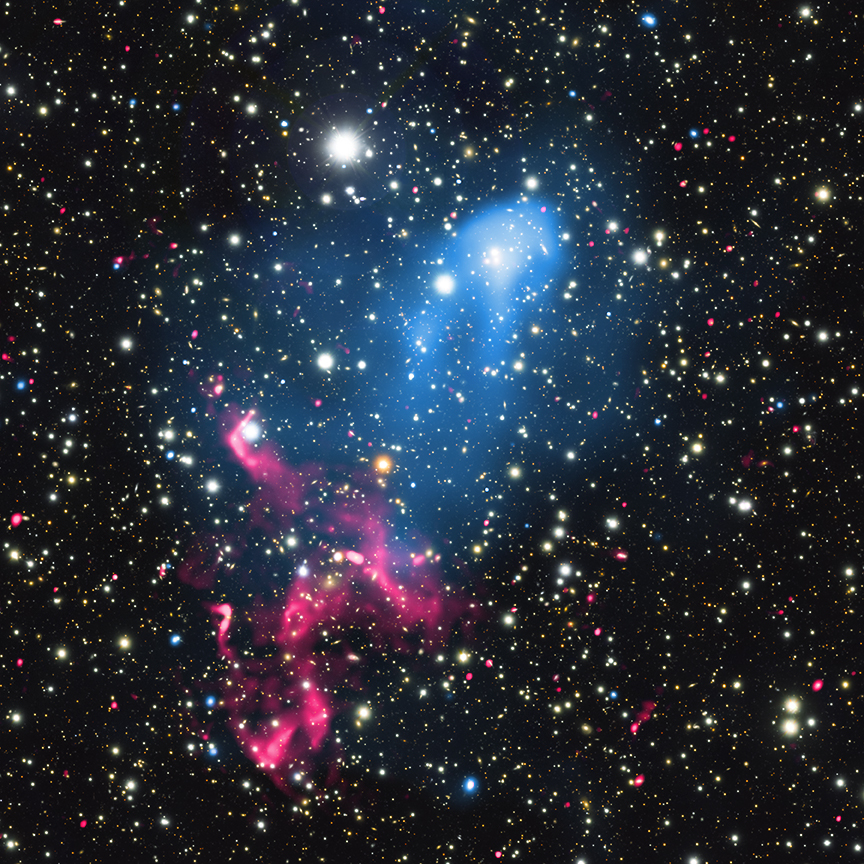
The Perseus galaxy cluster, also known as Abell 426, is 240 million light years away, and is about 11 million light years across. It’s one of the most massive objects we know of, and it’s named after the Perseus constellation, which appears in the same part of the sky.

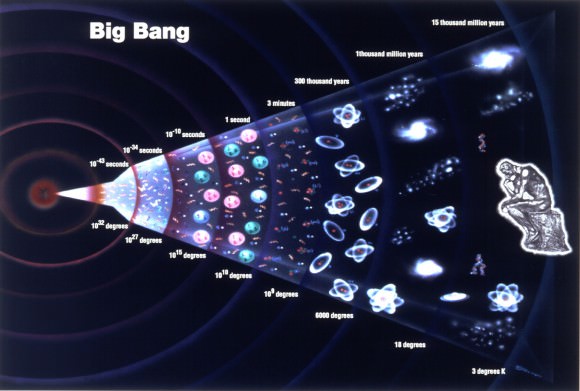
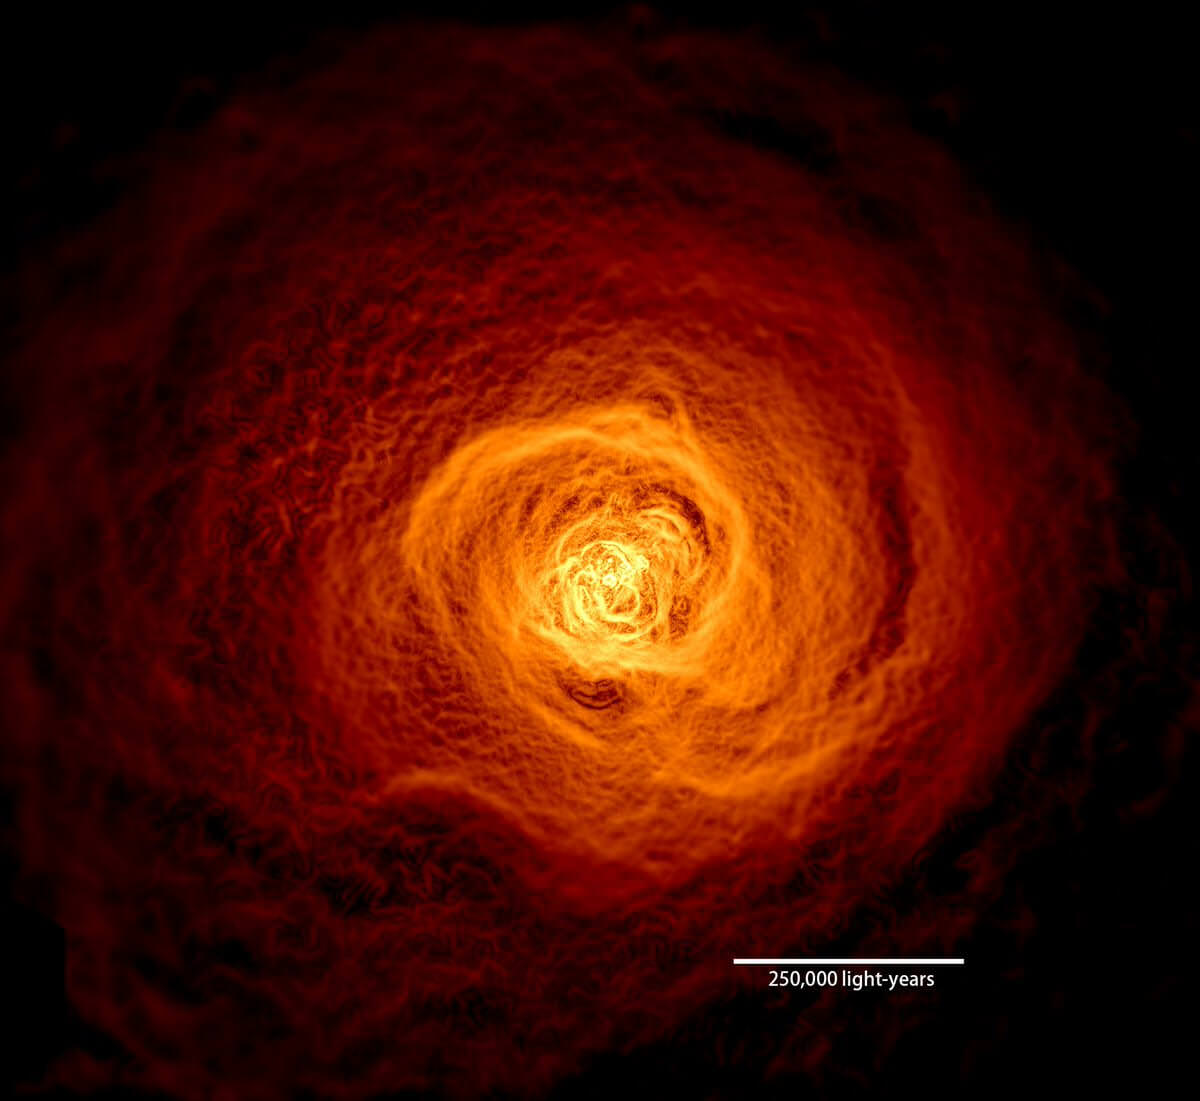
Galaxy clusters are the largest gravitationally-bound objects in the Universe. Most of the observable matter in galaxy clusters is gas. But the gas is super hot—tens of millions of degrees hot—which means it emits x-rays.

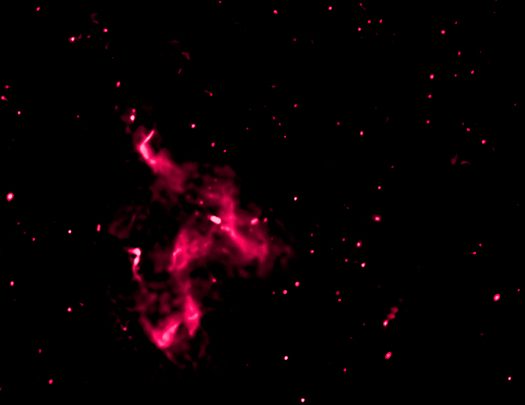
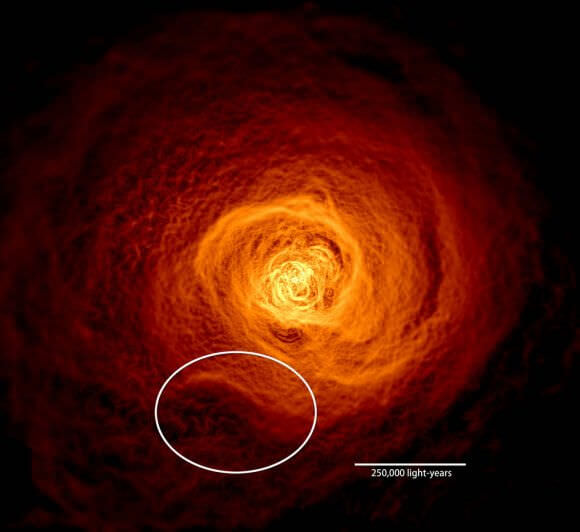
X-Ray observations of Perseus have revealed several features and structures in the gas structure of the cluster. Some of them are bubble-like features caused by the super-massive black hole (SMBH) in NGC 1275, the Perseus cluster’s central galaxy. Another of these features is known as “the bay.” The bay is a concave feature which couldn’t have been formed by the SMBH.

This Hubble image shows NGC 1275, the Super-Massive Black Hole at the center of the Perseus cluster. NGC 1275 could not have been responsible for the "bay" feature found in Perseus. Image: By NASA, ESA, and the Hubble Heritage (STScI/AURA)-ESA/Hubble Collaboration - http://hubblesite.org/newscenter/archive/releases/2008/28/image/a/, Public Domain, https://commons.wikimedia.org/w/index.php?curid=4634173
This Hubble image shows NGC 1275, the Super-Massive Black Hole at the center of the Perseus cluster. NGC 1275 could not have been responsible for the “bay” feature found in Perseus. Image: By NASA, ESA, and the Hubble Heritage (STScI/AURA)-ESA/Hubble Collaboration – http://hubblesite.org/newscenter/archive/releases/2008/28/image/a/, Public Domain, https://commons.wikimedia.org/w/index.php?curid=4634173

The bay is a puzzle because it doesn’t produce any emissions, which would be expected of something formed by a SMBH. The bay also doesn’t conform to models of how gas should behave in this situation.

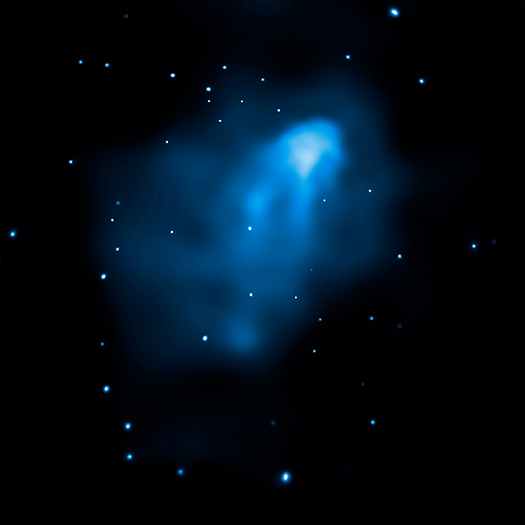
The lead scientist behind the study is Stephen Walker at NASA’s Goddard Space Flight Center. Walker turned to the Chandra X-ray Observatory to help solve this puzzle. Existing Chandra images of the Perseus cluster were filtered in order to highlight the edges of structures, and to make any subtle details more visible.

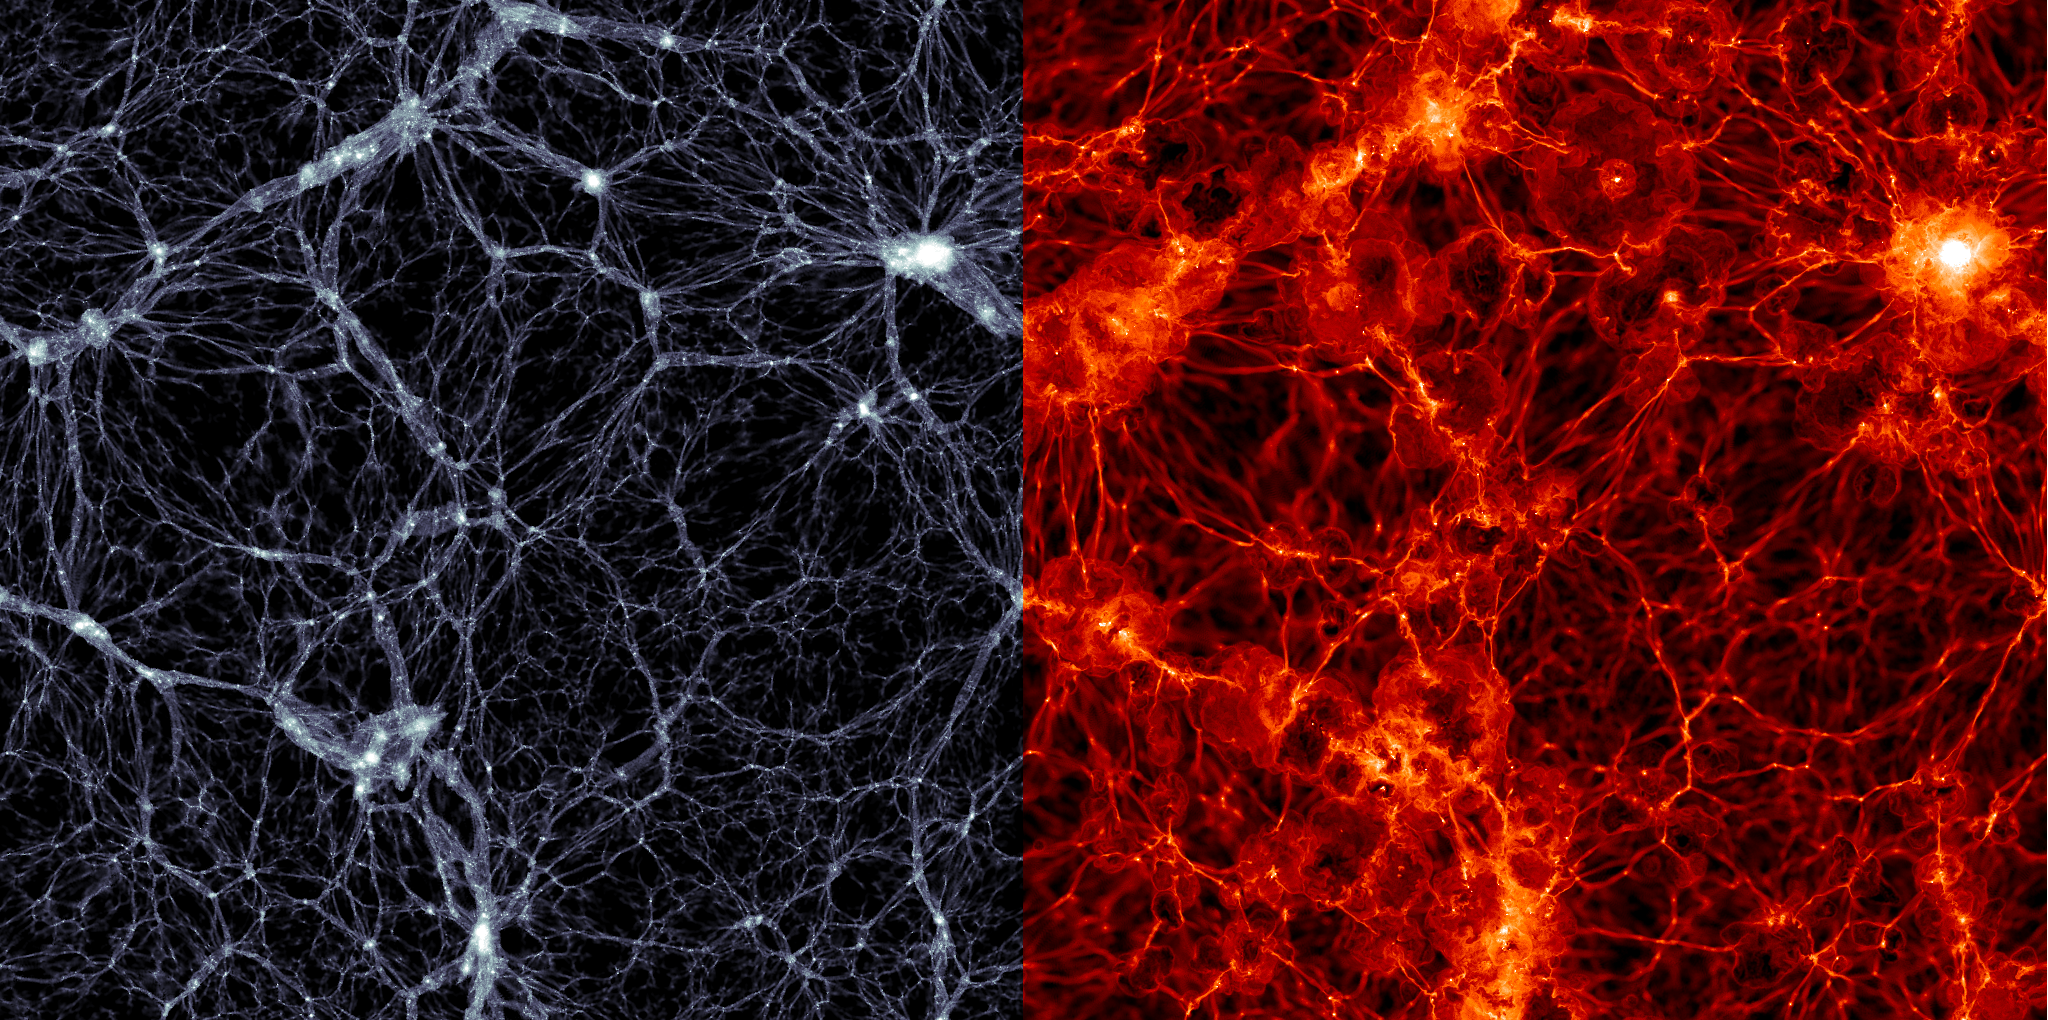
These filtered and processed images were then compared to computer simulations of galaxy clusters merging. John ZuHone, an astrophysicist at the Harvard-Smithsonian Center for Astrophysics, has created an online catalog of these simulations.

“Galaxy cluster mergers represent the latest stage of structure formation in the cosmos.” -John ZuHone, Harvard-Smithsonian Center for Astrophysics.

“Galaxy cluster mergers represent the latest stage of structure formation in the cosmos. Hydrodynamic simulations of merging clusters allow us to produce features in the hot gas and tune physical parameters, such as the magnetic field. Then we can attempt to match the detailed characteristics of the structures we observe in X-rays.” -John ZuHone, Harvard-Smithsonian Center for Astrophysics.

This alternate image of the Perseus galaxy cluster shows the wave at the 7 o'clock position. Image: NASA's Goddard Space Flight Center/Stephen Walker et al.
This alternate image of the Perseus galaxy cluster shows the wave at the 7 o’clock position. Image: NASA’s Goddard Space Flight Center/Stephen Walker et al.

One of the simulations matched what astronomers were seeing in Perseus. In it, a large cluster like Perseus had settled itself into two regions: a colder region of gas around 30 million degrees Celsius, and a hotter region of gas at almost 100 million degrees Celsius. In this model, a cluster smaller than Perseus, but about a thousand times more massive than the Milky Way passes close to Perseus, missing its center by about 650,000 light years.

That happened about 2.5 billion years ago, and it set off a chain of events still playing itself out.

The near miss caused a gravitational disturbance that created an expanding spiral of the colder gas. An enormous wave of gas has formed at the edge of the spiral of colder gas, where it intersects with the hotter gas. This is the Kelvin-Helmholtz wave seen in the images.

“We think the bay feature we see in Perseus is part of a Kelvin-Helmholtz wave, perhaps the largest one yet identified, that formed in much the same way as the simulation shows,” Walker said. “We have also identified similar features in two other galaxy clusters, Centaurus and Abell 1795.”

The study provided another benefit besides just spotting an impossibly enormous wave. It allowed the team to measure the magnetic properties of the Perseus cluster. The researchers discovered that the strength of the magnetic field in the cluster affected the size of the wave of gas. It the field is too strong, the waves don’t form at all, and if the magnetic field is too weak, then the waves would be even larger.

According to the team, there is no other known way to measure the magnetic field.

Source: Scientists Find Giant Wave Rolling Through the Perseus Galaxy Cluster

Deepest X-ray Image Ever Made Contains Mysterious Explosion

A mysterious flash of X-rays has been discovered by NASA’s Chandra X-ray Observatory in the deepest X-ray image ever obtained. Credit: NASA/Chandra/Harvard

For over sixty years, astronomers have been exploring the Universe for x-ray sources. Known to be associated with stars, clouds of super heated gas, interstellar mediums, and destructive events, the detection of cosmic x-rays is challenging work. In recent decades, astronomers have been benefited immensely from by the deployment of orbital telescopes like the Chandra X-ray Observatory.

Since it was launched on July 23rd, 1999, Chandra has been NASA’s flagship mission for X-ray astronomy. And this past week (on Thurs. March 30th, 2017), the Observatory accomplished something very impressive. Using its suite of advanced instruments, the observatory captured a mysterious flash coming from deep space. Not only was this the deepest X-ray source ever observed, it also revealed what could be an entirely new phenomenon.

Located in the region of the sky known as the Chandra Deep Field-South (CDF-S), this X-ray emission source appeared to have come from a small galaxy located approximately 10.7 billion light-years from Earth. It also had some remarkable properties, producing more energy in the space of a few minutes that all the stars in the galaxy combined.

Artist illustration of the Chandra X-ray Observatory, the most sensitive X-ray telescope ever built. Credit: NASA/CXC/NGST

Originally detected in 2014 by a team of researchers from Penn State University and the Pontifical Catholic University of Chile in Santiago, Chile, this source was not even detected in the X-ray band at first. However, it quickly caught the team’s attention as it erupted and became 1000 brighter in the space of a few hours. At this point, the researchers began gathering data using Chandra’s Advanced CCD Imaging Spectronomer.

A day after the flare-up, the X-ray source had faded to the point that Chandra was no longer able to detect it. As Niel Brandt – the Verne M. Willaman Professor of Astronomy and Astrophysics at Penn State and part of the team that first observed it – described the discovery in a Penn State press release:

“This flaring source was a wonderful surprise bonus that we accidentally discovered in our efforts to explore the poorly understood realm of the ultra-faint X-ray universe. We definitely ‘lucked out’ with this find and now have an exciting new transient phenomenon to explore in future years.”

Thousands of hours of legacy data from the Hubble and Spitzer Space Telescopes was then consulted in order to determine the location of the CDF-S X-ray source. And though scientists were able to determine that the image of the X-ray source placed it beyond any that had been observed before, they are not entirely clear as to what could have caused it.

X-ray (left) and optical (right) images of the space around the X-ray source, made with Chandra and the Hubble Space Telescope, respectively. Credit: NASA/CXC/F. Bauer et al.

On the one hand, it could be the result of some sort of destructive event, or something scientists have never before seen. The reason for this has to do with the fact that X-ray bursts also come with a gamma-ray burst (GRB), which appears to be missing here. Essentially, GRBs are jetted explosions that are triggered by the collapse of a massive star or by the merger of two neutron stars (or a neutron star with a black hole).

Because of this, three possible explanations have been suggested. In the first, the CDF-S X-ray source is indeed the result of a collapsing star or merger, but the resulting jets are not pointed towards Earth. In the second, the same scenario is responsible for the x-ray source, but the GRB lies beyond the small galaxy. The third possible explanation is that the event was caused by a medium-sized black hole shredding a white dwarf star.

Unfortunately, none of these explanations seem to fit the data. However, these research team also noted that these possibilities are not that well understood, since none have been witnessed in the Universe. As Franz Bauer – an astronomer from the Pontifical Catholic University of Chile – said: “Ever since discovering this source, we’ve been struggling to understand its origin. It’s like we have a jigsaw puzzle but we don’t have all of the pieces.”

Not only has Chandra not observed any other X-ray sources like this one during the 17 years it has surveyed the CDF-S region, but no similar events have been observed by the space telescope anywhere in the Universe during its nearly two decades of operation. On top of that, this event was brighter, more short-lived, and occurred in a smaller, younger host galaxy than other unexplained X-ray sources.

Still image of the X-ray source observed by Chandra, showing the captured flare up at bottom Credit: NASA/CXC/Pontifical Catholic Univ./F.Bauer et al.

From all of this, the only takeaway appears to be that the event was likely the result of a cataclysmic event, like a neutron star or a white dwarf being torn apart. But the fact that none of the more plausible explanations seem to account for it’s peculiar characteristics would seem to suggest that astronomers may have witnessed an entirely new kind of cataclysmic event.

The team’s study – “A New, Faint Population of X-ray Transient“- is available online and will be published in the June 2017 issue of the Monthly Notices of the Royal Astronomical Society. In the meantime, astronomers will be sifting through the data acquired by Chandra and other X-ray observatories – like the ESA’s XMM-Newton and NASA’s Swift Gamma-Ray Burst Mission – to see if they can find any other instances of this kind of event.

And of course, future surveys conducted using Chandra and next-generation X-ray telescopes will also be on the lookout for these kind of short-lived, high-energy X-ray bursts. It’s always good when the Universe throws us a curve ball. Not only does it show us that we have more to learn, but it also teaches us that we must never grow complacent in our theories.

Be sure to check out this animation of the CDF-S X-ray source too, courtesy of the Chandra X-ray Observatory:

Further Reading:  Chandra, PennState

Supernova Blast Wave Still Visible After 30 Years

To celebrate 30 years since Supernova 1987A was spotted, a new composite image shows the most recent images of the object, and contains X-rays from NASA's Chandra X-ray Observatory (blue), visible light data from NASA's Hubble Space Telescope (green), and submillimeter wavelength data from the international Atacama Large Millimeter/submillimeter Array (ALMA) telescope in Chile (red).

30 years ago today, a supernova explosion was spotted in the southern hemisphere skies. The exploding star was located in the Large Magellanic Cloud — a satellite galaxy of the Milky Way – and Supernova 1987A was the brightest and nearest supernova explosion for modern astronomers to observe. This has provided an amazing opportunity to study the death of a star.

Telescopes around the world and in space have been keeping an eye on this event, and the latest images show the blast wave from the original explosion is still expanding, and it has plowed into a ring expelled by the pre-supernova star. The latest images and data reveal the blast is now moving past the ring.

Got a 3-D printer? You can print out your own version of SN1987A! Find the plans here.

Two different versions of 3-D printed models of SN1987A. Credit: Salvatore Orlando (INAF-Osservatorio Astronomico di Palermo) & NASA/CXC/SAO/A.Jubett et al.

Below is the latest image of this supernova, as seen by the Hubble Space Telescope. You can see it in the center of the image among a backdrop of stars, and the supernova is surrounded by gas clouds.

This new image of the supernova remnant SN 1987A was taken by the NASA/ESA Hubble Space Telescope in January 2017 using its Wide Field Camera 3 (WFC3). Credit: NASA, ESA, and R. Kirshner (Harvard-Smithsonian Center for Astrophysics and Gordon and Betty Moore Foundation) and P. Challis (Harvard-Smithsonian Center for Astrophysics)

Hubble launched in 1990, just three years after the supernova was detected, so Hubble has a long history of observations. In addition, the Chandra X-ray telescope – launched in 1999 – has been keeping an eye on the explosion too.

Here are a few animations and images of SN1987A over the years:

This scientific visualization, using data from a computer simulation, shows Supernova 1987A, as the luminous ring of material we see today.
Credits: NASA, ESA, and F. Summers and G. Bacon (STScI); Simulation Credit: S. Orlando (INAF-Osservatorio Astronomico di Palermo)
This montage shows the evolution of the supernova SN 1987A between 1994 and 2016, as seen by the NASA/ESA Hubble Space Telescope. Credit:
NASA, ESA, and R. Kirshner (Harvard-Smithsonian Center for Astrophysics and Gordon and Betty Moore Foundation) and P. Challis (Harvard-Smithsonian Center for Astrophysics)

Here’s a link to the original astronomer’s telegram announcing the detection.

Astronomers estimate that the ring material was was ejected about 20,000 years before the actual explosion took place. Then, the initial blast of light from the supernova illuminated the rings. They slowly faded over the first decade after the explosion, until the shock wave of the supernova slammed into the inner ring in 2001, heating the gas to searing temperatures and generating strong X-ray emission.

The observations by Hubble, Chandra and telescopes around the world has shed light on how supernovae can affect the dynamics and chemistry of their surrounding environment, and continue to shape galactic evolution.

See additional images and animations at the Chandra website, ESA’s Hubble website , and NASA.

Space Jellyfish Show Types Of Pulsar Wind Nebulas

Four-panel graphic showing the two pulsars, Geminga (upper left) and B0355+54 (upper right), observed by Chandra. Credit: NASA/JPL-Caltech/CXC/PSU/B.Posselt et al/N.Klingler et al/Nahks TrEhnl

Since they were first discovered in the late 1960s, pulsars have continued to fascinate astronomers. Even though thousands of these pulsing, spinning stars have been observed in the past five decades, there is much about them that continues to elude us. For instance, while some emit both radio and gamma ray pulses, others are restricted to either radio or gamma ray radiation.

However, thanks to a pair of studies from two international teams of astronomers, we may be getting closer to understanding why this is. Relying on data collected by the Chandra X-ray Observatory of two pulsars (Geminga and B0355+54), the teams was able to show how their emissions and the underlying structure of their nebulae (which resemble jellyfish) could be related.

These studies, “Deep Chandra Observations of the Pulsar Wind Nebula Created by PSR B0355+54” and “Geminga’s Puzzling Pulsar Wind Nebula” were published in The Astrophysical Journal. For both, the teams relied on x-ray data from the Chandra Observatory to examine the Geminga and B0355+54 pulsars and their associated pulsar wind nebulae (PWN).

An artist’s impression of an accreting X-ray millisecond pulsar. Credit: NASA/Goddard Space Flight Center/Dana Berry

Located 800 and 3400 light years from Earth (respectively), the Geminga and B0355+54 pulsars are quite similar. In addition to having similar rotational periods (5 times per second), they are also about the same age (~500 million years). However, Geminga emits only gamma-ray pulses while B0355+54 is one of the brightest known radio pulsars, but emits no observable gamma rays.

What’s more, their PWNs are structured quite differently. Based on composite images created using Chandra X-ray data and Spitzer infrared data, one resembles a jellyfish whose tendrils are relaxed while the other looks like a jellyfish that is closed and flexed. As Bettina Posselt – a senior research associate in the Department of Astronomy and Astrophysics at Penn State, and the lead author on the Geminga study – told Universe Today via email:

“The Chandra data resulted in two very different X-ray images of the pulsar wind nebulae around the pulsars Geminga and PSR B0355+54. While Geminga has a distinct three-tail structure, the image of PSR B0355+54 shows one broad tail with several substructures.”

In all likelihood, Geminga’s and B0355+54 tails are narrow jets emanating from the pulsar’s spin poles. These jets lie perpendicular to the donut-shaped disk (aka. a torus) that surrounds the pulsars equatorial regions. As Noel Klingler, a graduate student at the George Washington University and the author of the B0355+54 paper, told Universe Today via email:

“The interstellar medium (ISM) isn’t a perfect vacuum, so as both of these pulsars plow through space at hundreds of kilometers per second, the trace amount of gas in the ISM exerts pressure, thus pushing back/bending the pulsar wind nebulae behind the pulsars, as is shown in the images obtained by the Chandra X-ray Observatory.”

Their apparent structures appear to be due to their disposition relative to Earth. In Geminga’s case, the view of the torus is edge-on while the jets point out to the sides. In B0355+54’s case, the torus is seen face-on while the jets points both towards and away from Earth. From our vantage point, these jets look like they are on top of each other, which is what makes it look like it has a double tail. As Posselt describes it:

“Both structures can be explained with the same general model of pulsar wind nebulae. The reasons for the different images are (a) our viewing perspective, and (b) how fast and where to the pulsar is moving. In general, the observable structures of such pulsar wind nebulae can be described with an equatorial torus and polar jets. Torus and Jets can be affected (e.g., bent jets) by the “head wind” from the interstellar medium the pulsar is moving in. Depending on our viewing angle of the torus, jets and the movement of the pulsar, different pictures are detected by the Chandra X-ray observatory. Geminga is seen “from the side” (or edge-on with respect to the torus) with the jets roughly located in the plane of the sky  while for B0355+54 we look almost directly to one of the poles.”

This orientation could also help explain why the two pulsars appear to emit different types of electromagnetic radiation. Basically, the magnetic poles – which are close to their spin poles – are where a pulsar’s radio emissions are believed to come from. Meanwhile, gamma rays are believed to be emitted along a pulsar’s spin equator, where the torus is located.

“The images reveal that we see Geminga from edge-on (i.e., looking at its equator) because we see X-rays from particles launched into the two jets (which are initially aligned with the radio beams), which are pointed into the sky, and not at Earth,” said Klingler. “This explains why we only see Gamma-ray pulses from Geminga.  The images also indicate that we are looking at B0355+54 from a top-down perspective (i.e., above one of the poles, looking into the jets).  So as the pulsar rotates, the center of the radio beam sweeps across Earth, and we detect the pulses;  but the  gamma-rays are launched straight out from the pulsar’s equator, so we don’t see them from B0355.”

An all-sky view from the Fermi Gamma-ray Space Telescope, showing the position of Geminga in the Milky Way. Credit : NASA/DOE/International LAT Team.

“The geometrical constraints on each pulsar (where are the poles and the equator) from the pulsar wind nebulae help to explain findings regarding the radio and gamma-ray pulses of these two neutron stars,” said Posselt. “For example, Geminga appears radio-quiet (no strong radio pulses) because we don’t have a direct view to the poles and pulsed radio emission is thought to be generated in a region close to the poles. But Geminga shows strong gamma-ray pulsations, because these are not produced at the poles, but closer to the equatorial region.”

These observations were part of a larger campaign to study six pulsars that have been seen to emit gamma-rays. This campaign is being led by Roger Romani of Stanford University, with the collaboration of astronomers and researchers from GWU (Oleg Kargaltsev), Penn State University (George Pavlov), and Harvard University (Patrick Slane).

Not only are these studies shedding new light on the properties of pulsar wind nebulae, they also provide observational evidence to help astronomers create better theoretical models of pulsars. In addition, studies like these – which examine the geometry of pulsar magnetospheres – could allow astronomers to better estimate the total number of exploded stars in our galaxy.

By knowing the range of angles at which pulsars are detectable, they should be able to better estimate the amount that are not visible from Earth. Yet another way in which astronomers are working to find the celestial objects that could be lurking in humanity’s blind spots!

Further Reading: Chandra X-Ray Observatory

Chandra Spots Two Cosmic Heavy-Hitters at Once

Composite view of the collision between galaxy clusters Abell 3411 and Abell 3412 . Credit: X-ray: NASA/CXC/SAO/R. van Weeren et al./NAOJ/Subaru

This week, the 229th Meeting of the American Astronomical Society (AAS) kicked off in Grapevine, Texas. Between Monday and Friday (January 3rd to January 7th), attendees will be hearing presentations by researchers and scientists from several different fields as they share the latest discoveries in astronomy and Earth science.

One of the highlights so far this week was a presentation from NASA’s Chandra X-ray Observatory, which took place on the morning of Wednesday, January 5th. In the course of the presentation, an international research team showed some stunning images of two of the most powerful cosmic forces seen together for the first time – a supermassive black hole and two massive galaxy clusters colliding.

The galaxy clusters are known as Abell 3411 and Abell 3412, which are located about two billion light years from Earth. Both of these clusters are quite massive, each possessing the equivalent of about a quadrillion times the mass of our Sun. Needless to say, the collision of these objects produced quite the shockwave, which included the release of hot gas and energetic particles.

X-ray image of the collision between Abell 3411 and Abell 3412. Credit: NASA/CXC/SAO/R. van Weeren et al.

This was made all the more impressive thanks to the presence of a supermassive black hole (SMBH) at the center of one of the galaxy clusters. As the team described in their paper – titled “The Case for Electron Re-Acceleration at Galaxy Cluster Shocks” – the galactic collision produced a nebulous outburst of x-rays (shown above), which were produced when hot clouds of gas from one cluster plowed through the hot gas clouds of the other.

Meanwhile, the inflowing gas was accelerated outward into a jet-like stream, thanks to the powerful electromagnetic fields of the SMBH. These particles were accelerated even further when they got swept up by the shock waves produced by the collision of the galactic clusters and their massive gas clouds. These streams were detected thanks to the burst of radio waves they released as a result.

By seeing these two major events happening at the same time in the same place, the research team effectively witnessed a cosmic “double whammy”. As Felipe Andrade-Santos of the Harvard-Smithsonian Center for Astrophysics (CfA), and co-author of the paper, described it in a Chandra press release:

“It’s almost like launching a rocket into low-Earth orbit and then getting shot out of the Solar System by a second rocket blast. These particles are among the most energetic particles observed in the Universe, thanks to the double injection of energy.”

Image of radio waves produce by the collision between Abell 3411 and Abell 3412. Credit: NASA/CXC/SAO/R. van Weeren et al.

Relying on data obtained from the Chandra X-ray Observatory, the Giant Metrewave Radio Telescope (GMRT) in India, the Karl G. Jansky Very Large Array, the Keck Observatory, and Japan’s Subaru Telescope, the team was able to capture this event in the optical, x-ray, and radio wave wavelengths. This not only led to some stunning images, but shed some light on a long-standing mystery in galaxy research.

In the past, astronomers have detected radio emissions coming from Abell 3411 and Abell 3412 using the GMRT. But the origins of these emissions, which reached for millions of light years, was the subject of speculation and debate. Relying on the data they obtained, the research team was able to determine that they are the result of energetic particles (produced by the clouds of hot gas colliding) being further accelerated by galactic shock waves.

Or as co-author William Dawson, of the Lawrence Livermore National Lab in Livermore, California, put it:

“This result shows that a remarkable combination of powerful events generate these particle acceleration factories, which are the largest and most powerful in the Universe. It is a bit poetic that it took a combination of the world’s biggest observatories to understand this.”

Many interesting finds have been shared since the 229th Meeting of the AAS began – like the hunt for the source of a Fast Radio Burst – and many more are expected before it wraps up at the end of the week. These will include the latest results from the Sloan Digital Sky Survey (SDSS), and new and exciting research on black holes, exoplanets, and other astronomical phenomena.

And be sure to check out this podcast from Chandra as well, which talks about the collision between Abell 3411 and 3412 and the cosmic forces it unleashed.

Further Reading: Chandra X-ray Observatory

Are Supermassive Black Holes Hiding Matter?

Illustris simulation, showing the distribution of dark matter in 350 million by 300,000 light years. Galaxies are shown as high-density white dots (left) and as normal, baryonic matter (right). Credit: Markus Haider/Illustris

Mapping the Universe with satellites and ground-based observatories have not only provided scientists with a pretty good understanding of its structure, but also of its composition. And for some time now, they have been working with a model that states that the Universe consists of 4.9% “normal” matter (i.e. that which we can see), 26.8% “dark matter” (that which we can’t), and 68.3% “dark energy”.

From what they have observed, scientists have also concluded that the normal matter in the Universe is concentrated in web-like filaments, which make up about 20% of the Universe by volume. But a recent study performed by the Institute of Astro- and Particle Physics at the University of Innsbruck in Austria has found that a surprising amount of normal matter may live in the voids, and that black holes may have deposited it there.

In a paper submitted to the Royal Astronomical Society, Dr. Haider and his team described how they performed measurements of the mass and volume of the Universe’s filamentary structures to get a better idea of where the Universe’s mass is located. To do this, they used data from the Illustris project – a large computer simulation of the evolution and formation of galaxies.

Illustration of the Big Bang Theory
The Big Bang Theory: A history of the Universe starting from a singularity and expanding ever since. Credit: grandunificationtheory.com

As an ongoing research project run by an international collaboration of scientists (and using supercomputers from around the world), Illustris has created the most detailed simulations of our Universe to date. Beginning with conditions roughly 300,000 years after the Big Bang, these simulations track how gravity and the flow of matter changed the structure of the cosmos up to the present day, roughly 13.8 billion years later.

The process begins with the supercomputers simulating a cube of space in the universe, which measures some 350 million light years on each side. Both normal and dark matter are dealt with, particularly the gravitational effect that dark matter has on normal matter. Using this data, Haider and his team noticed something very interesting about the distribution of matter in the cosmos.

Essentially, they found that about 50% of the total mass of the Universe is compressed into a volume of 0.2%, consisting of the galaxies we see. A further 44% is located in the enveloping filaments, consisting of gas particles and dust. The remaining 6% is located in the empty spaces that fall between them (aka. the voids), which make up 80% of the Universe.

However, a surprising faction of this normal matter (20%) appears to have been transported there, apparently by the supermassive black holes located at the center of galaxies. The method for this delivery appears to be in how black holes convert some of the matter that regularly falls towards them into energy, which is then delivered to the sounding gas, leading to large outflows of matter.

This artist's concept illustrates a supermassive black hole with millions to billions times the mass of our sun. Supermassive black holes are enormously dense objects buried at the hearts of galaxies. Image credit: NASA/JPL-Caltech
Artist’s impression of a supermassive black holes at the hearts of a galaxy. Credit: NASA/JPL-Caltech

These outflows stretch for hundreds of thousands of lights years beyond the host galaxy, filling the void with invisible mass. As Dr. Haider explains, these conclusions supported by this data are rather startling. “This simulation,” he said, “one of the most sophisticated ever run, suggests that the black holes at the center of every galaxy are helping to send matter into the loneliest places in the universe. What we want to do now is refine our model, and confirm these initial findings.”

The findings are also significant because they just may offer an explanation to the so-called “missing baryon problem”. In short, this problem describes how there is an apparent discrepancy between our current cosmological models and the amount of normal matter we can see in the Universe. Even when dark matter and dark energy are factored in, half of the remaining 4.9% of the Universe’s normal matter still remains unaccounted for.

For decades, scientists have been working to find this “missing matter”, and several suggestions have been made as to where it might be hiding. For instance, in 2011, a team of students at the Monash School of Physics in Australia confirming that some of it was in the form of low-density, high energy matter that could only be observed in the x-ray wavelength.

In 2012, using data from the Chandra X-ray Observatory, a NASA research team reported that our galaxy, and the nearby Large and Small Magellanic Clouds, were surrounded by an enormous halo of hot gas that was invisible at normal wavelengths. These findings indicated that all galaxies may be surrounded by mass that, while not visible to the naked eye, is nevertheless detectable using current methods.

And just days ago, researchers from the Commonwealth Scientific and Industrial Research Organization (CSIRO) described how they had used fast radio bursts (FRBs) to measure the density of cosmic baryons in the intergalactic medium – which yielded results that seem to indicate that our current cosmological models are correct.

Factor in all the mass that is apparently being delivered to the void by supermassive black holes, and it could be that we finally have a complete inventory of all the normal matter of the Universe. This is certainly an exciting prospect, as it means that one of the greatest cosmological mysteries of our time could finally be solved.

Now if we could just account for the “abnormal” matter in the Universe, and all that dark energy, we’d be in business!

Further Reading: Royal Astronomical Society

Chandra Image May Rival July 4th Fireworks

A new composite of NGC 4258 features X-rays from Chandra (blue), radio waves from the VLA (purple), optical data from Hubble (yellow and blue), and infrared with Spitzer (red). Image Credit: Chandra

While Fourth of July festivities tonight may bring brilliant colors blazing across the night sky, only 23 million light-years away is another immense cosmic display, complete with a supermassive black hole, shock waves, and vast reservoirs of gas.

The night sky never ceases to amaze. And NGC 4258, also known as Messier 106, is a sight to be seen. A new image from NASA’s Chandra X-ray Observatory is shedding light on one of the galaxy’s most startling features: instead of two spiral arms, typical for any massive spiral galaxy, it appears to have four (imaged above in blue and purple).

Although the second pair of arms can be seen in visible light images as ghostly wisps of gas, they are prominent in images outside the visible spectrum, such as those using X-ray or radio waves. Unlike normal arms, they are made up of hot gas rather than stars, and their origin has remained a mystery.

Astronomers now think the arms — so-called anomalous for their atypical features — are indirectly caused by the supermassive black hole at NGC 4258’s heart.

Images from multiple telescopes help paint a complete picture. Radio data taken with the Very Large Array show that the supermassive black hole is producing powerful jets. As these jets travel through the galactic matter, they disrupt the surrounding gas and generate shock waves. These shock waves, seen by NASA’s Spitzer Space Telescope, heat the anomalous arms — composed of reservoirs of gas as massive as about 10 million Suns — to thousands of degrees.

Finally, the recent Chandra X-ray image also reveals huge bubbles of hot gas above and below the plane of the galaxy. These bubbles indicate that although much of the gas was originally in the disk of the galaxy, it was heated to such high temperatures that it was ejected into the outer regions by the jets from the supermassive black hole.

The results provide drastic implications for the fate of the galaxy. Most of the gas in the disk of the galaxy has been ejected, causing stars to form at a rate ten times slower than the Milky Way. Further, astronomers estimate that all of the remaining gas will be ejected within the next 300 million years.

Although NGC 4258 is currently a sight to be seen in any small telescope, like the best fireworks display followed by smoke, its death is inescapable.

The results were published in The Astrophysical Journal Letters and are available online.

Intriguing X-Ray Signal Might be Dark Matter Candidate

A mysterious X-ray signal in the Perseus galaxy cluster. Credit: NASA/CXC/SAO/E.Bulbul, et al.

Could a strange X-ray signal coming from the Perseus galaxy cluster be a hint of the elusive dark matter in our Universe?

Using archival data from the Chandra X-ray Observatory and the XMM-Newton mission, astronomers found an unidentified X-ray emission line, or a spike of intensity at a very specific wavelength of X-ray light. This spike was also found in 73 other galaxy clusters in XMM-Newton data.

The scientists propose that one intriguing possibility is that the X-rays are produced by the decay of sterile neutrinos, a hypothetical type of neutrino that has been proposed as a candidate for dark matter and is predicted to interact with normal matter only via gravity.

“We know that the dark matter explanation is a long shot, but the pay-off would be huge if we’re right,” said Esra Bulbul of the Harvard-Smithsonian Center for Astrophysics (CfA) in Cambridge, Massachusetts, who led the study. “So we’re going to keep testing this interpretation and see where it takes us.”

Astronomers estimate that roughly 85 percent of all matter in the Universe is dark matter, invisible to even the most powerful telescopes, but detectable by its gravitational pull.

Galaxy clusters are good places to look for dark matter. They contain hundreds of galaxies as well as a huge amount of hot gas filling the space between them. But measurements of the gravitational influence of galaxy clusters show that the galaxies and gas make up only about one-fifth of the total mass. The rest is thought to be dark matter.

Bulbul explained in a post on the Chandra blog that she wanted try hunting for dark matter by “stacking” (layering observations on top of each other) large numbers of observations of galaxy clusters to improve the sensitivity of the data coming from Chandra and XMM-Newton.

“The great advantage of stacking observations is not only an increased signal-to-noise ratio (that is, the amount of useful signal compared to background noise), but also the diminished effects of detector and background features,” wrote Bulbul. “The X-ray background emission and instrumental noise are the main obstacles in the analysis of faint objects, such as galaxy clusters.”

Her primary goal in using the stacking technique was to refine previous upper limits on the properties of dark matter particles and perhaps even find a weak emission line from previously undetected metals.

“These weak emission lines from metals originate from the known atomic transitions taking place in the hot atmospheres of galaxy clusters,” said Bulbul. “After spending a year reducing, carefully examining, and stacking the XMM-Newton X-ray observations of 73 galaxy clusters, I noticed an unexpected emission line at about 3.56 kiloelectron volts (keV), a specific energy in the X-ray range.”

In theory, a sterile neutrino decays into an active neutrino by emitting an X-ray photon in the keV range, which can be detectable through X-ray spectroscopy. Bulbul said that her team’s results are consistent with the theoretical expectations and the upper limits placed by previous X-ray searches.

Bulbul and her colleagues worked for a year to confirm the existence of the line in different subsamples, but they say they still have much work to do to confirm that they’ve actually detected sterile neutrinos.

“Our next step is to combine data from Chandra and JAXA’s Suzaku mission for a large number of galaxy clusters to see if we find the same X-ray signal,” said co-author Adam Foster, also of CfA. “There are lots of ideas out there about what these data could represent. We may not know for certain until Astro-H launches, with a new type of X-ray detector that will be able to measure the line with more precision than currently possible.”

Astro-H is another Japanese mission scheduled to launch in 2015 with a high-resolution instrument that should be able to see better detail in the spectra, and Bulbul said they hope to be able to “unambiguously distinguish an astrophysical line from a dark matter signal and tell us what this new X-ray emission truly is.”

Since the emission line is weak, this detection is pushing the capabilities Chandra and XMM Newton in terms of sensitivity. Also, the team says there may be explanations other than sterile neutrinos if this X-ray emission line is deemed to be real. There are ways that normal matter in the cluster could have produced the line, although the team’s analysis suggested that all of these would involve unlikely changes to our understanding of physical conditions in the galaxy cluster or the details of the atomic physics of extremely hot gases.

The authors also note that even if the sterile neutrino interpretation is correct, their detection does not necessarily imply that all of dark matter is composed of these particles.

The Chandra press release shared an interesting behind-the-scenes look into how science is shared and discussed among scientists:

Because of the tantalizing potential of these results, after submitting to The Astrophysical Journal the authors posted a copy of the paper to a publicly accessible database, arXiv. This forum allows scientists to examine a paper prior to its acceptance into a peer-reviewed journal. The paper ignited a flurry of activity, with 55 new papers having already cited this work, mostly involving theories discussing the emission line as possible evidence for dark matter. Some of the papers explore the sterile neutrino interpretation, but others suggest different types of candidate dark matter particles, such as the axion, may have been detected.

Only a week after Bulbul et al. placed their paper on the arXiv, a different group, led by Alexey Boyarsky of Leiden University in the Netherlands, placed a paper on the arXiv reporting evidence for an emission line at the same energy in XMM-Newton observations of the galaxy M31 and the outskirts of the Perseus cluster. This strengthens the evidence that the emission line is real and not an instrumental artifact.

Further reading:
Paper by Bulbul et al.
Chandra press release
ESA press release
Chandra blog

What Does a Supernova Sounds Like?

What Does a Supernova Sounds Like?

We’ve all been ruined by science fiction, with their sound effects in space. But if you could watch a supernova detonate from a safe distance away, what would you hear?

Grab your pedantry tinfoil helmet and say the following in your best “Comic Book Guy” voice: “Don’t be ridiculous. Space does not have sound effects. You would not hear the Death Star exploding. That is wrong.” There are no sounds in space. You know that. Why did you even click on this?

Wait! I still have thing I want to teach you. Keep that tinfoil on and stick around. First, a quick review. Why are there sounds? What are these things we detect with our ear shell-flaps which adorn the sides of our hat-resting orb?

Sounds are pressure waves moving through a medium, like air, water or beer. Talking, explosions, and music push air molecules into other molecules. Through all that “stuff” pushing other “stuff” it eventually pushes the “stuff” that we call our eardrum, and that lets us hear a thing. So, much like how there’s not enough “stuff” in space to take a temperature reading. There’s not enough “stuff” in space to be considered a medium for sound to move through.

Don’t get me wrong there’s “stuff” there. There’s particles. Even in intergalactic depths there are a few hundred particles every cubic meter, and there’s much more in a galaxy. They’re so far apart though, the particles don’t immediately collide with each other allowing a sound wave to pass through a grouping of them.

So, even if you did watch the Death Star explode, you couldn’t hear it. This includes zapping lasers, and exploding rockets. Unless two astronauts touched helmets together, then they could talk. The sound pressure moves through the air molecules in one helmet, through the glass transferring from one helmet to the other, and then pushes against the air inside the helmet of the listening astronaut. Then they could talk, or possibly hear one another scream, or just make muffled noises under the face-hugger that had been hiding in their boot.

There’s no sound in space, so you can’t hear what a supernova sounds like. But if you’re willing to consider swapping out your listening meats for other more impressive cybernetic components, there are possibilities. Perhaps I could offer you something in a plasma detection instrument, and you could hear the Sun.

Artist's concept of NASA's Voyager spacecraft. Image credit: NASA/JPL-Caltech
Artist’s concept of NASA’s Voyager spacecraft. Image credit: NASA/JPL-Caltech

Voyager 1 detects waves of particles streaming from the Sun’s solar wind. It was able to hear when it left the heliosphere, the region where the Sun’s solar wind buffets against the interstellar medium.

Or you could try something in the Marconi Auralnator 2000 which is the latest in radio detector implants I just made up. If there was such a thing, you could hear the plasma waves in Earth’s radiation belts. Which would be pretty amazing, but perhaps somewhat impractical for other lifestyle purposes such as watching Ellen.

So, if you wanted to hear a supernova you’d need a different kind of ear. In fact, something that’s not really an ear at all. There are some exceptions out there. With dense clouds of gas and dust at the heart of a galaxy cluster, you could have a proper medium. NASA’s Chandra X-Ray Observatory has detected sound waves moving through these dust clouds. But you would need ears millions of billions of times more sensitive to hear them.

NASA and other space agencies work tirelessly to convert radio, plasma and other activity into a sound pressure format that we can actually hear. There are beautiful things happening space. I’ve included a few links below which will take you to a few of these, and they are really quite incredible.

Earthsong

Lightning on Saturn, Helium in the atmosphere, etc.

Amazing New X-Ray Image of the Whirlpool Galaxy Shows it is Dotted with Black Holes

The Whirlpool galaxy seen in both optical and X-ray light. Image Credit: X-ray: NASA/CXC/Wesleyan Univ./R.Kilgard, et al; Optical: NASA/STScI

In any galaxy there are hundreds of X-ray binaries: systems consisting of a black hole capturing and heating material from a relatively low-mass orbiting companion star. But high-mass X-ray binaries — systems consisting of a black hole and an extremely high-mass companion star — are hard to come by. In the Milky Way there’s only one: Cygnus X-1. But 30 million light-years away in the Whirlpool galaxy, M51, there are a full 10 high-mass X-ray binaries.

Nearly a million seconds of observing time with NASA’s Chandra X-ray Observatory has revealed these specks. “This is the deepest, high-resolution exposure of the full disk of any spiral galaxy that’s ever been taken in the X-ray,” said Roy Kilgard, from Wesleyan University, at a talk presented at the American Astronomical Society meeting today in Boston. “It’s a remarkably rich data set.”

Within the image there are 450 X-ray points of light, 10 of which are likely X-ray binaries.

The Whilpool galaxy is thought to have so many X-ray binaries because it’s in the process of colliding with a smaller companion galaxy. This interaction triggers waves of star formation, creating new stars at a rate seven times faster than the Milky Way and supernova deaths at a rate 10-100 times faster. The more-massive stars simply race through their evolution in a few million years and collapse to form neutron stars or black holes quickly.

“In this image, there’s a very strong correlation between the fuzzy purple stuff, which is hot gas in the X-ray, and the fuzzy red stuff, which is hydrogen gas in the optical,” said Kilgard. “Both of these are tracing the star formation very actively. You can see it really enhanced in the northern arm that approaches the companion galaxy.”

Eight of the 10 X-ray binaries are located close to star forming regions.

Chandra is providing astronomers with an in depth look at a class of objects that has only one example in the Milky Way.

“We’re catching them at a short window in their evolutionary cycle,” said Kilgard. “The massive star that formed the black hole has died, and the massive star that is accreting material onto the black hole has not yet died. The window at which these objects are X-ray bright is really short. It’s maybe only tens of thousands of years.”

Additional information available on the Chandra website.