
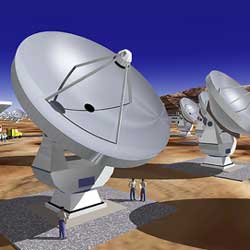
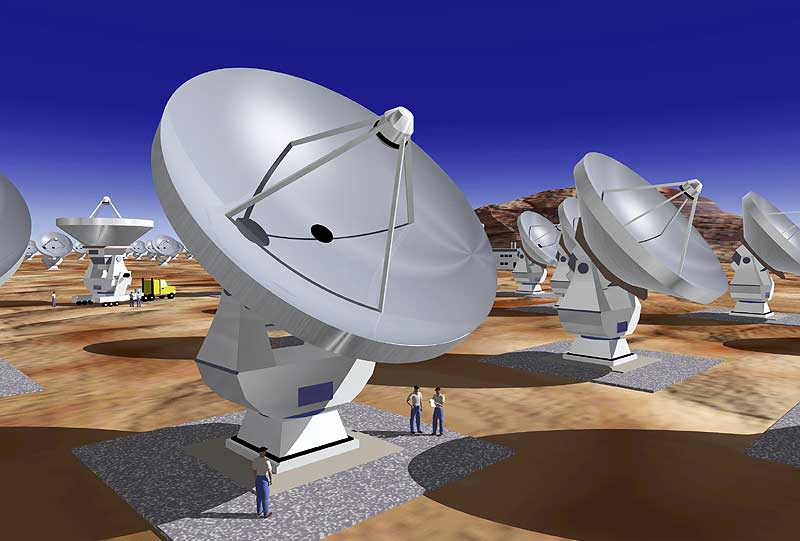
Artist illustration of the Atacama Large Millimeter Array currently under construction. Image credit: ESO. Click to enlarge.
Listen to the interview: Get Ready for Deep Impact (4.8 MB)
Or subscribe to the Podcast: universetoday.com/audio.xml
Fraser Cain: Can you give me some background on the submillimeter spectrum? Where does that fit?
Paul Ho: The submillimeter, formally, is at a wavelength of 1 millimeter and shorter. So 1 millimeter wavelength in frequency corresponds to about 300 gigahertz or 3×10^14 hertz. So, it is a very short wavelength. From that down to a wavelength of about 300 microns, or a third of a millimeter, is what we call the submillimeter range. It is sort of what we call the end of the atmospheric window as far as the radio is concerned, because shorter, about a third of a millimeter they sky becomes essentially opaque due to the atmosphere.
Fraser: So, these are radio waves, like what you’d listen to on the radio, but much shorter – nothing I could ever pick up on my FM radio. Why are they good for viewing the Universe where it’s cold?
Ho: Any object that we know of, or see, typically is radiating a spread of energy characterizing the materials that we’re talking about, so we call this a spectrum. And this energy spectrum typically has a peak wavelength – or the wavelength at which the bulk of the energy is radiated. That characteristic wavelength depends on the temperature of the object. So, the hotter the object, the shorter the wavelength comes out at, and the cooler the object, the longer the wavelength comes out at. For the Sun, which has a temperature of 7,000 degrees, you’d have a peak wavelength which comes out in the optical, which is of course why our eyes are tuned to the optical, because we live near the Sun. But as the material cools, the wavelength of that radiation gets longer and longer, and when you get down to a characteristic temperature of say 100 degrees above Absolute Zero, that peak wavelength comes out somewhare in the far infrared or submillimeter. So, a wavelength on the order of 100 microns, or a little bit longer than that, which puts it into the submillimeter range.
Fraser: And if I were able to swap out my eyes, and replace them with a set of submillimeter eyes, what would I be able to see if I looked up into the sky?
Ho: Of course, the sky would continue to be quite cool, but you’d begin to pick up a lot of things that are rather cold that you would not see in the optical world. Things like materials that are swirling around a star which are cool, on the order of 100 Kelvin; pockets of molecular gas where stars are forming – they would be colder than 100 K. Or in the very distant, early Universe when galaxies are first assembled, this material is also very cold, which you would not be able to see in the optical world, that you might be able to see in the submillimeter.
Fraser: What instruments are you using, either here or in space?
Ho: There are ground and space instruments. 20 years ago, people began to work in the submillimeter, and there were a few telescopes that were beginning to operate in this wavelength. In Hawaii, on Mauna Kea, there are two: one called the James Clerk Maxwell Telescope, which has a diameter of about 15 metres, and also the Caltech Submillimeter Observatory, which has a diameter of about 10 metres. We have built an interferometer, which is a series of telescopes which are coordinated to operate as a single instrument on top of Mauna Kea. So 8 6-metre class telescopes which are linked together and can be moved apart or moved closer together to a maximum baseline of, or separation, of half a kilometre. So this instrument is simulating a very large telescope, on the size of half a kilometre at its maximum, and therefore achieving a very high angle of resolution compared to existing single element telescopes.
Fraser: It’s much easier to combine the light from radio telescopes, so I guess that’s why you’re able to do that?
Ho: Well, the interferometer technique has been used in radio for quite some time now, so we have perfected this technique fairly well. Of course, in the infrared and optical, people are also beginning to work in this way, working on interferometers. Basically, combining the radiation, you have to keep track of the phase front of the radiation coming in. Normally I explain this as if you had a very large mirror and broke it so you just reserve a few pieces of the mirror, and then you want to reconstruct the information from those few pieces of mirror, there are a few things you need to do. First, you have to be able to keep the mirror pieces aligned, relative to each other, just like it was when it was one whole mirror. And second, to be able to correct for the defect, from the fact that there’s a lot of missing information with so many pieces of mirror that are not there, and you’re only sampling a few pieces. But this particular technique called aperture synthesis, which is to make a very large aperture telescope by using small pieces, of course, is the produce of Nobel prize winning work by Ryle and Hewish some years ago.
Fraser: What instruments are going to be developed in the future to take advantage of this wavelength?
Ho: After our telescopes are built and we’re working, there will be an even larger instrument that’s being constructed now in Chile called the Atacama Large Millimeter Array (ALMA), which will consist of many more telescopes and larger apertures, which will be much more sensitive than our pioneering instrument. But our instrument will hopefully begin to discovery the signs and the nature of the world in the submillimeter wavelength before the larger instruments come along to be able to follow along and do more sensitive work.
Fraser: How far will those new instruments be able to look? What could they be able to see?
Ho: One of the targets for our discipline of submillimeter astronomy is to look back in time at the earliest part of the Universe. As I mentioned earlier, in the early stage of the Universe, when it was forming galaxies, they tend to be much colder in the early phases when galaxies were being assembled, and it will radiate, we think, principly in the submillimeter. And you can see them, for example, using the JCM telescope on Mauna Kea. You can see some of the early Universe, which are very highly redshifted galaxies; these are not visible in the optical, but they are visible in the submillimeter, and this array will be able to image them, and locate them very actively as to where they are located in the sky so that we can study them further. These very early galaxies, these early formations, we think are at very high redshifts – we give this number Z, which is a redshift of 6, 7, 8 – very early in the formation of the Universe, so looking back to perhaps 10% of the time when the Universe was being assembled.
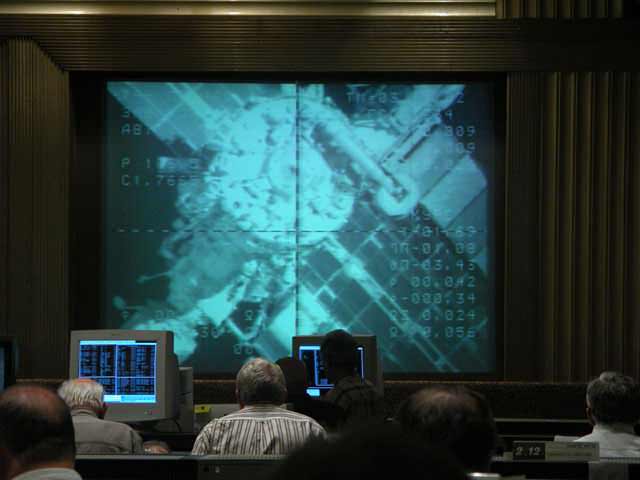
Fraser: My last question for you… Deep Impact is coming up in a few weeks. Will your observatories be watching this as well?
Ho: Oh yes, of course. The Deep Impact indeed is something we’re interested in. For our instrument, we have been studying Solar System type bodies, and this includes not only the planets, but also the comets as they come close or impact, we expect to see material to spew off, which we should be able to track in the submillimeter because we’ll be looking not only at the dust emissions, but we will be able to watch the spectral lines of the gasses which come out. So, we’re expecting to be able to turn our attention to this event, and to also be imaging it.
Paul Ho is an astronomer with the Harvard-Smithsonian Center for Astrophysics in Cambridge, Massachusetts.