What’s Up This Week – November 7 – November 13, 2005

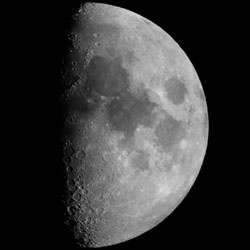
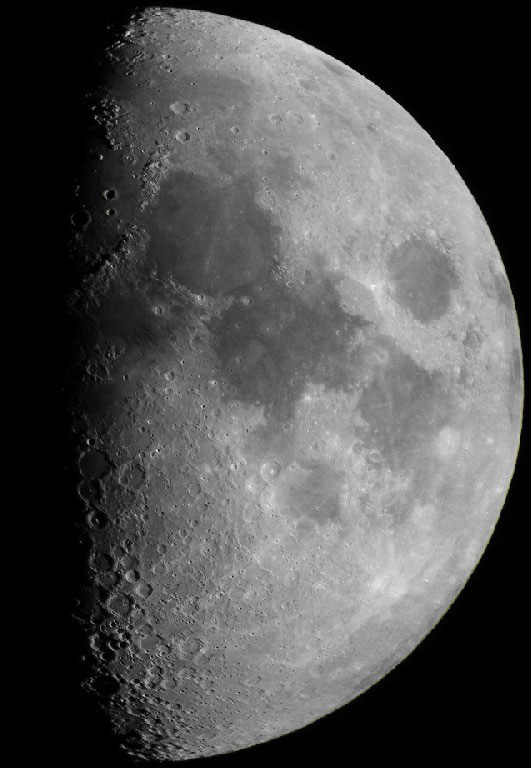
Our Moon. Image credit: Blackett Observatory. Click to enlarge.
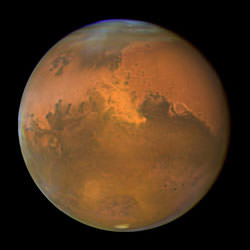
Monday, November 7 – Tonight Mars is at opposition, meaning that it rises just as Sol sets. Be sure to be outside at twilight to catch the awesome appearance of Venus to the west/southwest and Mars rivaling it in the east. You don’t want to miss this outstanding pair.

While the bright planets will try to steal the show, no place on the lunar surface can steal your heart like the Caucasus Mountains. Located tonight along the terminator in the north, stop and really take the time to appreciate their beauty. Like the earthly Caucasus which stretches 1500 kilometers between the Black and Caspian Seas, these stunning mountains extend 500 kilometers between the lunar “seas” of Mare Frigoris and Mare Serenitatis. While most of us could never climb to the 5642 meter summit of Mt. Eibrus, we can match that with our eyes as we power up to look at small crater Callipus caught in Caucasus’ midst. The highest peak is to its west and rises to a stunning 5303 meters above the desolate surface.

Climb the mountains. Their slopes, enclaves and plateaus were formed by the same volcanic process as those bordering Asia Minor. Look for Aristoteles and Eudoxus to the north-east, sitting like small countries along the borders. Where your imagination takes you is 384,000 kilometers away…

Tuesday, November 8 – Born on this day 1656, the great Edmund Halley made his mark on history as he became best known for determining the orbital period of the comet which bears his name. English scientist Halley, had many talents however, and in 1718 discovered what were referred to as “fixed stars”, actually displayed proper motion. If it were not for Halley, Sir Isaac Newton may never have published his now famous work on the laws of gravity and motion. Tonight let’s honor Halley by observing one of the all time greatest of double stars in motion – Almach.

Gamma Andromedae is the last in the chain of bright stars that extends from the northern-eastern corner of the “Square of Pegasus”. It may have been discovered to be a double as early as 1788, but F.W. Struve was the first to record its measurements in 1830. To even the smallest of telescopes, its golden primary is easily separated from the blue-green secondary, but for larger scopes – there’s something more.

In 1842, Struve discovered the companion star is itself a very close double of similar magnitude and spectral type. In 1982 they reached their maximum separation of .5, but it is possible to see them as companion stars thanks to their highly ellipitcal orbits. The brighter of the two is also a spectroscopic binary, making this a quadruple system. The light you see tonight from this beautifully colored pair left 3 years after Halley’s death.

Wednesday, November 9 – Be sure to take binoculars out just after sunset to catch Antares and Mercury within two degrees of each other. Both will be very low on the horizon, so don’t wait too long…

Tonight the Moon will be closest to Earth, so let’s get a good close look at striking trio of craters just south of central along the terminator. The smallest and youngest of the three is Arzachel at the southern end of the chain and far larger and older Ptolemy is to the north. Look closely at central crater Alphonsus, for it is the only crater to have photographic proof that changes do occur on the lunar surface. On October 26, 1956 a photo was taken showing a strange cloud just east of its central peak. Russian astronomer, Nikolai Kozyrev was fascinated and doggedly observed and photographed a changing Alphonsus until he had a huge success of the night of November 2, 1958. In taking a series of spectrograms (not an easy feat for those times and equipment), he successfully captured unmistakable evidence of a cloud of carbon molecule “outgassing”. Spaseba!

Today is the birthdate of Carl Sagan. Born in 1934 Sagan was an American planetologist, exobiologist, popularizer of science and astronomy, and novelist. His influential work and enthusiasm inspired us all. In his memory, tonight we’ll have a look at Melotte 25.

Most of you will recognize this expansive open cluster as the V-shaped group that forms the “head” of Taurus – more commonly referred to as the Hyades. Hundreds of mixed magnitude stars are contained inside this fist-sized cluster. The brightest true member is Theta 2, followed by its slightly dimmer counterpart – Theta 1. You’ll find this pair easily with binoculars just south of orange Aldeberan, which is merely a foreground star in this stellar play. At roughly 150 light years away, it’s the closest open cluster known after the Ursa Major group. At 400 million years old, it moves away from us and perhaps carries the spirit of Sagan with it… “We are all just star stuff.”

Thursday, November 10 – Tonight no crater on the Moon will call louder than the mighty Copernicus – so let’s answer.

With its thick walls and central peak, it is wonderfully picturesque, but what’s around the mound? To the north is two part crater – Gay-Lussac. Look for its stunning rimae cutting diagonally away to the southwest. To the south is an even smaller double crater – Fauth. If you want a true challenge, power up to the max. Look inside of Copernicus on the east wall for the very tiny strike of crater A!

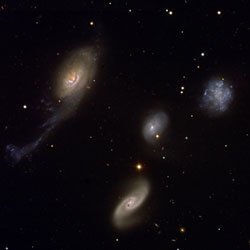
Friday, November 11 – A true observer was born on this day 1875. His name was Vesto Slipher, who spent some very quality time with the 60″ and 100″ telescopes on Mt. Wilson. Slipher was the first to photograph galaxy spectra and measure their redshifts, which led to the discovery of the expansion of the universe by Edwin Hubble.

Tonight let’s take a look at a galaxy as we head once again towards Andromeda and M31. Although the moonlight will prevent us from seeing great details, it is still quite amazing to know that we are able to see across 2.2 million light years. Containing over 300 billion stars, its one of the largest galaxies known. In 1912, Slipher analyzed it spectroscopically to discover its blue shift: “The magnitude of this velocity, which is the greatest hitherto observed, raises the question whether the velocity-like displacement might not be due to some other cause, but I believe we have at the moment we have no other interpretation for it. Hence we may conclude the Andromeda Nebula is approaching the solar system with a velocity of about 3000 kilometers per second.”

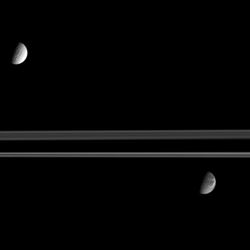
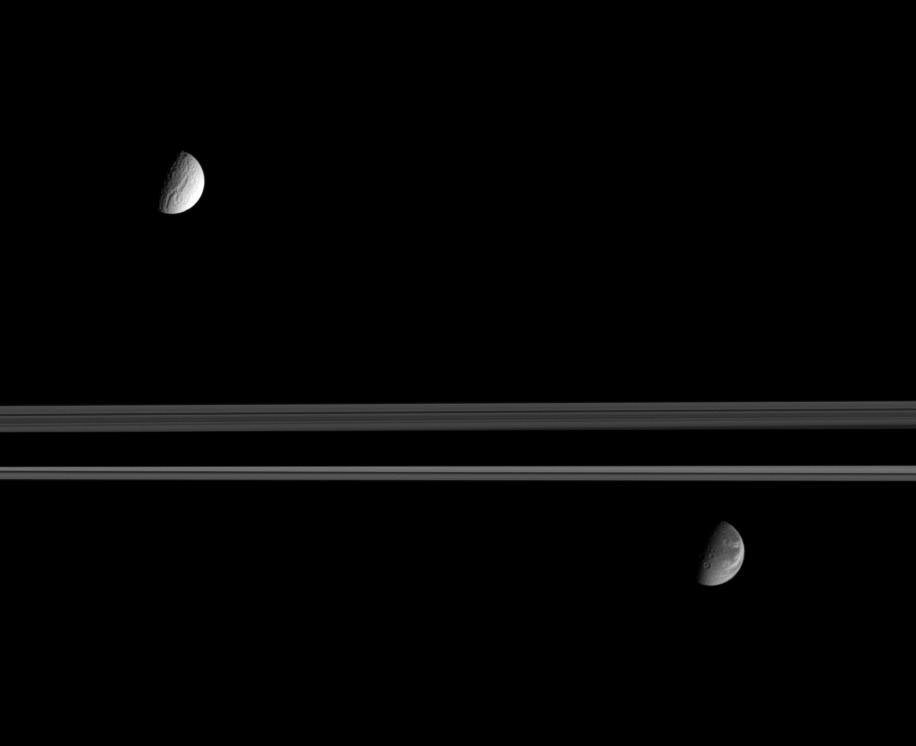
Saturday, November 12 – Wouldn’t we all have loved to have been there in 1949 when the first scientific observations were made with the Palomar 5-meter (200-inch) telescope? Or to have seen what Voyager 1 saw as it made its closest approach to Saturn on this date in 1980? Or even better, to have been around in 1833 – the night of the Great Leonid Meteor Shower! But this is here and now, so let’s make our own mark on the night sky as we view the Northern Taurid meteor shower.

Already making headlines around the world for producing extremely bright fireballs known as bolides, this particular stream belongs to debris left by periodic comet Encke. According to meteor experts Asher and Clube, 2005 could quite possibly be the year we pass through the “swarm” – a particularly rocky pocket of materials capable of producing these spectacular meteors. Although the Moon will greatly interfere with fainter members, a bolide can be spotted even through hazy cloud cover!

While you’re out, be sure to also keep watch for members of the Pegasid meteor shower, whose radiant is roughly near Square. This stream endures from mid-October until late November and used to be quite spectacular. Watch for the peak on November 17.

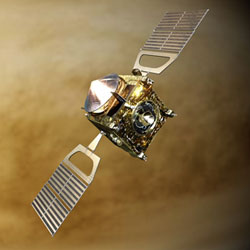
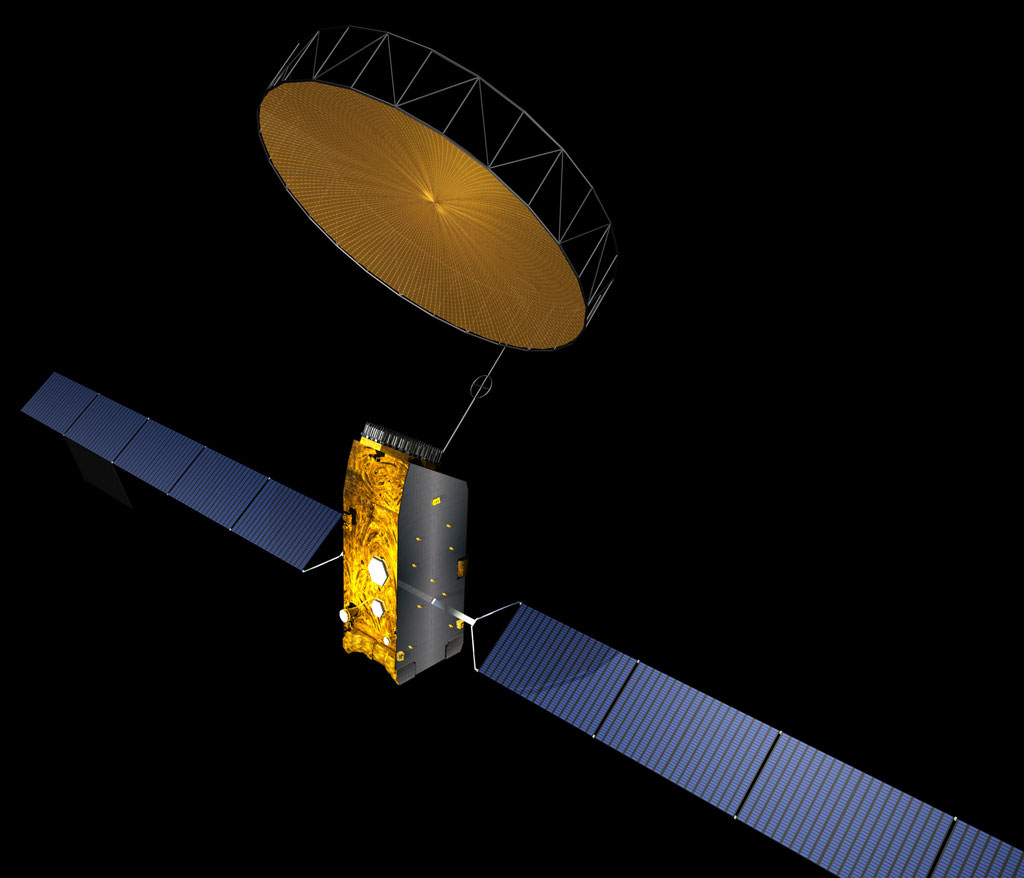
Sunday, November 13 – Today is the birthday of James Clerk Maxwell. Born in 1831, Maxwell was a leading English theoretician in electromagnetism and the nature of light. On this day in 1971, Mariner 9 becomes the first spaceprobe to orbit Mars.

Tonight let’s have a look at again at orbiting Mars. Depending on your observing time, perhaps you’ll catch the deep wedge of Syrtis Major punctuated by the Hellas Basin. For another, it might be the “moose antler” look of Mare Cimmerium or the red fields of Amazonis. Still others might catch the “fingers” of Mare Erythraeum reaching toward Chryse… No matter what time you look, it’s time well spent.

Until next week? May all your journeys be at light speed… ~Tammy Plotner

Book Review: On the Shores of the Unknown

Our universe has been around a long time, nearly 15 billion years. Before that, who knows? Maybe there were strings or branes in existence. During the pre-Big Bang, these might have flexed in unison and produced a singularity of infinite density. Highly speculative as this beginning is, the follow-on is much more understandable and verifiable. Theories elucidate happenings at about 10-43 seconds after the Big Bang or time zero. These, together with knowledge built up from peering deep into the smallness of matter, help build a picture of baryons coming into being, forces starting to push and pull, and protons and neutrons appearing and making the common matter which we are most familiar with today. From this description of the small, the universe went on to make the big – the stars, galaxies and clusters. As with anything else, the common denominator of the universe is perpetual change over time.

Trying to unravel this mystery of galactic evolution is, as Silk writes, as challenging as archaeologists piecing together life from eons ago. However, instead of deducing an environment from a few bone fragments, cosmologists must interpret emissions scattered about the electromagnetic spectrum. These emissions result from a variety of processes and give clues to the universe’s history. Thus, cosmologists will postulate various models and theories on causes and effects. Nevertheless, as Silk points out, proving any of these is next to impossible as we just can’t emulate a universe in a laboratory. What we can do to solve the mystery is to piece together clues found through experimentation and observation.

Given this vague data set, anyone would be right in assuming that one cosmological theory is as good as another. Silk, however, mostly chooses one route for his history and only occasionally considers alternative theories. His route starts with the Big Bang, is followed by a very short, rapid inflationary period that then morphs into the slower inflationary period of today’s universe.

The strength of Silk’s book is that he continually makes links between theories and experiments. Visual observations, neutrino observatories and detectors in particle accelerators all bring facts into the theories. For example, the concentration of heavy metals differs amongst stars. Yet the concentration of heavy metals is directly associated with age, hence, we can estimate a star’s age and thus the age of the surrounding galaxy. Further, by looking at various red shifts, we can estimate rotational velocity and this, together with a bit more finesse, will determine the velocity with respect to the centre of the universe. Or, there is the Wilkinson Microwave Anisotropy Probe that measures the background temperature fluctuations to implicitly define the distribution of matter today. Silk even provides links into future tests, such as the Laser Interferometer Space Antenna scheduled to detect ancient gravity waves after launch in 2012. By clearly identifying the role of various future and recent experiments, Silk enables the reader to readily come to grips with our understanding of the cosmos today and our targets for more knowledge tomorrow.

Silk ably portrays highly technical knowledge in fine writing. Sometimes his book reads like a compressed graduate text with little pause for clarification or repetition. He has a somewhat higher than average expectation of prior knowledge. There are no equations, nor questions at the end of a chapter, but they might well have been there in an earlier draft. As such, the reader should be comfortable with the more esoteric concepts of cosmology in order to get the most from this short history of the universe. Mind you, with the many graphs and diagrams, the reader does have plenty aids in grasping the concept. Further, a number of colour plates dramatically demonstrate the processes being discussed.

If you want to know why we do certain astronomy experiments or why we believe in certain cosmological principles, Joseph Silk’s book On the Shores of the Unknown is just what you need. From the creation of matter to the formation of galactic clusters, he provides a clear, soundly reasoned exposition of how a point of infinite density could have made us into what we are today. With this, we can certainly consider making big plans for tomorrow.

Review by Mark Mortimer

Read more reviews online, or purchase a copy from Amazon.com.

Massive B-15A Iceberg Breaks Up

B-15A Iceberg breaking up. Image credit: ESA. Click to enlarge.
After five years of being the world’s largest free-floating object, the B-15A iceberg has broken into smaller pieces off Antarctica’s Cape Adare.

ESA’s Envisat satellite’s Advanced Synthetic Aperture Radar (ASAR) is sensitive to ice, and has been tracking the movement of the drifting ice object continuously since the beginning of this year. Its latest imagery reveals the bottle-shaped iceberg split into nine knife-shaped icebergs and a myriad of smaller pieces on 27-28 October, the largest being formed by fractures along the long axis of the original single iceberg.

Measuring – until last week – around 115 kilometres in length with an area exceeding 2500 square kilometres, the B-15A tabular iceberg had apparently run aground off Cape Adare, the northernmost corner of the Victoria Land Coast. This stranding appears to have led to flexing and straining which resulted in the break-up.

“The long knife-shaped pieces suggest the iceberg has split along existing lines of weakness within the iceberg,” says Mark Drinkwater of ESA’s Ocean and Ice Unit. “These would have been pre-existing fractures and crevasses in the ice shelf.”

These new icebergs, named by the US National Oceanic and Atmospheric Administration (NOAA) National Ice Center, will retain their parent’s title: the three largest island-sized pieces have been called B-15M, B-15N and B-15P.

B-15A was the largest remaining section of the even larger B-15 iceberg that calved from the nearby Ross Ice Shelf in March 2000 before breaking up into smaller sections off McMurdo Island.

Since then its B-15A section drifted into McMurdo Sound, where its presence blocked ocean currents and led to a build-up of sea ice that decimated local penguin colonies, deprived of open waters for feeding. During the spring of this year prevailing currents took B-15A slowly past the Drygalski ice tongue. A full-fledged collision failed to take place, but a glancing blow broke the end off Drygalski in mid-April.

The iceberg sailed on to have a less-destructive close encounter with the Aviator Glacier ice tongue at Lady Newnes Bay before becoming stranded off Cape Adare in mid-October.

Radar monitoring of Antarctic ice
ASAR is extremely useful for tracking changes in polar ice. ASAR can peer through the thickest polar clouds and work through local day and night. And because it measures surface texture, the instrument is also extremely sensitive to different types of ice – so the radar image clearly delineates the older, rougher surface of icebergs from surrounding sea ice, while optical sensors simply show a continuity of snow-covered ice.

Envisat’s ASAR instrument monitors Antarctica in two different modes: Global Monitoring Mode (GMM) provides 400-kilometre swath one-kilometre resolution images, enabling rapid mosaicking of the whole of Antarctica to monitor changes in sea ice extent, ice shelves and iceberg movement.

Wide Swath Mode (WSM) possesses the same swath but with 150-metre resolution for a detailed view of areas of particular interest.

ASAR GMM images are routinely provided to a variety of users including the National Ice Center, responsible for tracking icebergs worldwide.

Original Source: ESA News Release

Landmarks on Titan

Cassini image of Titan with place names. Image credit: NASA/JPL/SSI. Click to enlarge.
Like an ancient mariner charting the coastline of an unexplored wilderness, Cassini’s repeated encounters with Titan are turning a mysterious world into a more familiar place.

During a Titan flyby on Oct. 28, 2005, the spacecraft’s narrow-angle camera acquired multiple images that were combined to create the mosaic presented here. Provisional names applied to Titan’s features are shown; an unannotated version of the mosaic is also available.

The mosaic is a high resolution close-up of two contrasting regions: dark Shangri-La and bright Xanadu. This view has a resolution of 1 kilometer (0.6 mile) per pixel and is centered at 2.5 degrees north latitude, 145 degrees west longitude, near the feature called Santorini Facula. The mosaic is composed of 10 images obtained on Oct. 28, 2005, each processed to enhance surface detail. It is an orthographic projection, rotated so that north on Titan is up.

The Cassini-Huygens mission is a cooperative project of NASA, the European Space Agency and the Italian Space Agency. The Jet Propulsion Laboratory, a division of the California Institute of Technology in Pasadena, manages the mission for NASA’s Science Mission Directorate, Washington, D.C. The Cassini orbiter and its two onboard cameras were designed, developed and assembled at JPL. The imaging operations center is based at the Space Science Institute in Boulder, Colo.

For more information about the Cassini-Huygens mission visit http://saturn.jpl.nasa.gov. The Cassini imaging team homepage is at http://ciclops.org.

Original Source: NASA/JPL/SSI News Release

Inmarsat Launch Delayed

Artist illustration of Inmarsat 4. Image credit: Inmarsat. Click to enlarge.
The launch Inmarsat-4 F2, one of the largest and most powerful communications satellites ever built has been reschedule for Tuesday 8 November.

The six-tonne UK-built craft is due to be lofted by a Zenit-3SL rocket from a floating platform in the Pacific Ocean. It should have flown on Saturday but a software glitch led to an automated halt in the countdown sequence. Flight controllers say they are now happy to go for a Tuesday launch after investigating the technical problem.

Lift-off is now scheduled at the opening of a 29-minute window at 1407 GMT. Inmarsat-4 F2 is the second of three satellites designed to improve global communications systems.

The first satellite, which covers most of Europe, Africa, the Middle East, Asia and the Indian Ocean, was launched from Cape Canaveral in March. The second will improve and extend communications across South America, most of North America, the Atlantic Ocean and part of the Pacific Ocean.

The two satellites will support the London-based sat-com Inmarsat company’s global broadband network, BGan.

Their onboard technology is designed to allow people to set up virtual offices anywhere around the world via high-speed broadband connections and new 3G phone technology. The spacecraft, each the size of a London bus, should continue functioning for about 15 years. They were built largely at the EADS-Astrium facilities in Stevenage and Portsmouth, UK.

The Inmarsat-4 F2 is going up from waters close to Kiritimati (Christmas Island) on the equator.

It is using the innovative Sea Launch system, which employs a converted oil drilling platform as a launch pad. It is towed into position from its California base.

Original Source: BNSC News Release

ESO Image of Robert’s Quartet

Robert’s Quartet. Image credit: ESO. Click to enlarge.
ESO PR Photo 34a/05 shows in amazing details a group of galaxies known as Robert’s Quartet [1]. The image is based on data collected with the FORS2 multi-mode instrument on ESO’s Very Large Telescope.

Robert’s Quartet is a family of four very different galaxies, located at a distance of about 160 million light-years, close to the centre of the southern constellation of the Phoenix. Its members are NGC 87, NGC 88, NGC 89 and NGC 92, discovered by John Herschel in the 1830s. NGC 87 (upper right) is an irregular galaxy similar to the satellites of our Milky Way, the Magellanic Clouds. NGC 88 (centre) is a spiral galaxy with an external diffuse envelope, most probably composed of gas. NGC 89 (lower middle) is another spiral galaxy with two large spiral arms. The largest member of the system, NGC 92 (left), is a spiral Sa galaxy with an unusual appearance. One of its arms, about 100,000 light-years long, has been distorted by interactions and contains a large quantity of dust.

The quartet is one of the finest examples of compact groups of galaxies. Because such groups contain four to eight galaxies in a very small region, they are excellent laboratories for the study of galaxy interactions and their effects, in particular on the formation of stars.

Using another set of VLT data also obtained with FORS2, astronomers [2] were able to study the properties of regions of active star formation (“HII regions” [3]) in the sister members of Robert’s Quartet. They found more than 200 of such regions in NGC 92, with a size between 500 and 1,500 light-years. For NGC 87, they detected 56 HII regions, while the two other galaxies appear to have far fewer of them. For NGC 88, however, they found two plume-like features, while NGC 89 presents a ring of enhanced stellar activity. The system is thus clearly showing increased star formation activity, most probably as the result of the interaction between its members. The sisters clearly belong to a perturbed family.

The quartet has a total visual magnitude of almost 13, i.e. it is about 600 times fainter than the faintest object that can be seen with the unaided eye. The brightest member of the group has a magnitude of about 14. On the sky, the four galaxies are all within a circle of radius of 1.6 arcmin, corresponding to about 75,000 light-years.

Notes
[1]: The group of galaxies was known as a Compact Group since 1977 by J.A. Rose, under the designation Rose 34. Robert’s Quartet is also known under the less poetic name of AM 0018-485 from the Catalogue of Southern Peculiar Galaxies and Associations, compiled in 1987 by astronomers Halton “Chip” Arp and Barry Madore. But who is Robert then? As discovered by Australian amateur astronomer Mike Kerr, Arp and Madore named Robert’s Quartet after Robert Freedman who generated many of the updated positions of galaxies in the catalogue. The astronomers clearly had a very good sense of humour as the catalogue also contains a system of galaxies called Wendy (ESO 147- 8; for Wendy Freedman) and another called the Conjugal galaxy (ESO 384- 53)!

[2]: The astronomers are S. Temporin (University of Innsbruck, Austria), S. Ciroi and P. Rafanelli (University of Padova, Italy), A. Iovino (INAF-Brera Astronomical Observatory, Italy), E. Pompei (ESO), and M. Radovich (INAF-Capodimonte Astronomical Observatory, Italy). (The article describing this result is available in PDF format at http://www.ast.cam.ac.uk/%7Esb2004/posters/files/Temporin.pdf)

[3]: The radiation of young hot stars embedded in an interstellar cloud is able to heat the surrounding gas, resulting in the apparition of an emission nebula that shines mostly in the light of ionized hydrogen (H) atoms. Such nebulae are therefore often referred to as “HII regions”. The well-known Orion Nebula is an outstanding example of that type of nebula.

Original Source: ESO News Release

Venus Mission Will Reveal Some Surprises

Artist illustration of Venus Express. Image credit: ESA. Click to enlarge.
University of Colorado at Boulder planetary scientist Larry Esposito, a member of the European Space Agency’s Venus Express science team, believes the upcoming mission to Earth’s “evil twin” planet should be full of surprises.

While its 875-degree F. surface is hot enough to make rocks glow and its atmosphere is filled with noxious carbon dioxide gases and acid rain, Venus actually is more Earth-like than Mars, said Esposito, a professor in CU-Boulder’s Laboratory for Atmospheric and Space Physics. A member of the Venus Monitoring Camera team for the $260 million now slated for launch from the Baikonur Cosmodrome in Kazakhstan on Nov. 9, Esposito said Venus is a “neglected planet” that undoubtedly harbors a number of astounding discoveries.

One question revolves around what is known as an “unknown ultraviolet absorber” high in the planet’s clouds that blocks sunlight from reaching the surface. “Some scientists believe there is the potential, at least, that life could be found in the clouds of Venus,” said Esposito. “There has been speculation that sunlight absorbed by the clouds might be involved in some kind of biological activity.”

Esposito is particularly eager to see if volcanoes on Venus are still active. In 1983 he used data from a CU-Boulder instrument that flew on NASA’s Pioneer Venus spacecraft to uncover evidence that a massive volcanic eruption there poured huge amounts of sulfur dioxide into the upper atmosphere. The eruption, which likely occurred in the late 1970s, appears to have been at least 10 times more powerful than any that have occurred on Earth in more than a century, he said.

“The spacecraft will be looking for ‘hotspots’ through the clouds in an attempt to make a positive detection of volcanoes,” said Esposito, who made the first observations of Venus with the Hubble Space Telescope in 1995. “While the Magellan mission that mapped Venus in the 1990s was not able to find evidence of volcanic activity, it did not close out the question. This will give us another shot.”

Since Venus and Earth were virtual twins at birth, scientists are puzzled how planets so similar in size, mass and composition could have evolved such different physical and chemical processes, he said. “The results from missions like this have major implications for our understanding of terrestrial planets as a whole, and for comparable processes occurring on Earth and Mars,” said Esposito.

Esposito has been involved in a number of planetary exploration missions at CU-Boulder. He currently is science team leader for the UltraViolet Imaging Spectrograph, a $12.5 million CU-Boulder instrument on the Cassini spacecraft now exploring the rings and moons of Saturn.

He also was an investigator for a CU-Boulder instrument that visited Jupiter and its moons in the 1990s aboard NASA’s Galileo spacecraft, and was an investigator for NASA’s Voyager 2 spacecraft that toted a CU-Boulder instrument on a tour of the solar system’s planets in the 1970s and 1980s.

Esposito was a science team member on two failed Russian missions to Mars — the 1988 Phobos mission that exploded in space and the Mars 96 mission that crashed in Earth’s ocean. Five of the science instruments on Venus Express are “spares” from the Mars Express and Rosetta comet mission, according to ESA.

In addition to the camera, the Venus Express spacecraft also is carrying two imaging spectrometers, a spectrometer to measure atmospheric constituents, a radio science experiment and a space plasma and atom-detecting instrument. The spacecraft is expected to arrive at Venus in April 2006 and orbit the planet for about 16 months.

The Venus Express mission originally was scheduled to launch Oct. 26, but a thermal-insulation problem discovered in the upper-stage booster rocket caused a two-week delay. The launch window closes on Nov. 24.

Original Source: UC Boulder News Release

Greenland’s Ice Sheet is Growing

Map of Greenland with temperature changes. Image credit: ESA. Click to enlarge.
Researchers have utilised more than a decade’s worth of data from radar altimeters on ESA’s ERS satellites to produce the most detailed picture yet of thickness changes in the Greenland Ice Sheet.

A Norwegian-led team used the ERS data to measure elevation changes in the Greenland Ice Sheet from 1992 to 2003, finding recent growth in the interior sections estimated at around six centimetres per year during the study period. The research is due to be published by Science Magazine in November, having been published in the online Science Express on 20 October.

ERS radar altimeters work by sending 1800 separate radar pulses down to Earth per second then recording how long their echoes take to bounce back 800 kilometres to the satellite platform. The sensor times its pulses’ journey down to under a nanosecond to calculate the distance to the planet below to a maximum accuracy of two centimetres.

ESA has had at least one working radar altimeter in polar orbit since July 1991, when ERS-1 was launched. ESA’s first Earth Observation spacecraft was joined by ERS-2 in April 1995, then the ten-instrument Envisat satellite in March 2002.

The result is a scientifically valuable long-term dataset covering Earth’s oceans and land as well as ice fields – which can be used to reduce uncertainty about whether land ice sheets are growing or shrinking as concern grows about the effects of global warming.

The ice sheet covering Earth’s largest island of Greenland has an area of 1 833 900 square kilometres and an average thickness of 2.3 kilometres. It is the second largest concentration of frozen freshwater on Earth and if it were to melt completely global sea level would increase by up to seven metres.

The influx of freshwater into the North Atlantic from any increase in melting from the Greenland Ice Sheet could also weaken the Gulf Stream, potentially seriously impacting the climate of northern Europe and the wider world.

Efforts to measure changes in the Greenland Ice Sheet using field observations, aircraft and satellites have improved scientific knowledge during the last decade, but there is still no consensus assessment of the ice sheet’s overall mass balance. There is however evidence of melting and thinning in the coastal marginal areas in recent years, as well as indications that large Greenland outlet glaciers can surge, possibly in response to climate variations.

Much less known are changes occurring in the vast elevated interior area of the ice sheet. Therefore an international team of scientists – from Norway’s Nansen Environmental and Remote Sensing Center (NERSC), Mohn-Sverdrup Center for Global Ocean Studies and Operational Oceanography and the Bjerknes Centre for Climate Research, Russia’s Nansen International Environmental and Remote Sensing Center and the United States’ Environmental Systems Analysis Research Center – were compelled to derive and analyse the longest continuous dataset of satellite altimeter observations of Greenland Ice Sheet elevations.

By combining tens of millions of data points from ERS-1 and ERS-2, the team determined spatial patterns of surface elevation variations and changes over an 11-year period.

The result is a mixed picture, with a net increase of 6.4 centimetres per year in the interior area above 1500 metres elevation. Below that altitude, the elevation-change rate is minus 2.0 cm per year, broadly matching reported thinning in the ice-sheet margins. The trend below 1500 metres however does not include the steeply-sloping marginal areas where current altimeter data are unusable.

The spatially averaged increase is 5.4 cm per year over the study area, when corrected for post-Ice Age uplift of the bedrock beneath the ice sheet. These results are remarkable because they are in contrast to previous scientific findings of balance in Greenland’s high-elevation ice.

The team, led by Professor Ola M. Johannessen of NERSC, ascribe this interior growth of the Greenland Ice Sheet to increased snowfall linked to variability in regional atmospheric circulation known as the North Atlantic Oscillation (NAO). First discovered in the 1920s, the NAO acts in a similar way to the El Niño phenomenon in the Pacific, contributing to climate fluctuations across the North Atlantic and Europe.

Comparing their data to an index of the NAO, the researchers established a direct relationship between Greenland Ice Sheet elevation change and strong positive and negative phases of the NAO during winter, which largely control temperature and precipitation patterns over Greenland.

Professor Johannessen commented: “This strong negative correlation between winter elevation changes and the NAO index, suggests an underappreciated role of the winter season and the NAO for elevation changes – a wildcard in Greenland Ice Sheet mass balance scenarios under global warming.”

He cautioned that the recent growth found by the radar altimetry survey does not necessarily reflect a long-term or future trend. With natural variability in the high-latitude climate cycle that includes the NAO being very large, even an 11-year long dataset remains short.

“There is clearly a need for continued monitoring using new satellite altimeters and other observations, together with numerical models to calculate the Greenland Ice Sheet mass budget,” Johannessen added.

Modelling studies of the Greenland Ice Sheet mass balance under greenhouse global warming have shown that temperature increases up to about 3ºC lead to positive mass balance changes at high elevations – due to snow accumulation – and negative at low elevations – due to snow melt exceeding accumulation.

Such models agree with the new observational results. However after that threshold is reached, potentially within the next hundred years, losses from melting would exceed accumulation from increases in snowfall – then the meltdown of the Greenland Ice Sheet would be on.

A paper published in Science in June this year detailed the results of a similar analysis of the Antarctic Ice Sheet based on ERS radar altimeter data, carried out by a team led by Professor Curt Davis of the University of Missouri-Columbia.

The results showed thickening in East Antarctica on the order of 1.8 cm per year, but thinning across a substantial part of West Antarctica. Data were unavailable for much of the Antarctic Peninsula, subject to recent ice sheet thinning due to regional climate warming, again because of limitations in current radar altimeter performance.

ESA’s CryoSat mission, lost during launch on 8 October, carried the world’s first radar altimeter purpose-built for use over both land and sea ice. In the context of land ice sheets, CryoSat would have been capable of acquiring data over steeply-sloping ice margins which remain invisible to current radar altimeters – these being the very regions where the greatest loss is taking place.

Efforts are currently underway to investigate the possibility of building and flying a CryoSat-2, with a decision to be taken by the end of the year. In the meantime, the valuable climatological record of ice sheet change established by ERS and Envisat will continue to be extended.

Original Source: ESA News Release

Two of Saturn’s Moons Split By the Rings

Tethys and Dione. Image credit: NASA/JPL/SSI. Click to enlarge.
Saturn’s expansive rings separate the moon’s Tethys (at the top) from Dione (at the bottom). Even in this distant view, it is easy to see that the moons’ surfaces, and likely their evolutionary histories, are very different.

Both moons are on the far side of the rings in this scene, which shows their Saturn-facing hemispheres (terrain centered on 0 degrees longitude). The dark shadow across the rings is cast by Saturn’s southern hemisphere.

The diameter of Tethys is 1,071 kilometers (665 miles) and the diameter of Dione is 1,126 kilometers (700 miles).

This image was taken in visible light with the Cassini spacecraft narrow-angle camera on Sept. 12, 2005, at a distance of approximately 2.4 million kilometers (1.5 million miles) from Saturn. The image scale is about 17 kilometers (11 miles) per pixel on the two moons.

The Cassini-Huygens mission is a cooperative project of NASA, the European Space Agency and the Italian Space Agency. The Jet Propulsion Laboratory, a division of the California Institute of Technology in Pasadena, manages the mission for NASA’s Science Mission Directorate, Washington, D.C. The Cassini orbiter and its two onboard cameras were designed, developed and assembled at JPL. The imaging operations center is based at the Space Science Institute in Boulder, Colo.

For more information about the Cassini-Huygens mission visit http://saturn.jpl.nasa.gov. The Cassini imaging team homepage is at http://ciclops.org.

Original Source: NASA/JPL/SSI News Release

Hubble Sees a Dust Storm on Mars

Mars photographed by Hubble. Image credit: Hubble. Click to enlarge.
NASA’s Hubble Space Telescope snapped this picture of Mars on October 28, within a day of its closest approach to Earth on the night of October 29. Hubble astronomers were also excited to have captured a regional dust storm on Mars that has been growing and evolving over the past few weeks.

The dust storm, which is nearly in the middle of the planet in this Hubble view is about 930 miles (1500 km) long measured diagonally, which is about the size of the states of Texas, Oklahoma, and New Mexico combined. No wonder amateur astronomers with even modest-sized telescopes have been able to keep an eye on this storm. The smallest resolvable features in the image (small craters and wind streaks) are the size of a large city, about 12 miles (20 km) across. The occurrence of the dust storm is in close proximity to the NASA Mars Exploration Rover Opportunity’s landing site in Sinus Meridiani. Dust in the atmosphere could block some of the sunlight needed to keep the rover operating at full power.

On October 29/30, Mars and Earth reached the point in their orbits where the two planets were the closest they have been since August of 2003. The red planet, named after the Roman god of war, won’t be this close again to Earth until 2018. At the 2005 closest approach Mars was at a distance of 43 million miles (69 million km), comparatively a stone’s throw across the solar system. Mars goes through a 26-month cycle where its distance from Earth changes. At times when the distance is smallest between the two planets, Mars appears brighter in the sky and larger through telescopes for Earth viewers.

This image of 2005 Mars closest approach was taken with Hubble’s Advanced Camera for Surveys. Different filters show blue, green, and red (250, 502 and 658 nanometer wavelengths). North is at the top of the image. Mars is now in its warmest months, closest to the Sun in its orbit, resulting in a smaller than normal south polar ice cap which has largely sublimated with the approaching summer.

The large regional dust storm appears as the brighter, redder cloudy region in the middle of the planet’s disk. This storm has been churning in the planet’s equatorial regions for several weeks now, and it is likely responsible for the reddish, dusty haze and other dust clouds seen across this hemisphere of the planet in views from Hubble, ground based telescopes, and the NASA and ESA spacecraft studying Mars from orbit. Bluish water-ice clouds can also be seen along the limbs and in the north (winter) polar region at the top of the image.

Original Source: Hubble News Release