Gravity Probe B Will Tell Us If Einstein Was Right

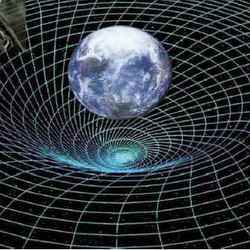
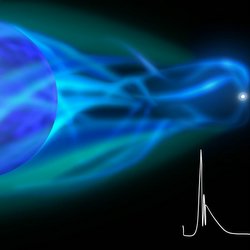
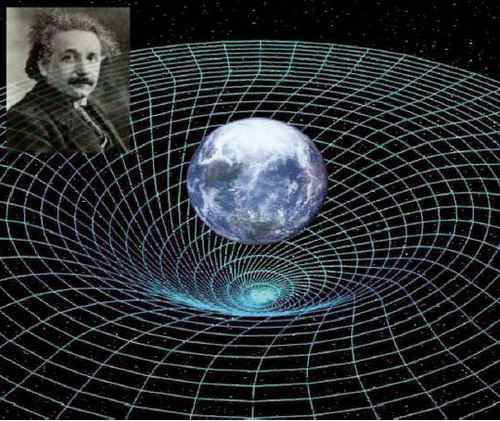
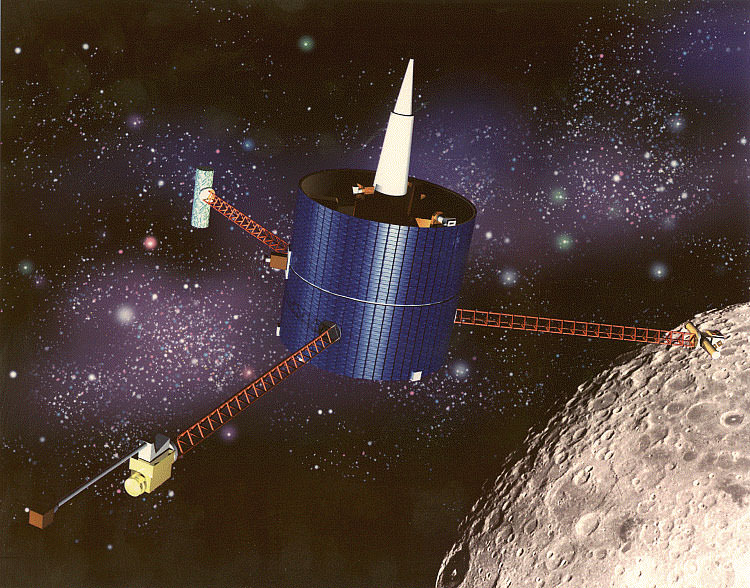
An artist’s concept of twisted space-time around Earth. Image credit: NASA. Click to enlarge
Is Earth in a vortex of space-time?

We’ll soon know the answer: A NASA/Stanford physics experiment called Gravity Probe B (GP-B) recently finished a year of gathering science data in Earth orbit. The results, which will take another year to analyze, should reveal the shape of space-time around Earth–and, possibly, the vortex.

Time and space, according to Einstein’s theories of relativity, are woven together, forming a four-dimensional fabric called “space-time.” The tremendous mass of Earth dimples this fabric, much like a heavy person sitting in the middle of a trampoline. Gravity, says Einstein, is simply the motion of objects following the curvaceous lines of the dimple.

If Earth were stationary, that would be the end of the story. But Earth is not stationary. Our planet spins, and the spin should twist the dimple, slightly, pulling it around into a 4-dimensional swirl. This is what GP-B went to space to check

The idea behind the experiment is simple:

Put a spinning gyroscope into orbit around the Earth, with the spin axis pointed toward some distant star as a fixed reference point. Free from external forces, the gyroscope’s axis should continue pointing at the star–forever. But if space is twisted, the direction of the gyroscope’s axis should drift over time. By noting this change in direction relative to the star, the twists of space-time could be measured.

In practice, the experiment is tremendously difficult.

The four gyroscopes in GP-B are the most perfect spheres ever made by humans. These ping pong-sized balls of fused quartz and silicon are 1.5 inches across and never vary from a perfect sphere by more than 40 atomic layers. If the gyroscopes weren’t so spherical, their spin axes would wobble even without the effects of relativity.

According to calculations, the twisted space-time around Earth should cause the axes of the gyros to drift merely 0.041 arcseconds over a year. An arcsecond is 1/3600th of a degree. To measure this angle reasonably well, GP-B needed a fantastic precision of 0.0005 arcseconds. It’s like measuring the thickness of a sheet of paper held edge-on 100 miles away.

GP-B researchers invented whole new technologies to make this possible. They developed a “drag free” satellite that could brush against the outer layers of Earth’s atmosphere without disturbing the gyros. They figured out how to keep Earth’s penetrating magnetic field out of the spacecraft. And they concocted a device to measure the spin of a gyro–without touching the gyro.

Pulling off the experiment was an exceptional challenge. A lot of time and money was on the line, but the GP-B scientists appear to have done it.

“There were not any major surprises” in the experiment’s performance, says physics professor Francis Everitt, the Principal Investigator for GP-B at Stanford University. Now that data-taking is complete, he says the mood among the GP-B scientists is “a lot of enthusiasm, and a realization also that a lot of grinding hard work is ahead of us.”

A careful, thorough analysis of the data is underway. The scientists will do it in three stages, Everitt explains. First, they will look at the data from each day of the year-long experiment, checking for irregularities. Next they’ll break the data into roughly month-long chunks, and finally they’ll look at the whole year. By doing it this way, the scientists should be able to find any problems that a more simple analysis might miss.

Eventually scientists around the world will scrutinize the data. Says Everitt, “we want our sternest critics to be us.”

The stakes are high. If they detect the vortex, precisely as expected, it simply means that Einstein was right, again. But what if they don’t? There might be a flaw in Einstein’s theory, a tiny discrepancy that heralds a revolution in physics.

First, though, there are a lot of data to analyze. Stay tuned.

Original Source: NASA News Release

Simulation Casts Doubts on One Theory of Star Formation

A slice through a 3-D simulation of a turbulent clump of molecular hydrogen. Image credit: Mark Krumholz. Click to enlarge
Astrophysicists at the University of California, Berkeley, and Lawrence Livermore National Laboratory (LLNL) have exploded one of two competing theories about how stars form inside immense clouds of interstellar gas.

That model, which is less than 10 years old and is championed by some British astronomers, predicts that interstellar hydrogen clouds develop clumps in which several small cores – the seeds of future stars – form. These cores, less than a light year across, collapse under their own gravity and compete for gas in the surrounding clump, often gaining 10 to 100 times their original mass from the clump.

The alternative model, often termed the “gravitational collapse and fragmentation” theory, also presumes that clouds develop clumps in which proto-stellar cores form. But in this theory, the cores are large and, though they may fragment into smaller pieces to form binary or multiple star systems, contain nearly all the mass they ever will.

“In competitive accretion, the cores are seeds that grow to become stars; in our picture, the cores turn into the stars,” explained Chris McKee, professor of physics and of astronomy at UC Berkeley. “The observations to date, which focus primarily on regions of low-mass star formation, like the sun, are consistent with our model and inconsistent with theirs.”

“Competitive accretion is the big theory of star formation in Europe, and we now think it’s a dead theory,” added Richard Klein, an adjunct professor of astronomy at UC Berkeley and a researcher at LLNL.

Mark R. Krumholz, now a post-doctoral fellow at Princeton University, McKee and Klein report their findings in the Nov. 17 issue of Nature.

Both theories try to explain how stars form in cold clouds of molecular hydrogen, perhaps 100 light years across and containing 100,000 times the mass of our sun. Such clouds have been photographed in brilliant color by the Hubble and Spitzer space telescopes, yet the dynamics of a cloud’s collapse into one or many stars is far from clear. A theory of star formation is critical to understanding how galaxies and clusters of galaxies form, McKee said.

“Star formation is a very rich problem, involving questions such as how stars like the sun formed, why a very large number of stars are in binary star systems, and how stars ten to a hundred times the mass of the sun form,” he said. “The more massive stars are important because, when they explode in a supernova, they produce most of the heavy elements we see in the material around us.”

The competitive accretion model was hatched in the late 1990s in response to problems with the gravitational collapse model, which seemed to have trouble explaining how large stars form. In particular, the theory couldn’t explain why the intense radiation from a large protostar doesn’t just blow off the star’s outer layers and prevent it from growing larger, even though astronomers have discovered stars that are 100 times the mass of the sun.

While theorists, among them McKee, Klein and Krumholz, have advanced the gravitational collapse theory farther toward explaining this problem, the competitive accretion theory has come increasingly into conflict with observations. For example, the accretion theory predicts that brown dwarfs, which are failed stars, are thrown out of clumps and lose their encircling disks of gas and dust. In the past year, however, numerous brown dwarfs have been found with planetary disks.

“Competitive accretion theorists have ignored these observations,” Klein said. “The ultimate test of any theory is how well it agrees with observation, and here the gravitational collapse theory appears to be the clear winner.”

The model used by Krumholz, McKee and Klein is a supercomputer simulation of the complicated dynamics of gas inside a swirling, turbulent cloud of molecular hydrogen as it accretes onto a star. Theirs is the first study of the effects of turbulence on the rate at which a star accretes matter as it moves through a gas cloud, and it demolishes the “competitive accretion” theory.

Employing 256 parallel processors at the San Diego Supercomputer Center at UC San Diego, they ran their model for nearly two weeks to show that it accurately represented star formation dynamics.

“For six months, we worked on very, very detailed, high-resolution simulations to develop that theory,” Klein said. “Then, having that theory in hand, we applied it to star forming regions with the properties that one could glean from a star forming region.”

The models, which also were run on supercomputers at Lawrence Berkeley National Laboratory and LLNL, showed that turbulence in the core and surrounding clump would prevent accretion from adding much mass to a protostar.

“We have shown that, because of turbulence, a star cannot efficiently accrete much more mass from the surrounding clump,” Klein said. “In our theory, once a core collapses and fragments, that star basically has all the mass it is ever going to have. If it was born in a low-mass core, it will end up being a low-mass star. If it’s born in a high mass core, it may become a high-mass star.”

McKee noted that the researchers’ supercomputer simulation indicates competitive accretion may work well for small clouds with very little turbulence, but these rarely, if ever, occur and have not been observed to date. Real star formation regions have much more turbulence than assumed in the accretion model, and the turbulence does not quickly decay, as that model presumes. Some unknown processes, perhaps matter flowing out of protostars, keep the gases roiled up so that the core does not collapse quickly.

“Turbulence opposes gravity; without it, a molecular cloud would collapse far more rapidly than observed,” Klein said. “Both theories assume turbulence is there. The key is (that) there are processes going on as stars begin to form that keep turbulence alive and prevent it from decaying. The competitive accretion model doesn’t have any way to put this into the calculations, which means they’re not modeling real star forming regions.”

Klein, McKee and Krumholz continue to refine their model to explain how radiation from large protostars escapes without blowing away all the infalling gas. For example, they have shown that some of the radiation can escape through cavities created by the jets observed to come out the poles of many stars in formation. Many predictions of the theory may be answered by new and larger telescopes now under construction, in particular the sensitive, high-resolution ALMA telescope being constructed in Chile by a consortium of United States, European and Japanese astronomers, McKee said.

The work was supported by the National Aeronautics and Space Administration, the National Science Foundation and the Department of Energy.

Original Source: UC Berkeley News Release

Spirit Sees a Martian Lunar Eclipse

Phobos. Image credit: NASA. Click to enlarge
NASA’s Mars Exploration Rover Spirit continues to take advantage of favorable solar power conditions to conduct occasional nighttime astronomical observations from the summit region of “Husband Hill.”

Spirit has been observing the martian moons Phobos and Deimos to learn more about their orbits and surface properties. This has included observing eclipses. On Earth, a solar eclipse occurs when the Moon’s orbit takes it exactly between the Sun and Earth, casting parts of Earth into shadow. A lunar eclipse occurs when the Earth is exactly between the Sun and the Moon, casting the Moon into shadow and often giving it a ghostly orange-reddish color. This color is created by sunlight reflected through Earth’s atmosphere into the shadowed region. The primary difference between terrestrial and martian eclipses is that Mars’ moons are too small to completely block the Sun from view during solar eclipses.

Recently, Spirit observed a “lunar” eclipse on Mars. Phobos, the larger of the two martian moons, was photographed while slipping into the shadow of Mars. Jim Bell, the astronomer in charge of the rover’s panoramic camera (Pancam), suggested calling it a “Phobal” eclipse rather than a lunar eclipse as a way of identifying which of the dozens of moons in our solar system was being cast into shadow.

With the help of the Jet Propulsion Laboratory’s navigation team, the Pancam team planned instructions to Spirit for acquiring the views shown here of Phobos as it entered into a lunar eclipse on the evening of the rover’s 639th martian day, or sol (Oct. 20, 2005) on Mars. This image is a time-lapse composite of eight Pancam images of Phobos moving across the martian sky. The entire eclipse lasted more than 26 minutes, but Spirit was able to observe only in the first 15 minutes. During the time closest to the shadow crossing, Spirit’s cameras were programmed to take images every 10 seconds.

In the first three images, Phobos was in sunlight, moving toward the upper right. After a 100-second delay while Spirit’s computer processed the first three images, the rover then took the fourth image, showing Phobos just starting to enter the darkness of the martian shadow. At that point, an observer sitting on Phobos and looking back toward the Sun would have seen a spectacular sunset! In the fifth image, Phobos appeared like a crescent, almost completely shrouded in darkness.

In the last three images, Phobos had slipped entirely into the shadow of Mars. However, as with our own Moon during lunar eclipses on Earth, it was not entirely dark. The small amount of light still visible from Phobos is a kind of “Mars-shine” — sunlight reflected through Mars’ atmosphere and into the shadowed region.

Rover scientists took some images later in the sequence to try to figure out if this “Mars-shine” made Phobos colorful while in eclipse, but they’ll need more time to complete the analysis because the signal levels are so low. Meanwhile, they will use the information on the timing of the eclipse to refine the orbital path of Phobos. The precise position of Phobos will be important to any future spacecraft taking detailed pictures of the moon or landing on its surface. In the near future it might be possible for one of the rovers to take images of a “Deimal” eclipse to learn more about Mars’ other enigmatic satellite, Deimos, as well.

Original Source: NASA News Release

Close-Up on Pandora

Cassini’s best close-up view of Pandora. Image credit: NASA/JPL/SSI Click to enlarge
Cassini’s best close-up view of Saturn’s F ring shepherd moon, Pandora, shows that this small ring-moon is coated in fine dust-sized icy material.

Craters formed on this object by impacts appear to be covered by debris, a process that probably happens rapidly in a geologic sense. The grooves and small ridges on Pandora (84 kilometers, or 52 miles across) suggest that fractures affect the overlying smooth material.

The crisp craters on another Saturn moon, Hyperion, provide a contrasting example of craters on a small object (see Odd World).

Cassini acquired infrared, green and ultraviolet images on Sept. 5, 2005, which were combined to create this false-color view. The image was taken with the Cassini spacecraft narrow-angle camera at a distance of approximately 52,000 kilometers (32,000 miles) from Pandora and at a Sun-Pandora-spacecraft, or phase, angle of 54 degrees. Resolution in the original image was about 300 meters (1,000 feet) per pixel. The image has been magnified by a factor of two to aid visibility.

The Cassini-Huygens mission is a cooperative project of NASA, the European Space Agency and the Italian Space Agency. The Jet Propulsion Laboratory, a division of the California Institute of Technology in Pasadena, manages the mission for NASA’s Science Mission Directorate, Washington, D.C. The Cassini orbiter and its two onboard cameras were designed, developed and assembled at JPL. The imaging operations center is based at the Space Science Institute in Boulder, Colo.

For more information about the Cassini-Huygens mission visit http://saturn.jpl.nasa.gov . The Cassini imaging team homepage is at http://ciclops.org .

Original Source: NASA/JPL/SSI News Release

New Class of Supergiant Binary Stars Discovered

Artist’s impression of a ‘supergiant fast X-ray transient’. Image credit: ESA Click to enlarge
ESA’s Integral gamma-ray observatory has discovered a new, highly populated class of X-ray fast “transient” binary stars, undetected in previous observations.

With this discovery, Integral confirms how much it is contributing to revealing a whole hidden Universe.

The new class of double star systems is characterised by a very compact object that produces highly energetic, recurrent and fast-growing X-ray outbursts, and a very luminous “supergiant” companion.

The compact object can be an accreting body such as a black hole, a neutron star or a pulsar. Scientists have called such class of objects “supergiant fast X-ray transients”. “Transients” are systems which display periods of enhanced X-ray emission.

Before the launch of Integral, only a dozen X-ray binary stars containing supergiants had been detected. Actually, scientists thought that such high-mass X-ray systems were very rare, assuming that only a few of them would exist at once since stars in supergiant phase have a very short lifetime.

However, Integral’s data combined with other X-ray satellite observations indicate that transient supergiant X-ray binary systems are probably much more abundant in our Galaxy than previously thought.

In particular, Integral is showing that such “supergiant fast X-ray transients”, characterised by fast outbursts and supergiant companions, form a wide class that lies hidden throughout the Galaxy.

Due to the transitory nature, in most cases these systems were not detected by other observatories because they lacked the combination of sensitivity, continuous coverage and wide field of view of Integral.

They show short outbursts with very fast rising times – reaching the peak of the flare in only a few tens of minutes – and typically lasting a few hours only. This makes the main difference with most other observed transient X-ray binary systems, which display longer outbursts, lasting typically a few weeks up to months.

In the latter case, the long duration of the outburst is consistent with a “viscous” mass exchange between the star and an accreting compact object.

In “supergiant fast X-ray transients”, associated with highly luminous supergiant stars, the short duration of the outburst seems to point to a different and peculiar mass exchange mechanism between the two bodies.

This may have something to do with the way the strong radiative winds, typical of highly massive stars, feed the compact object with stellar material.

Scientists are now thinking about the reasons for such short outbursts. It could be due to the supergiant donor ejecting material in a non-continuous way. For example, a clumpy and intrinsically variable nature of a supergiant”s radiative winds may give rise to sudden episodes of increased accretion rate, leading to the fast X-ray flares.

Alternatively, the flow of material transported by the wind may become, for reasons not very well understood, very turbulent and irregular when falling into the enormous gravitational potential of the compact object.

“In any case, we are pretty confident that the fast outbursts are associated to the mass transfer mode from the supergiant star to the compact object,” says Ignacio Negueruela, lead author of the results, from the University of Alicante, Spain.

“We believe that the short outbursts cannot be related to the nature of the compact companion, as we observed fast outbursts in cases where the compact objects were very different – black holes, slow X-ray pulsars or fast X-ray pulsars.”

Studying sources such as “supergiant fast X-ray transients”, and understanding the reasons for their behaviour, is very important to increase our knowledge of accretion processes of compact stellar objects. Furthermore, it is providing valuable insight into the evolution paths that lead to the formation of high-mass X-ray binary systems.

Original Source: ESA Portal

Podcast: Best Space and Astronomy Books of 2005

The year is coming to a close. And in case you haven’t been counting, we’ve reviewed more than 50 space and astronomy books on Universe Today since January. That’s a lot of books, and book fiend Mark Mortimer did most of the reading and reviewing. He joins me today for a special podcast where we chat about his favorites for the year.
Continue reading “Podcast: Best Space and Astronomy Books of 2005”

Side-by-Side Supernova Remnants

DEM L316 supernova remnants. Image credit: Chandra. Click to enlarge.
This composite X-ray (red and green)/optical (blue) image reveals a cat-shaped image produced by the remnants of two exploded stars in the Large Magellanic Cloud galaxy. Although the shells of hot gas appear to be colliding, this may be an illusion.

Chandra X-ray spectra show that the hot gas shell on the upper left contains considerably more iron than the one on the lower right. The high abundance of iron implies that this supernova remnant is the product of a Type Ia supernova triggered by the infall of matter from a companion star onto a white dwarf star.

In contrast, the much lower abundance of iron in the lower supernova remnant indicates that it was a Type II supernova produced by the explosion of a young, massive star. It takes billions of years to form a white dwarf star, whereas a massive young star will explode in a few million years. The disparity of ages in the progenitor stars means that it is very unlikely that they exploded very close to each other. The apparent proximity of the remnants is probably the result of a chance alignment.

Original Source: Chandra News Release

Spotlight on the Cassini Division

Saturn’s rings and the Cassini Division. Image credit: NASA/JPL/SSI. Click to enlarge.
The dark Cassini Division, within Saturn’s rings, contains a great deal of structure, as seen in this color image. The sharp inner boundary of the division (left of center) is the outer edge of the massive B ring and is maintained by the gravitational influence of the moon Mimas.

Spectroscopic observations by Cassini indicate that the Cassini Division, similar to the C ring, contains more contaminated ice than do the B and A rings on either side.

This view is centered on a region approximately 118,500 kilometers (73,600 miles) from Saturn’s center. (Saturn is 120,500-kilometers-wide (74,900 miles) at its equator.) From left to right, the image spans approximately 11,000 kilometers (6,800 miles) across the ringplane.

A closer view of the outer edge of the Cassini Division can be seen in The Cassini Division’s Edge.

Images taken using red, green and blue spectral filters were combined to create this view, which approximates what the human eye might see. The image was taken with the Cassini spacecraft narrow-angle camera on May 18, 2005, at a distance of approximately 1.6 million kilometers (1 million miles) from Saturn. The image scale is 9 kilometers (6 miles) per pixel.

The Cassini-Huygens mission is a cooperative project of NASA, the European Space Agency and the Italian Space Agency. The Jet Propulsion Laboratory, a division of the California Institute of Technology in Pasadena, manages the mission for NASA’s Science Mission Directorate, Washington, D.C. The Cassini orbiter and its two onboard cameras were designed, developed and assembled at JPL. The imaging operations center is based at the Space Science Institute in Boulder, Colo. For more information about the Cassini-Huygens mission visit http://saturn.jpl.nasa.gov . The Cassini imaging team homepage is at http://ciclops.org .

Original Source: NASA/JPL/SSI News Release

NASA Ames Leads New Robotic Moon Missions

Lunar Prospector spacecraft. Image credit: NASA. Click to enlarge.
Today, on the 36th anniversary of Apollo 12, the second manned lunar landing, NASA announced that it has assigned management of its Robotic Lunar Exploration Program to NASA Ames Research Center in California’s Silicon Valley.

Returning astronauts to the moon will start with robotic missions between 2008 and 2011 to study, map and learn about the lunar surface. These early missions will help determine lunar landing sites and whether resources, such as oxygen, hydrogen and metals, are available for use in NASA’s long-term lunar exploration objectives. The assignment marks a rebirth of robotic space flight work at NASA Ames, which has a history of spearheading unmanned space launches.

“The Robotic Lunar Exploration Program is a critical element of NASA’s Vision for Space Exploration,” said Exploration Systems Mission Directorate Associate Administrator Dr. Scott Horowitz. “Data collected will help determine where we go, and what we find during our first human missions to the lunar surface.”

“Ames is delighted to be the home of the new Robotic Lunar Exploration Program,” said G. Scott Hubbard, Ames’ director. “Our center has a 40-year history of excellent space flight programs and project management: the Pioneer 6-13 series, the Galileo Probe and Lunar Prospector, as well as a lunar magnetic field instrument for four Apollo missions starting with Apollo 12 in 1969. We will apply all this experience to make RLEP successful,” Hubbard noted.

Launched on Jan. 6, 1998, from Cape Canaveral Air Station, Fla., Lunar Prospector reached the moon in four days. The mission was the last NASA voyage to our nearest neighbor in space.

The spacecraft orbited the moon and gathered data that resulted in evidence that water ice exists in shadowed craters near the lunar south and north poles, the first precise gravity map of the entire lunar surface, confirmation of the presence of local magnetic fields that create the two smallest magnetospheres in the solar system and the first global maps of the moon’s elemental composition.

Returning robots, and then astronauts, to the moon provides opportunities to develop and mature technologies needed for long-term survival on other worlds, according to scientists.

“An exploration science program with a sustained human presence on the moon gives us the opportunity to conduct fundamental science in lunar geology, history of the solar system, physics and the biological response to partial (Earth) gravity,” said Christopher McKay, lunar exploration program scientist at Ames.

“Establishing research stations on the moon will give us the experience and capabilities to extend to Mars and beyond,” robotics deputy program manager Butler Hine of Ames noted.

Original Source: NASA News Release

Spitzer Sees a Group of Baby Stars

Star forming region NGC 1333. Image credit: Spitzer. Click to enlarge.
Located 1,000 light-years from Earth in the constellation Perseus, a reflection nebula called NGC 1333 epitomizes the beautiful chaos of a dense group of stars being born. Most of the visible light from the young stars in this region is obscured by the dense, dusty cloud in which they formed. With NASA’s Spitzer Space Telescope, scientists can detect the infrared light from these objects. This allows a look through the dust to gain a more detailed understanding of how stars like our sun begin their lives.

The young stars in NGC 1333 do not form a single cluster, but are split between two sub-groups. One group is to the north near the nebula shown as red in the image. The other group is south, where the features shown in yellow and green abound in the densest part of the natal gas cloud. With the sharp infrared eyes of Spitzer, scientists can detect and characterize the warm and dusty disks of material that surround forming stars. By looking for differences in the disk properties between the two subgroups, they hope to find hints of the star- and planet-formation history of this region.

The knotty yellow-green features located in the lower portion of the image are glowing shock fronts where jets of material, spewed from extremely young embryonic stars, are plowing into the cold, dense gas nearby. The sheer number of separate jets that appear in this region is unprecedented. This leads scientists to believe that by stirring up the cold gas, the jets may contribute to the eventual dispersal of the gas cloud, preventing more stars from forming in NGC 1333.

In contrast, the upper portion of the image is dominated by the infrared light from warm dust, shown as red.

Original Source: Spitzer News Release