The Ozone Layer’s Recovering

The Antarctic ozone hole. Image credit: NASA.
Over the last few decades, scientists have been tracking the depletion of the ozone layer in the Earth’s atmosphere. A large hole still opens up over Antarctica, but ozone levels worldwide have stopped declining. The question is why. The relatively recent reduction of ozone-destroying gasses shouldn’t make an improvement so quickly. NASA scientists think that atmospheric wind patterns could be transferring ozone around the planet, helping with the recovery. At this rate, we’ll return to 1980 levels between 2030 and 2070.

Think of the ozone layer as Earth’s sunglasses, protecting life on the surface from the harmful glare of the sun’s strongest ultraviolet rays, which can cause skin cancer and other maladies.

People were understandably alarmed, then, in the 1980s when scientists noticed that manmade chemicals in the atmosphere were destroying this layer. Governments quickly enacted an international treaty, called the Montreal Protocol, to ban ozone-destroying gases such as CFCs then found in aerosol cans and air conditioners.

Today, almost 20 years later, reports continue of large ozone holes opening over Antarctica, allowing dangerous UV rays through to Earth’s surface. Indeed, the 2005 ozone hole was one of the biggest ever, spanning 24 million sq km in area, nearly the size of North America.

Listening to this news, you might suppose that little progress has been made. You’d be wrong.

While the ozone hole over Antarctica continues to open wide, the ozone layer around the rest of the planet seems to be on the mend. For the last 9 years, worldwide ozone has remained roughly constant, halting the decline first noticed in the 1980s.

The question is why? Is the Montreal Protocol responsible? Or is some other process at work?

It’s a complicated question. CFCs are not the only things that can influence the ozone layer; sunspots, volcanoes and weather also play a role. Ultraviolet rays from sunspots boost the ozone layer, while sulfurous gases emitted by some volcanoes can weaken it. Cold air in the stratosphere can either weaken or boost the ozone layer, depending on altitude and latitude. These processes and others are laid out in a review just published in the May 4th issue of Nature: “The search for signs of recovery of the ozone layer” by Elizabeth Westhead and Signe Andersen.

Sorting out cause and effect is difficult, but a group of NASA and university researchers may have made some headway. Their new study, entitled “Attribution of recovery in lower-stratospheric ozone,” was just accepted for publication in the Journal of Geophysical Research. It concludes that about half of the recent trend is due to CFC reductions.

Lead author Eun-Su Yang of the Georgia Institute of Technology explains: “We measured ozone concentrations at different altitudes using satellites, balloons and instruments on the ground. Then we compared our measurements with computer predictions of ozone recovery, [calculated from real, measured reductions in CFCs].” Their calculations took into account the known behavior of the sunspot cycle (which peaked in 2001), seasonal changes in the ozone layer, and Quasi-Biennial Oscillations, a type of stratospheric wind pattern known to affect ozone.

What they found is both good news and a puzzle.

The good news: In the upper stratosphere (above roughly 18 km), ozone recovery can be explained almost entirely by CFC reductions. “Up there, the Montreal Protocol seems to be working,” says co-author Mike Newchurch of the Global Hydrology and Climate Center in Huntsville, Alabama.

The puzzle: In the lower stratosphere (between 10 and 18 km) ozone has recovered even better than changes in CFCs alone would predict. Something else must be affecting the trend at these lower altitudes.

The “something else” could be atmospheric wind patterns. “Winds carry ozone from the equator where it is made to higher latitudes where it is destroyed. Changing wind patterns affect the balance of ozone and could be boosting the recovery below 18 km,” says Newchurch. This explanation seems to offer the best fit to the computer model of Yang et al. The jury is still out, however; other sources of natural or manmade variability may yet prove to be the cause of the lower-stratosphere’s bonus ozone.

Whatever the explanation, if the trend continues, the global ozone layer should be restored to 1980 levels sometime between 2030 and 2070. By then even the Antarctic ozone hole might close–for good.

Original Source: NASA News Release

Finding a Fourth Dimension

Braneworld challenges Einstein’s general relativity. Image credit: NASA. Click to enlarge
Scientists have been intrigued for years about the possibility that there are additional dimensions beyond the three we humans can understand. Now researchers from Duke and Rutgers universities think there’s a way to test for five-dimensional theory (4 spatial dimensions plus time) of gravity that competes with Einstein’s General Theory of Relativity. This extra dimension should have effects in the cosmos which are detectable by satellites scheduled to launch in the next few years.

Scientists at Duke and Rutgers universities have developed a mathematical framework they say will enable astronomers to test a new five-dimensional theory of gravity that competes with Einstein’s General Theory of Relativity.

Charles R. Keeton of Rutgers and Arlie O. Petters of Duke base their work on a recent theory called the type II Randall-Sundrum braneworld gravity model. The theory holds that the visible universe is a membrane (hence “braneworld”) embedded within a larger universe, much like a strand of filmy seaweed floating in the ocean. The “braneworld universe” has five dimensions — four spatial dimensions plus time — compared with the four dimensions — three spatial, plus time — laid out in the General Theory of Relativity.

The framework Keeton and Petters developed predicts certain cosmological effects that, if observed, should help scientists validate the braneworld theory. The observations, they said, should be possible with satellites scheduled to launch in the next few years.
If the braneworld theory proves to be true, “this would upset the applecart,” Petters said. “It would confirm that there is a 4th dimension to space, which would create a philosophical shift in our understanding of the natural world.”

The scientists’ findings appeared May 24, 2006, in the online edition of the journal Physical Review D. Keeton is an astronomy and physics professor at Rutgers, and Petters is a mathematics and physics professor at Duke. Their research is funded by the National Science Foundation.

The Randall-Sundrum braneworld model — named for its originators, physicists Lisa Randall of Harvard University and Raman Sundrum of Johns Hopkins University — provides a mathematical description of how gravity shapes the universe that differs from the description offered by the General Theory of Relativity.

Keeton and Petters focused on one particular gravitational consequence of the braneworld theory that distinguishes it from Einstein’s theory.

The braneworld theory predicts that relatively small “black holes” created in the early universe have survived to the present. The black holes, with mass similar to a tiny asteroid, would be part of the “dark matter” in the universe. As the name suggests, dark matter does not emit or reflect light, but does exert a gravitational force.

The General Theory of Relativity, on the other hand, predicts that such primordial black holes no longer exist, as they would have evaporated by now.

“When we estimated how far braneworld black holes might be from Earth, we were surprised to find that the nearest ones would lie well inside Pluto’s orbit,” Keeton said.

Petters added, “If braneworld black holes form even 1 percent of the dark matter in our part of the galaxy — a cautious assumption — there should be several thousand braneworld black holes in our solar system.”

But do braneworld black holes really exist — and therefore stand as evidence for the 5-D braneworld theory?

The scientists showed that it should be possible to answer this question by observing the effects that braneworld black holes would exert on electromagnetic radiation traveling to Earth from other galaxies. Any such radiation passing near a black hole will be acted upon by the object’s tremendous gravitational forces — an effect called “gravitational lensing.”

“A good place to look for gravitational lensing by braneworld black holes is in bursts of gamma rays coming to Earth,” Keeton said. These gamma-ray bursts are thought to be produced by enormous explosions throughout the universe. Such bursts from outer space were discovered inadvertently by the U.S. Air Force in the 1960s.

Keeton and Petters calculated that braneworld black holes would impede the gamma rays in the same way a rock in a pond obstructs passing ripples. The rock produces an “interference pattern” in its wake in which some ripple peaks are higher, some troughs are deeper, and some peaks and troughs cancel each other out. The interference pattern bears the signature of the characteristics of both the rock and the water.

Similarly, a braneworld black hole would produce an interference pattern in a passing burst of gamma rays as they travel to Earth, said Keeton and Petters. The scientists predicted the resulting bright and dark “fringes” in the interference pattern, which they said provides a means of inferring characteristics of braneworld black holes and, in turn, of space and time.

“We discovered that the signature of a fourth dimension of space appears in the interference patterns,” Petters said. “This extra spatial dimension creates a contraction between the fringes compared to what you’d get in General Relativity.”

Petters and Keeton said it should be possible to measure the predicted gamma-ray fringe patterns using the Gamma-ray Large Area Space Telescope, which is scheduled to be launched on a spacecraft in August 2007. The telescope is a joint effort between NASA, the U.S. Department of Energy, and institutions in France, Germany, Japan, Italy and Sweden.

The scientists said their prediction would apply to all braneworld black holes, whether in our solar system or beyond.

“If the braneworld theory is correct,” they said, “there should be many, many more braneworld black holes throughout the universe, each carrying the signature of a fourth dimension of space.”

Original Source: Duke University

Minerals Stop Transfering Heat at the Earth’s Core

Magnesiowustite crystals lose the ability of infrared transmission when squashed. Image credit: JHU/NASA. Click to enlarge
Researchers from the Carnegie Institution’s Geophysical Laboratory have discovered that certain minerals stop conducting infrared light as they near the Earth’s core. Even though they transmit infrared light perfectly well on the surface, they actually absorb it when crushed by the intense pressures near the Earth’s core. This discovery will help scientists better understand the flow of heat in the Earth’s interior, as well as helping to develop new models of planetary formation and evolution.

Minerals crunched by intense pressure near the Earth’s core lose much of their ability to conduct infrared light, according to a new study from the Carnegie Institution’s Geophysical Laboratory. Since infrared light contributes to the flow of heat, the result challenges some long-held notions about heat transfer in the lower mantle, the layer of molten rock that surrounds the Earth’s solid core. The work could aid the study of mantle plumes-large columns of hot upwelling magma believed to produce features such as the Hawaiian Islands and Iceland.

Crystals of magnesiowustite, a common mineral within the deep Earth, can transmit infrared light at normal atmospheric pressures. But when squashed to over half a million times the pressure at sea level, these crystals instead absorb infrared light, which hinders the flow of heat. The research will appear in the May 26, 2006 issue of the journal Science.

Carnegie staff members Alexander Goncharov and Viktor Struzhkin, with postdoctoral fellow Steven Jacobsen, pressed crystals of magnesiowustite using a diamond anvil cell-a chamber bound by two superhard diamonds capable of generating incredible pressure. They then shone intense light through the crystals and measured the wavelengths of light that made it through. To their surprise, the compressed crystals absorbed much of the light in the infrared range, suggesting that magnesiowustite is a poor conductor of heat at high pressures.

“The flow of heat in Earth’s deep interior plays an important role in the dynamics, structure, and evolution of the planet,” Goncharov said. There are three primary mechanisms by which heat is likely to circulate in the deep Earth: conduction, the transfer of heat from one material or area to another; radiation, the flow of energy via infrared light; and convection, the movement of hot material. “The relative amount of heat flow from these three mechanisms is currently under intense debate,” Goncharov added.

Magnesiowustite is the second most common mineral in the lower mantle. Since it does not transmit heat well at high pressures, the mineral could actually form insulating patches around much of the Earth’s core. If that is the case, radiation might not contribute to overall heat flow in these areas, and conduction and convection might play a bigger role in venting heat from the core.

“It’s still too early to tell exactly how this discovery will affect deep-Earth geophysics,” Goncharov said. “But so much of what we assume about the deep Earth relies on our models of heat transfer, and this study calls a lot of that into question.”

Original Source: Carnegie Institution

What’s Up This Week – May 29 – June 4, 2006

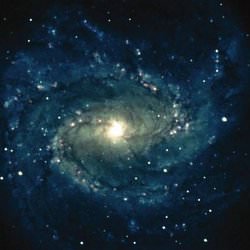
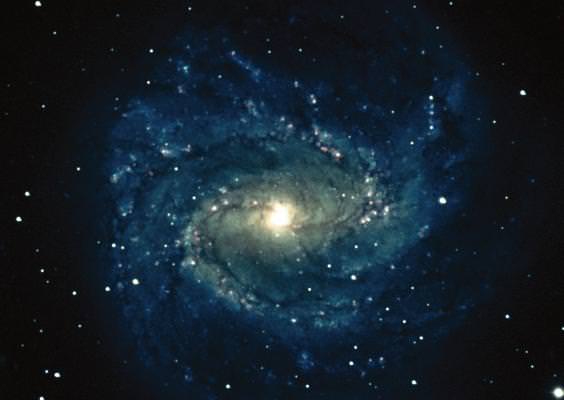
M83: “The Southern Pinwheel”. Image credit: Bill Schoening/NOAO/AURA/NSF. Click to enlarge.
Greetings, fellow SkyWatchers! Let’s hope clear skies have returned to your area as we begin the week with a look at the incredible M83. As the Moon returns, we’ll study the features and be in for some excitement as it occults asteroid Vesta. Stay tuned as we go globular and catch some “shooting stars” because…

Here’s what’s up!

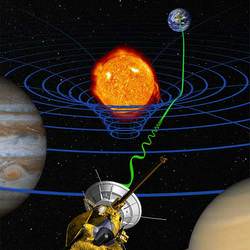
Monday, May 29 – Today in 1919, a total eclipse of the Sun occurred and stellar measurements taken along the limb agreed with predictions based on Einstein’s General Relativity theory – a first! Although we call it gravity, the space-time curve deflects the light of stars near the limb, causing their apparent position to differ slightly. Unlike today’s astronomy, at that time you could only observe stars near the Sun’s limb (less than an arc second) during an eclipse. It’s interesting to note that even Newton had his own theories on light and gravitation which also predicted deflection!

With tonight’s thin moon setting early, let’s have a look at the superb “Southern Pinwheel” galaxy – M83. You’ll find it a little more than a fist width south-southeast of Gamma Hydrae.

Pictures of M83 are often used to show budding astronomers what our own galaxy would look like if it were “out there” rather than “all around us.” In astrophotos, M83 shows a luminous central core with two broad bars of almost equally intense light extending outward across from one another. These act as trunks for the gnarled growth of the galaxy’s main spiral arms. Well away from the core, three spiral extensions are seen coiling outward to ultimately dissipate into space. But, that’s where the comparison with our own galaxy ends. This 15 million light-year distant, 30,000 light-year diameter class SB spiral is but a miniature of our giant spiral!

As you observe M83 tonight take the time to look for the structure described above – the round central core region, lateral bars, and spiraling extensions. More aperture means more light, and more detail.

Something new? First re-locate M5 in Serpens then head 3 degrees east. There you will find the brightest galaxy (NGC 5846) of a half dozen or so clustered around 4.6 magnitude 110 Virginis. These include NGCs 5850, 5831, 5838, 5854, 5813, and NGC 5806. These seven galaxies range in magnitude from 10.2 to 11.8 – and all are within the range of a mid-size scope.

Tuesday, May 30 – Tonight we’ll begin our studies by checking out the slender crescent of the Moon. To the north you will see the eastern edge of Mare Crisium beginning to emerge. The bright point on the shoreline is Promontorium Agarum with shallow crater Condorcet to its east. Look along the shore of the mare for a mountain to the south known as Mons Usov. Just to its north Luna 24 landed and directly to its west are the remains of Luna 15. Can you spot tiny crater Fahrenheit nearby?

Once the Moon has set, let’s revisit a spectacular globular cluster well suited to all instruments – M5. To find M5 easily, head southeast of Arcturus and north of Beta Librae and identify 5 Serpentis. At low power, or in binoculars, you will see this handsome globular in the same field to the northwest.

First discovered while observing a comet by Gottfried Kirch and his wife in 1702, Charles Messier found it on his own on May 23, 1764. Although Messier said it was a round nebula that “doesn’t contain any stars,” even small scopes can resolve the curved patterns of stars that extend from M5’s bright nucleus. Binoculars will reveal it with ease. For a real challenge, large telescopes can look for 11.8 magnitude globular Palomar 5 about 40′ south of the star 4 Serpentis. Under very dark, clear skies, M5 can just be glimpsed unaided, but telescopes will enjoy the rose-petal like star arcs of this 13 billion year old city of stars.

Wednesday, May 31 – Be very sure to check with IOTA for an awesome event on this Universal date. Why? Asteroid Vesta will be occulted by the Moon!

Tonight let’s return to Mare Crisium and look for some challenging features. Beginning on the south shore of Crisium, start by identifying crater Shaply trapped on the edge of the mare’s enclosure. To the southeast of Shaply you will see two small grey ovals. The northernmost is crater Firmicus with crater Apollonius to its south. Further south you will see the smooth grey area of Sinus Successus. If you look at the paler peninsula on Successus’ northern shore, you are seeing crater Ameghino and the landing area of the Luna 18 and Luna 20 missions.

If you’d like to take on another mission tonight, wait for the Moon to set and head towards Hercules for a high power view of a 9th magnitude planetary nebula – NGC 6210. This small disk won’t be easy to separate from neighboring stars without magnification. To find NGC 6210, locate Beta and Gamma Herculis. Draw an imaginary line between them and extend it around the same distance to the northeast. Around 6500 light-years away, NGC 6510 is one of the most active planetary nebulae. Hubble Space Telescope (HST) images show powerful hot jets of turbulent gas burrowing through an outer shell of cool gas.

Thursday, June 1 – Tonight let’s look on the lunar surface at the junction of Mare Fecunditatis and the edge of Mare Tranquillitatis. Here stands ancient Taruntius. Like a lighthouse guarding the shores, it stands on a mountainous peninsula overlooking the mare. Tonight it appears as a bright ring, but watch in the days ahead as this “lighthouse” shoots its brilliant beams across the desolate landscape nearly 175 kilometers.

To see another brilliant lighthouse, let’s head towards northern Hercules for a look at “the other Hercules Cluster” – M92. Discovered on December 27, 1777 by J. E. Bode, magnitude 6.5 M92 radiates with roughly half the brilliance of the Great Hercules Cluster – and this holds true intrinsically as well. About 900 light-years more distant than its famous neighbor, M13, the smaller M92 is still only 5,000 light-years away – “next door.”

M92 gives a splendid, well-resolved view in even small scopes. It dissolves into dozens of fainter members arrayed around a nebulous core radiating the combined light of over 150,000 suns. Like all globulars, higher magnification must be used to add contrast and reveal some of its brighter stellar components – especially near the core where this celestial “lighthouse” really gathers them in!

Friday, June 2 – For SkyWatchers tonight, have a look as Regulus is quite near Luna.

For telescope users, the Moon gives a wonderful opportunity to revisit ancient crater Posidonius. Its 84 kilometer by 98 kilometer expanse is easily seen in the most modest of optical instruments and it offers a wealth of details with its eroded walls and 1768 meter (5800 ft.) central peak. Look for a central crater attended by a fine curve of challenging mountain peaks to its east.

Continue southward from Posidonius along the edge of Mare Serenitatis to catch partially open crater Le Monnier. This ruined ring contains the remains of the Luna 21 mission – forever awaiting salvage in the grey sands along Le Monnier’s southern edge.

Even though skies are fairly bright, we can still get an impression of a very distant third globular cluster in Hercules. This one is small and faint – but with reason. NGC 6229 is almost 100,000 light-years away! If it were transported to the distance of M13 or M92 it would shine as bright as the latter and eclipse both in apparent size!

Due to great distance, the brightest stars associated with NGC 6229 are only within reach of large telescopes. This may explain why William Herschel interpreted the faint and slightly condensed glow of NGC 6229 as a planetary nebula when he discovered it May 12, 1787. The surprise of three globulars within the confines of Hercules may also explain why the globular cluster was mistaken as a comet discovery in 1819! Its stellar nature was only first resolved in the mid 1800s by the discoverer of Neptune – Louis d’Arrest.

Despite the Moon, larger scopes can find NGC 6229 between the stars 52 and 42 Hercules, a fist width north of Eta – the northeastern star of the Hercules Keystone.

Saturday, June 3 – If you’re up early, why not keep watch for the peak of the Tau Herculids meteor shower? With a radiant near Corona Borealis, the Earth will encounter this stream for about a month. Sharp-eyed observers can expect about 15 faint streaks per hour at its maximum.

Although it’s furthest from the Earth right now, did you see Selene during daylight today? Spectacular, isn’t it. Have you ever wondered if there was any place on the lunar surface that has never seen the light?

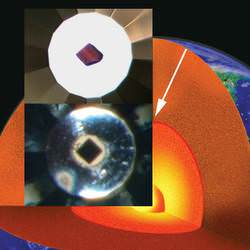
Directly in the center of the Moon is a dark floored area known as the Sinus Medii. South of that are two conspicuously large craters – Hipparchus to the north and ancient Albategnius to the south. Trace the terminator toward the south until you almost reach its point (cusp.) There you will see a black oval. This normal looking crater with brilliant west wall is ancient crater Curtius. Because of its high latitude, we never see its interior – and neither does the Sun! It is believed that the inner walls are quite steep. Because of this, Curtius’ deep interior hasn’t seen the light of day since its formation billions of years ago! Locked in perpetual darkness, scientists speculate there may be “lunar ice” inside its many cracks and crevasses crevices.

Because our Moon has no atmosphere, the entire surface is exposed to the vacuum of space. When sunlit, the surface reaches up to 385 K. Any exposed ice would immediately evaporate and be lost because the Moon’s weak gravity cannot hold it. Frozen matter can only exist on the moon within permanently shadowed areas. Curtius lies near the Moon’s south pole. Imaging has shown some 15,000 square kilometers where similar conditions could exist. But where does the “ice” come from? The lunar surface never ceases to be pelted by meteorites – most of which contain water. Many craters are formed by just such impacts. Hidden from sunlight, this frozen material can exist for millions of years!

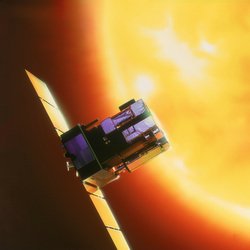
Sunday, June 4 – How about a little lunar “prospecting?” Then let’s explore the northern equivalent to Curtius. Start by locating previous study crater Plato. North of Plato lies a long horizontal area of gray floor – Mare Frigoris. North of Frigoris you will see a “double crater.” This is the elongated diamond shape of Goldschmidt. Cutting across its western border is Anaxagoras. The lunar north pole isn’t far from Goldschmidt, and since Anaxagoras lies about one degree outside of the Moon’s theoretical “arctic” area, the lunar sun will never go high enough to clear the southernmost rim. Such “permanent darkness” must mean there’s ice! And for that very reason, NASA’s Lunar Prospector probe was sent to explore. Did it find what it was looking for? The answer is yes.

The probe discovered vast quantities of cometary ice secreted inside the crater’s depths. What’s the significance? Water is essential to life and its presence influences any plans to establish a base on the lunar surface. Will the sun ever shine on such a base? Quite probably. But down below, in the crater’s depths it never has, and never will…

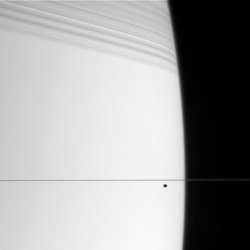
Tonight let’s look at another distant world as we take another look at Jupiter. You don’t have to wait for the sky to actually get dark to view Jupiter. At magnitude -2.4, Jupiter can easily be found a half-hour after sunset. It won’t be long before it’s gone so enjoy those “Bands on the Run” while they last!

May all your journeys be at light speed… ~Tammy Plotner with Jeff Barbour.

Online Global Map of Forest Fires

Global map of forest fires. Image credit: ESA. Click to enlarge
ESA satellites have been keeping track of global forest fires for more than 10 years, and now this data is available online through ESA’s ATSR World Fire Atlas. More than 50 million hectares (123 million acres) of forests burn every year, and these fires make a signficant contribution to global pollution. By monitoring these fires, researchers can improve computer models to predict which regions are at greatest risk based on weather patterns.

For a decade now, ESA satellites have been continuously surveying fires burning across the Earth’s surface. Worldwide fire maps based on this data are now available to users online in near-real time through ESA’s ATSR World Fire Atlas.

The ATSR World Fire Atlas (WFA) – the first multi-year global fire atlas ever developed – provides data approximately six hours after acquisition and represents an important scientific resource because fire is a major agent of environmental change.

“The atlas is an excellent resource that provides a glimpse of the world that was not previously possible, and which is certain to allow ecologists to address both new and old questions regarding the role of fire in structuring the natural world,” Matt Fitzpatrick of the University of Tennessee’s Department of Ecology & Evolutionary Biology said.

More than 50 million hectares of forest are burnt annually, and these fires have a significant impact on global atmospheric pollution, with biomass burning contributing to the global budgets of greenhouse gases, like carbon dioxide. In the past decade researchers have realised the importance of monitoring this cycle. In fact, WFA data are currently being accessed mostly for atmospheric studies.

Quantifying fire is important for the ongoing study of climate change. The 1998 El Niño, for example, helped encourage fires across Borneo which emitted up to 2.5 billion tonnes of carbon into the atmosphere, equivalent to Europe’s entire carbon emissions that year.

There are over 200 registered users accessing the WFA. The data are being used in Europe, Asia, North America, South America, Africa and Australia for research in atmospheric chemistry, land use change, global change ecology, fire prevention and management and meteorology.

Harvard University, University of Toronto, National Centre for Atmosphere and NASA, among others, have used the data in research publications. To date, there are more than 100 scientific publications based on WFA data.

In addition to maps, the time, date, longitude and latitude of the hot spots are provided. The database covers 1995 to present, but complete yearly coverage begins from 1997.

The WFA data are based on results from the Along Track Scanning Radiometer (ATSR) on ESA’s ERS-2 satellite, launched in 1995, and the Advanced Along Track Scanning Radiometer (AATSR) on ESA’s Envisat satellite, launched in 2002.

These twin radiometer sensors work like thermometers in the sky, measuring thermal infrared radiation to take the temperature of Earth’s land surfaces. Fires are detected best during local night, when the surrounding land is cooler.

Temperatures exceeding 312º K (38.85 ºC) are classed as burning fires by ATSR/AATSR, which are capable of detecting fires as small as gas flares from industrial sites because of their high temperature.

The WFA is an internal and Data User Programme (DUP) project.

Original Source: ESA News Release

SOHO Mission Extended Through 2009

Artist illustration of SOHO and the Sun. Image credit: ESA. Click to enlarge
NASA and ESA’s long-running Solar and Heliospheric Observatory (SOHO) has been given another mission extension, this time until December 2009. The spacecraft was launched on December 2, 1995, and it has been steadily observing the Sun ever since. Over the next two years, five additional spacecraft will join SOHO to observe the Sun. ESA is involved in two of these spacecraft: Solar B, and Proba-2. NASA will launch the STEREO pair of spacecraft, as well as the Solar Dynamics Orbiter in 2008.

New funding, to extend the mission of ESA’s venerable solar watchdog SOHO, will ensure it plays a leading part in the fleet of solar spacecraft scheduled to be launched over the next few years.

Since its launch on 2 December 1995, The Solar and Heliospheric Observatory (SOHO) has provided an unprecedented view of the Sun – and not just the side facing the Earth. Two teams have now developed techniques for using SOHO to recreate the conditions on the far side of the Sun. The new funding will allow its mission to be extended from April 2007 to December 2009.

Despite being over ten years old now, SOHO just keeps on working, monitoring the activity on the Sun and allowing scientists to see inside the Sun by recording the seismic waves that ripple across the surface of our nearest star.

More than 2300 scientists have used data from the solar observatory to forward their research, publishing over 2400 scientific papers in peer-reviewed journals. During the last two years, at least one SOHO paper has been accepted for publication every working day.

“This mission extension will allow SOHO to cement its position as the most important spacecraft in the history of solar physics,” says Bernhard Fleck, SOHO’s project scientist, “There is a lot of valuable work for this spacecraft still to do.”

During the next two years, five new solar spacecraft will join SOHO in orbit. ESA is involved in two of these spacecraft. The Japan Aerospace Exploration Agency (ISAS/JAXA) has built Solar B and will launch it later this year. ESA will supply the use of a ground station at Svalbard, Norway in exchange for access to the data.

Next year, ESA will launch Proba-2, a technology demonstration satellite that carries solar instruments. In particular, it will carry a complementary instrument to SOHO’s EIT camera. Whilst EIT concentrates on the origin and early development of solar eruptions, Proba-2’s camera will be able to track them into space.

NASA plans to launch the STEREO pair of spacecraft later this year, and the Solar Dynamics Orbiter in 2008. Far from making SOHO obsolete, these newer solar satellites embrace it as a crucial member of the team. SOHO will provide a critical third point of view to assist the analysis of STEREO’s observations. Also, SOHO’s coronagraph will remain unique. The instrument is capable of blotting out the glare from the Sun so that the tenuous outer atmosphere of the Sun is visible for study.

“By next year, we will have a fleet of spacecraft studying the Sun,” says Hermann Opgenoorth, Head of Solar System Missions Division at ESA. This will advance the International Living With a Star programme (ILWS), an international collaboration of scientists dedicated to a long-term study of the Sun and its effects on Earth and the other solar system planets.

ILWS will possibly culminate in the launch of the advanced ESA satellite, Solar Orbiter, around 2015. It is designed to travel close to the Sun, to gain a close-up look at the powerful processes at the heart of our Solar System.

Original Source: ESA News Release

Infrared Sensor Could Be Useful on Earth Too

Infrared image of a NASA researcher. Image credit: NASA. Click to enlarge
The development of infrared detectors has been a boon to astronomy. Many objects in the Universe only reveal themselves when seen in the infrared spectrum; like planets forming within clouds of dust. NASA has developed an inexpensive alternative to previous infrared detectors, which could find many uses here on Earth. The detector is called a Quantum Well Infrared Photodetector (QWIP) array, and it could quickly spot forest fires, detect gas leaks, and have many other commercial uses.

An inexpensive detector developed by a NASA-led team can now see invisible infrared light in a range of “colors,” or wavelengths.

The detector, called a Quantum Well Infrared Photodetector (QWIP) array, was the world’s largest (one million-pixel) infrared array when the project was announced in March 2003. It was a low-cost alternative to conventional infrared detector technology for a wide range of scientific and commercial applications. However, at the time it could only detect a narrow range of infrared colors, equivalent to making a conventional photograph in just black and white. The new QWIP array is the same size but can now sense infrared over a broad range.

“The ability to see a range of infrared wavelengths is an important advance that will greatly increase the potential uses of the QWIP technology,” said Dr. Murzy Jhabvala of NASA’s Goddard Space Flight Center, Greenbelt, Md., Principal Investigator for the project.

Infrared light is invisible to the human eye, but some types are generated by and perceived as heat. A conventional infrared detector has a number of cells (pixels) that interact with an incoming particle of infrared light (an infrared photon) and convert it to an electric current that can be measured and recorded. They are similar in principle to the detectors that convert visible light in a digital camera. The more pixels that can be placed on a detector of a given size, the greater the resolution, and NASA’s QWIP arrays are a significant advance over earlier 300,000-pixel QWIP arrays, previously the largest available.

NASA’s QWIP detector is a Gallium Arsenide (GaAs) semiconductor chip with over 100 layers of detector material on top. Each layer is extremely thin, ranging from 10 to 700 atoms thick, and the layers are designed to act as quantum wells.

Quantum wells employ the bizarre physics of the microscopic world, called quantum mechanics, to trap electrons, the fundamental particles that carry electric current, so that only light with a specific energy can release them. If light with the correct energy hits one of the quantum wells in the array, the freed electron flows through a separate chip above the array, called the silicon readout, where it is recorded. A computer uses this information to create an image of the infrared source.

NASA’s original QWIP array could detect infrared light with a wavelength between 8.4 and 9.0 micrometers. The new version can see infrared between 8 to 12 micrometers. The advance was possible because quantum wells can be designed to detect light with different energy levels by varying the composition and thickness of the detector material layers.

“The broad response of this array, particularly in the far infrared — 8 to12 micrometers — is crucial for infrared spectroscopy,” said Jhabvala. Spectroscopy is an analysis of the intensity of light at different colors from an object. Unlike a simple photograph that just shows the appearance of an object, spectroscopy is used to gather more detailed information like the object’s chemical composition, speed, and direction of motion. Spectroscopy is used in criminal investigations; for example, to tell if a chemical found on a suspect’s clothing matches that at a crime scene, and it’s how astronomers determine what stars are made of even though there’s no way to take a sample directly, with the stars many trillions of miles away.

Other applications for QWIP arrays are numerous. At NASA Goddard, some of these applications include: studying troposphere and stratosphere temperatures and identifying trace chemicals; tree canopy energy balance measurements; measuring cloud layer emissivities, droplet/particle size, composition and height; SO2 and aerosol emissions from volcanic eruptions; tracking dust particles (from the Sahara Desert, e.g.); CO2 absorption; coastal erosion; ocean/river thermal gradients and pollution; analyzing radiometers and other scientific equipment used in obtaining ground truthing and atmospheric data acquisition; ground based astronomy; and temperature sounding.

The potential commercial applications are quite diverse. The utility of QWIP arrays in medical instrumentation is well documented (OmniCorder, Inc. in N.Y.) and may become one of the most significant QWIP technology drivers. The success of OmniCorder Technologies use of 256 x 256 narrow band QWIP arrays for aiding in the detection of malignant tumors is quite remarkable.

Other potential commercial applications for QWIP arrays include: location of forest fires and residual warm spots; location of unwanted vegetation encroachment; monitoring crop health; monitoring food processing contamination, ripeness, and spoilage; locating power line transformer failures in remote areas; monitoring effluents from industrial operations such as paper mills, mining sites, and power plants; infrared microscopy; searching for a wide variety of thermal leaks, and locating new sources of spring water.

The QWIP arrays are relatively inexpensive because they can be fabricated using standard semiconductor technology that produces the silicon chips used in computers everywhere. They can also be made very large, because GaAs can be grown in large ingots, just like silicon.

The development effort was led by the Instrument Systems and Technology Center at NASA Goddard. The Army Research Laboratory (ARL), Adelphi, Md., was instrumental in the theory, design, and fabrication of the QWIP array, and L3/Cincinnati Electronics of Mason, Ohio, provided the silicon readout and hybridization. This work was conceived for, and funded by, the Earth Science Technology Office as an Advanced Component Technology development project.

Original Source: NASA News Release

Janus and Saturn

Janus in front of Saturn. Image credit: NASA/JPL/SSI. Click to enlarge
Tiny Janus – only 181 km (113 miles) across – hovers in front of Saturn in this photograph taken by Cassini. The giant planet’s rings are seen nearly edge-on, and cast large shadows against the northern hemisphere. Cassini took this photo on April 21 when it was approximately 2.9 million kilometers (1.8 million miles) from Saturn.

The small, dark form of Janus cruises along in front of bright Saturn. The edge-on rings cast dramatic shadows onto the northern hemisphere.

Janus is 181 kilometers (113 miles) across.

The image was taken in visible light with the Cassini spacecraft narrow-angle camera on April 21, 2006, at a distance of approximately 2.9 million kilometers (1.8 million miles) from Saturn. The image scale is 17 kilometers (11 miles) per pixel on Janus.

The Cassini-Huygens mission is a cooperative project of NASA, the European Space Agency and the Italian Space Agency. The Jet Propulsion Laboratory, a division of the California Institute of Technology in Pasadena, manages the mission for NASA’s Science Mission Directorate, Washington, D.C. The Cassini orbiter and its two onboard cameras were designed, developed and assembled at JPL. The imaging operations center is based at the Space Science Institute in Boulder, Colo.

For more information about the Cassini-Huygens mission visithttp://saturn.jpl.nasa.gov . The Cassini imaging team homepage is at http://ciclops.org .

Original Source: NASA/JPL/SSI News Release

Discovery Prepares for Launch

Discovery at the launch pad. Image credit: NASA. Click to enlarge
After another long delay, NASA’s space shuttle fleet is nearly ready to get flying again. Discovery rolled out to the launch pad on Friday to prepare for its upcoming launch, returning the fleet to service, and continuing the construction of the International Space Station. Discovery’s launch window opens up on July 1, and extends until July 19. If all goes well, the shuttle will spend 12 days in space, testing new hardware and safety techniques, and delivering supplies to the station.

The Space Shuttle Discovery stands at its launch pad at NASA’s Kennedy Space Center, Fla. The shuttle arrived at 8:30 p.m. EDT Friday on top of a giant vehicle known as the crawler transporter.

“Rollout of Space Shuttle Discovery signifies the last major processing milestone in preparation for our next mission, STS-121,” said Space Shuttle Program Manager Wayne Hale. “The entire team has worked tremendously hard to ensure we were prepared to move to the pad, and we are excited to continue moving toward a July launch.”

The crawler transporter began carrying Discovery out of Kennedy’s Vehicle Assembly Building at 12:45 p.m. Friday. The crawler’s maximum speed during the 4.2-mile journey was less than 1 mph.

While at the pad, the shuttle will undergo final testing and hardware integration prior to launch, as well as a “hot fire” test of the auxiliary power units to ensure they are properly functioning. The rotating service structure then will be moved back around the vehicle to protect it from potential damage and the elements.

Discovery’s launch to the International Space Station is targeted for July 1, with a launch window that extends until July 19. During the 12-day mission, Discovery’s crew will test new hardware and techniques to improve shuttle safety, as well as deliver supplies and make repairs to the station.

Another upcoming milestone is the terminal countdown demonstration test, set for June 12 through 15. This countdown dress rehearsal provides each shuttle crew with the opportunity to participate in various simulated countdown activities, including equipment familiarization and emergency evacuation training.

Audio clips of additional comments from Wayne Hale are available at:
http://www.nasa.gov/formedia

For information about the STS-121 mission and its crew, visit:
http://www.nasa.gov/shuttle

Original Source: NASA News Release

Prospecting the Moon and Mars for Supplies

Artist illustration of a robotic ice miner. Image credit: NASA/John Frassanito & Associates. Click to enlarge
NASA’s new vision for space exploration hopes to send humans back to the Moon and then onto Mars over the next decades. The Chief Scientist for NASA’s Mars Program, David Beaty, has spent more than 20 years searching the Earth for metals and oil, and this makes the right man to help future astronauts survive off-Earth. Astronauts will become more like prospectors, searching the Moon and Mars for reserves of water to make air and rocket fuel. The more they can live off the land, the less they have to bring from Earth.

Long before David Beaty became associate Chief Scientist for NASA’s Mars Program, he was a prospector. Beaty spent 10 years surveying remote parts of Earth for precious metals and another 12 years hunting for oil.

And this qualifies him to work for NASA? Precisely.

Beaty has the kind of experience NASA needs as the agency prepares to implement the Vision for Space Exploration. “Mining and prospecting are going to be key skills for settlers on the Moon and Mars,” he explains. “We can send them air and water and fuel from Earth, but eventually, they’ll have to learn to live off the land, using local resources to meet their needs.”

On the Moon, for instance, mission planners hope to find water frozen in the dark recesses of polar craters. Water can be split into hydrogen for rocket fuel and oxygen for breathing. Water is also good for drinking and as a bonus it is one of the best known radiation shields. “In many ways,” notes Beaty, “water is key to a sustained human presence.” Ice mining on the Moon could become a big industry.

Beaty has learned a lot from his long career prospecting, exploring and mining on Earth. Now, with an eye on other worlds, he has distilled four pieces of wisdom he calls “Dave’s Postulates” for prospectors working anywhere in the solar system:

Postulate #1: “Wishful thinking is no substitute for scientific evidence.”

“On Earth, banks won’t lend money for less than proven reserves. From a bank’s viewpoint, anything less than proven is not really there. This lesson has been learned the hard way by many a prospector,” he laughs.

For NASA the stakes are higher than profit. The lives of astronauts could hang in the balance. “Proven reserves on the Moon can perhaps be thought of as having enough confidence to risk the lives of astronauts to go after it.”

What does it take to “prove” a reserve?that is, to know with confidence that a resource exists in high enough concentration to be produced?

“That depends on the nature of the deposit,” explains Beaty. “Searching for oil on Earth, you can drill one hole, measure the pressure and calculate how much oil is there. You know that oil probably exists 100 feet away because liquids flow. However, for gold you must drill holes 100 feet apart, and assay the concentration of gold every five feet down each hole. That’s because the solid earth is heterogenous. 100 feet away the rocks may be completely different.”

Deposits on the Moon aren’t so well understood. Is lunar ice widespread or patchy, deep or shallow? Does it even exist? “We don’t know,” says Beaty. “We still have a lot to learn.”

Postulate #2: “You cannot define a reserve without specifying how it can be extracted. If it can’t be mined, it’s of no use.” Enough said.

Postulate #3: “Perfect knowledge is not possible. Exploration costs money, and we can’t afford to buy all the information we want. We have to make choices, deciding what information is critical and what’s not.”

He offers the following hypothetical example:

“Suppose we decide to send a robot with a little drill and an onboard laboratory into Shackleton Crater, a place on the Moon with suspected ice deposits. We’re going to have to think pretty carefully about that lab. Maybe it can contain only two instruments. What are the two things we most need to know?”

“Suppose further that someone on Earth has invented a machine that can extract water from lunar soil. But it only works if the ice is close to the surface and if the ice is not too salty.” The choice is made. “We’d better equip the robot with instruments to measure the saltiness of the ice and its depth in the drill hole.”

Finally, Postulate #4: “Don’t underestimate the potential effects of heterogeneity. All parts of the Moon are not alike, just as all parts of Earth are not alike. So where you land matters.”

Ultimately, says Beaty, if geologists and engineers work together applying these rules as they go, living off the land on alien worlds might not be so hard after all.

Original Source: Science@NASA Article