
How Far are the Planets from the Sun?
What is the Closest Star to Earth?
Why Does Jupiter Have the Great Red Spot?
Why Can’t We Launch Garbage Into Space?
Carnival of Space #52 – The Anniversary Edition
It’s been one whole year since Henry Cate founded the Carnival of Space over at his Homeschooling Blog. Since then, Henry passed the organizational reins over to me, but he was generous enough to host the Carnival again, on the 1-year anniversary of its foundation. And true to form, it’s another monster, with many many space stories for you to enjoy. Thanks to everyone who participated, and thanks to Henry for getting the whole thing going!
Click here to read the Carnival of Space #52
And if you’re interested in looking back, here’s an archive to all the past carnivals of space. If you’ve got a space-related blog, you should really join the carnival. Just email an entry to [email protected], and the next host will link to it. It will help get awareness out there about your writing, help you meet others in the space community – and community is what blogging is all about. And if you really want to help out, let me know if you can be a host, and I’ll schedule you into the calendar.
Finally, if you run a space-related blog, please post a link to the Carnival of Space. Help us get the word out.
Jupiter’s Rings Are ‘Made in the Shade’
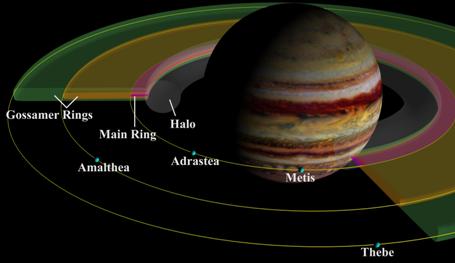
Robotic spacecraft can gather a lot of data, and sometimes it takes years to sort through all the information acquired. Case in point: The Galileo spacecraft orbited Jupiter from 1995-2003. One discovery made by this mission was an anomaly in Jupiter’s rings. For the most part, the rings fall into the standard model of ring formation where the ring particles are shepherded by the orbits of four of Jupiter’s moons; Adrastea, Metis, Amalthea and Thebe (closest to farthest.) But a faint outward protrusion of dust extends beyond the orbit of Thebe, and scientists were mystified why this was occurring.
But a new study of data from the Galileo mission has found that this extension results from the interplay of shadow and sunlight on dust particles that make up the rings.
“It turns out that the outer ring’s extended boundary and other oddities in Jupiter’s rings really are ‘made in the shade,'” said Douglas Hamilton, a professor of astronomy at the University of Maryland. “As they orbit about the planet, dust grains in the rings alternately discharge and charge when they pass through the planet’s shadow. These systematic variations in dust particle electric charges interact with the planet’s powerful magnetic field. As a result small dust particles are pushed beyond the expected ring outer boundary, and very small grains even change their inclination, or orbital orientation, to the planet.”
The Galileo spacecraft was deliberately maneuvered to plunge into Jupiter in 2003 in an effort to protect one of its own discoveries – a possible ocean beneath the icy crust of the moon Europa (scientists didn’t want the spacecraft to one day impact and possibly contaminate Europa.) During this maneuver, the spacecraft dove through the rings and registered thousands of impacts from dust particles with its supersensitive dust detector.
Hamilton and German co-author Harald Krüger studied the impact data on dust grain sizes, speeds, and orbital orientations. Krüger analyzed the new data set and Hamilton created elaborate computer models that matched dust and imaging data on Jupiter’s rings and explained the observed unexpected behavior.
Take a look at Hamilton’s incredible models here.
“Within our model we can explain all essential structures of the dust ring we observed, ” said Krüger.
According to Hamilton, the mechanisms they identified affect the rings of any planet in any solar system, but the effects may not be as evident as it is at Jupiter. “The icy particles in Saturn’s famous rings are too large and heavy to be significantly shaped by this process, which is why similar anomalies are not seen there, ” he said. “Our findings on the effects of shadow may also shed some light on aspects of planetary formation because electrically charged dust particles must somehow combine into larger bodies from which planets and moons are ultimately formed.”
Original News Source: University of Maryland press release
What’s Up – The Weekend SkyWatcher’s Forecast – May 2-4, 2008

Greetings, fellow SkyWatchers! Are you ready for a great dark sky weekend? Then it’s time to walk into the galaxy field of dreams as we take a closer look at part of Markarian’s Chain. Even smaller telescopes and larger binoculars will be happy with this weekend’s globular clusters! Need more or something totally unusual? Then join us as we take a look at a Wolf-Rayet star. Are you ready? Then it’s time to head out under dark skies, because… Here’s what’s up!
Friday, May 2, 2008 – With plenty of dark sky tonight, we’re heading for the galaxy fields of Virgo about four fingerwidths east-southeast of Beta Leonis. As part of Markarian’s Chain, this set of galaxies can all be fitted within the same field of view with a 32mm eyepiece and a 12.5″ scope, but not everyone has the same equipment. Set your sights toward M84 and M86 (RA 12 25 03 Dec +12 53 13) and let’s discover!
Good binoculars and small telescopes reveal this pair with ease as a matched set of ellipticals. Mid-sized telescopes will note the western member of the pair – M84 – is slightly brighter and visibly smaller. To the east and slightly north is larger M86 – whose nucleus is broader, and less intensely brilliant. In a larger scope, we see the galaxies literally leap out of the eyepiece at even the most modest magnifications. Strangely though, additional structure fails to be seen.
As aperture increases, one of the most fascinating features of this area becomes apparent. While studying the bright galactic forms of M84/86 with direct vision, aversion begins to welcome many other mysterious strangers into view. Forming an easy triangle with the two Messiers, and located about 20 arcminutes south lies NGC 4388. At magnitude 11.0, this edge-on spiral has a dim star-like core to mid-sized scopes, but a classic edge-on structure in larger ones.
At magnitude 12, NGC 4387 is located in the center of a triangle formed by the two Messiers and NGC 4388. 4387 is a dim galaxy – hinting at a stellar nucleus to smaller scopes, while larger ones will see a very small face-on spiral with a brighter nucleus. Just a breath north of M86 is an even dimmer patch of nebulosity – NGC 4402 – which needs higher magnification to be detected in smaller scopes. Large apertures at high power reveal a noticeable dustlane. The central structure forms a curved “bar” of light. Luminosity appears evenly distributed end-to-end, while the dustlane cleanly separates the central bulge of the core.
East of M86 are two brighter NGC galaxies – 4435 and 4438. Through average scopes, NGC 4435 is easily picked out at low power with a simple star-like core and wispy, round body structure. NGC 4438 is dim, but even with large apertures elliptical galaxies seem a bit boring. The beauty of NGC 4435 and NGC 4438 is simply their proximity to each other. 4435 shows true elliptical structure, evenly illuminated, with a sense of fading toward the edges… But 4438 is quite a different story! This elliptical is much more elongated. A highly conspicuous wisp of galactic material can be seen stretching back toward the brighter, nearby galaxy pair M84/86. Happy hunting!
Saturday, May 3, 2008 – Tonight let’s use our binoculars and telescopes to hunt down one of the best globular clusters for the northern hemisphere – M3. You will discover this ancient beauty about halfway between the pair of Arcturus and Cor Caroli – just east of Beta Comae (RA 13 42 11 Dec +28 22 31). The more aperture you use, the more stars you will resolve. Discovered by Charles Messier on this day in 1764, this ball of approximately a half million stars is one of the oldest formations in our galaxy. At around 40,000 light-years away, this awesome cluster spans about 220 light-years and is believed to be as much as 10 billion years old. To get a grip on this concept, our own Sun is less than half that age!
Let’s further our understanding of distance and how it affects what we see. As you know, light travels at an amazing speed of about 300,000 kilometers per second. To get a feel for this, how many seconds are there in a minute? An hour? A week? A month? How about a year? Ah, you’re beginning to see the light! For every second – 300,000 kilometers. M3 is 40,000 years away traveling at the speed of light. In terms of kilometers – that’s far more zeros than most of us can possibly understand – yet amazingly we can still see this great globular cluster.
Now let’s locate M53 near Alpha Comae. Aim your binoculars or telescopes there and you will find M53 about a degree northeast (RA 13 12 55 Dec +18 10 09). This very rich, magnitude 8.7 globular cluster is almost identical to M3, but look at what a difference an additional 25,000 light-years can make to how we see it! Binoculars can pick up a small round fuzzy, while larger telescopes will enjoy the compact bright core as well as resolution at the cluster’s outer edges. As a bonus for scopes, look one degree to the southeast for the peculiar round cluster NGC 5053. Classed as a very loose globular, this magnitude 10.5 grouping is one of the least luminous objects of its type, due to its small stellar population and the wide separation between members – yet its distance is almost the same as that of M3.
Sunday, May 4, 2008 – For those who like curiosities, our target for tonight will be 1.4 degrees northwest of 59 Leonis, which is itself about a degree southwest of Xi. While this type of observation may not be for everyone, what we are looking for is a very special star – a red dwarf named Wolf 359 (RA 10 56 28 Dec +07 00 52). Although it is very faint at approximately 13th magnitude, you will find it precisely at the center of the highly accurate half degree field photo below.
Discovered photographically by Max Wolf in 1959, charts from that time period will no longer be accurate because of the star’s large proper motion. It is one of the least luminous stars known, and we probably wouldn’t even know it was there except for the fact that it is the third closest star to our solar system. Located only 7.5 light-years away, this miniature star is about 8% the size of our Sun – making it roughly the size of Jupiter. Oddly enough, it is also a “flare star” – capable of jumping another magnitude brighter at random intervals. It might be faint and difficult to spot in mid-sized scopes, but Wolf 359 is definitely one of the most unusual things you will ever observe!
This week’s awesome image of the Virgo Galaxy Cluster is from the great folks at NOAO/AURA/NSF!
Explore Earth’s Ionosphere with Google Earth
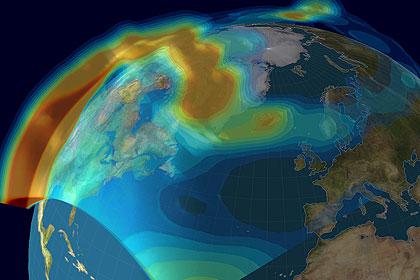
The ionosphere is the final layer of atmosphere before space. This highly dynamic region is constantly exposed to the full intensity of the Sun, harsh ultraviolet radiation breaking down molecules and atoms. Highly charged ions and free electrons therefore fill the ionospheric layers. Critical to terrestrial communications, the ionosphere also plays host to the largest lightshow on Earth, the Aurora. Now NASA-funded research has developed a live “4D Ionosphere” plugin for Google Earth. Now you can fly through the atmosphere’s uppermost reaches without even leaving your desk…
The ionosphere is highly important to us. Radio operators will be acutely aware about how the ionosphere influences radio wave propagation. Ever since Guglielmo Marconi’s experiments with trans-Atlantic radio communications in 1901 between England and the US, the ionosphere has influenced our ability to communicate over large distances, and without the aid of modern satellite technology. The ionosphere creates a charged, reflective barrier that radio waves can be bounced off (bypassing the blocking effect of the curvature of the Earth). However, radio signals are highly influenced by variations in the ionosphere and can be “blacked out” should a major solar storm pump charged particles into the magnetosphere and ionosphere. Even modern Global Positioning Satellite (GPS) signals are influenced by this atmospheric layer, reflecting and attenuating radio waves. As aircraft, ships and other modes of transport now depend on GPS positioning, it is essential that we fully comprehend the physics behind the ionosphere.

In the aim to have a better grasp of the state of the ionosphere, a “live” plugin for Google Earth has just been announced. Funded by NASA’s Living With a Star (LWS) program, it is hoped that this tool can be used by the public and professionals alike to see the current state of the electron content of the ionosphere. Once downloaded and running, the viewer can rotate the globe and see where electron density is high and where it is low. In dense regions, it is very hard for radio waves to propagate, signifying that radio quality will be poor, or blocked all together. In Google Earth, these regions are highlighted in red. The blue regions show “normal” radio propagation regions, expect good quality signal in those locations.
The reason why this new system has been dubbed “4D Ionosphere” is that you can view the ionosphere in three spatial dimensions, and the data is refreshed every ten minutes to give the extra time dimension.
- Download the .kml “4D Ionosphere” Google Earth plugin »
- View video tutorial of how to use “4D Ionosphere” (19MB .mp4 video) »
- Download Google Earth »
This isn’t the first time Google Earth has been used by organizations for space-based research. On February 24th, I reported that a plugin had been released to track the space debris currently orbiting our planet. Nancy also gave the new Google Sky a test drive in March, a great way to learn about astronomy through this user friendly interface.
I can see lots of applications for this tool already. Firstly I’d be very excited to compare the ionosphere during periods of high solar activity with periods when the Sun experiences solar minimum (like now). This would be especially exciting in Polar Regions in the auroral zone when high quantities of solar wind particles ignite aurorae. Also, there are possible applications for amateur radio (ham) operators who could use this as a means to forecast the strength of the radio signal during campaigns. I am however uncertain how accurate or how detailed these measurements will be, but it at least gives a very interesting look into the current state of this interesting region of the atmosphere.
Source: NASA
Composition of Mercury
Mercury is a terrestrial planet, like like all of the 4 inner planets: Mercury, Venus, Earth and Mars. It’s the smallest of them, and has a diameter of only 4,879 km at its equator. What is the composition of Mercury?
Astronomers have estimated that the Mercury composition is made up of approximately 70% metals and 30% silicate material. In fact, it’s only slightly less dense than the Earth, with 5.43 g/cm3.
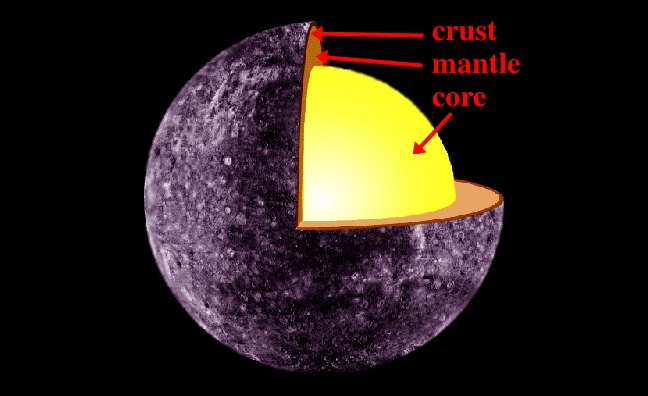
Since Mercury is smaller than Earth, its gravity doesn’t compress it down as much, so it actually has much more heavier elements inside it. Geologists estimate that its core is very large, and mostly iron. The core probably accounts to 42% of Mercury’s volume, while Earth is just 17%.
The core itself is about 3,600 km across. Surrounding that is a 600 km thick mantle. And around that is the crust, which is believed to be 100-200 km thick. The crust is known to have narrow ridges that extend for hundreds of kilometers. Planetary scientists think that the ridges formed when the planet cooled and contracted underneath the crust, causing it to collapse down.
One reason to explain why Mercury has such a large core is that it was impacted by a large planetesimal early in its history. The impact would have stripped away much of the planet’s crust, leaving just the thick iron core. This is a similar process that explains the formation of the Moon. It’s also possible that Mercury formed before the Sun’s energy output settled down. If it had twice its original mass, the Sun could vaporize the surface of the planet, blasting it away with its power solar wind.
We have written many articles about Mercury for Universe Today. Here’s an article about the gravity on Mercury, and here’s an article about the color of Mercury
If you’d like more information on Mercury, check out NASA’s Solar System Exploration Guide, and here’s a link to NASA’s MESSENGER Misson Page.
We’ve also recorded an entire episode of Astronomy Cast all about Mercury. Listen here, Episode 49: Mercury.
Surface of Mercury
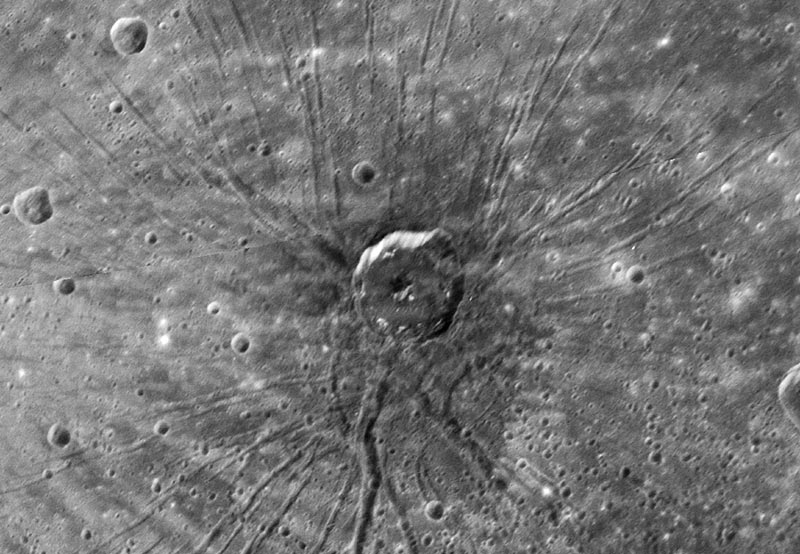
The surface of Mercury is marred by an impressive number of craters. The cratering is deeper than on most terrestrial planets because of its lack of an atmosphere. A thicker atmosphere would have slowed impacting bodies, making the craters more shallow. Less than half of the surface of Mercury was mapped until recent images from MESSENGER were interpreted by NASA.
The surface of Mercury displays some amazing extremes. The temperature may range by an astounding 590 K. While the planet is the closest to the Sun, there are places that are dark enough to contain water ice and there is water in the tenuous exosphere. Additionally, it is the smallest planet by surface area, but it is also one of the most dense. Its core accounts for 42% of the planet’s volume.
The surface of Mercury is believed to be geologically inactive and has been for billions of years. Telescopic observation has shown areas of vastly different reflectivity. This indicates that the surface of Mercury has dorsa(ridges), highlands, montes(mountains), planitiae(plains), rupes(escarpments), and valles(valleys). Mercury was heavily bombarded by asteroids and comets about 3.8 billion years ago during the Late Heavy Bombardment period. During this period the planet received an overwhelming number of impacts over its entire surface. At that time, the planet was volcanically active and basins like the Caloris Basin were filled with magma, produced the smooth plains. Data received from MESSENGER shows a very jumbled, heterogeneous surface.
Mercury’s craters range in diameter. Some are tiny bowl-shaped cavities, while others are multi-ringed basins that are hundreds of kilometers in diameter. They are in various states of degradation: some are relatively young rayed craters, others are barely visible remnants. Similar impacts here on Earth would have left smaller ejecta fields because of the higher gravity levels. Caloris Basin is the largest known crater(remember the entire surface has not been mapped) at 1,550 km. The impact created lava flows and left a ring around the impact zone that is 2 km tall. On the other side of the planet(antipode) there is a large hilly area called the ”Weird Terrain” that may have been pushed out by the shock wave created by the impact on the other side of the planet.
The surface of Mercury is a broken and distorted landscape. Mariner 10 sent us images of about half of the planet and MESSENGER is doing everything that it can to complete the picture, but everything indicates a barren landscape that never had a chance to be anything but desolate.
We have written many articles about Mercury for Universe Today. Here’s an article about the formation of Mercury, and here’s an article about the atmosphere of Mercury.
If you’d like more information on Mercury, check out NASA’s Solar System Exploration Guide, and here’s a link to NASA’s MESSENGER Misson Page.
We’ve also recorded an entire episode of Astronomy Cast all about Mercury. Listen here, Episode 49: Mercury.
References:
NASA StarChild
Wikipedia
NASA Solar System Exploration: MESSENGER
NASA MESSENGER Mission Page
Superficie de Mercurio
Symbol for Pluto
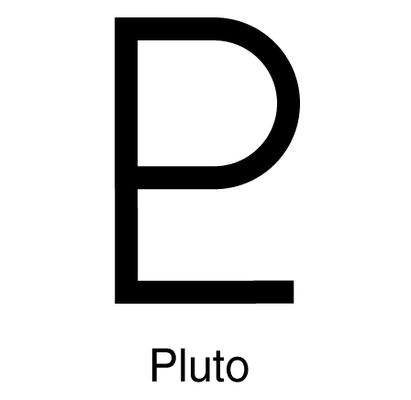
The symbols of the planets, Moon and Sun are used in both astronomy and astrology. The symbol for Pluto is made from a monograph of the first two letters in the word PLuto. It’s also from the initials of the astronomer Percival Lowell, who predicted that the planet would be found through its gravitational influence on Neptune and Uranus. Of course, Pluto is not a planet anymore.
Gaia Hypothesis: Could Earth Really be a Single Organism?
Can a planet like Earth be considered a single living organism? After all, the human body is composed of hundreds of billions of bacteria, and yet we consider the human body to be a single organism. The Gaia Hypothesis (or popularly known as “Gaia Theory”) goes beyond the individual organisms living on Earth, it encompasses all the living and non-living components of Earth’s biosphere and proposes that the complex interacting systems regulate the environment to a very high degree (here’s a biosphere definition). So much so, that the planet may be viewed as a single organism in its own right. What’s more this hypothesis was developed by a NASA scientist who was looking for life on Mars…
When you stop to think about it, our planet does act like a huge organism. If you look at the interrelationship between plants and atmospherics, animals and humans, rocks and water, a complex pattern of symbiotic processes seem to complement each other perfectly. Should one system be pushed out of balance by some external force (such as a massive injection of atmospheric carbon dioxide after a volcanic event), other processes are stimulated to counteract the instability (more phytoplankton appear in the oceans to absorb the carbon dioxide in the water). Many of these processes could be interpreted as a “global immune system”.

The hypothesis that our planet could be a huge organism was the brain child of British scientist Dr James Lovelock. In the 1960’s when Lovelock was working with NASA on methods to detect life on the surface of Mars, his hypothesis came about when trying to explain why Earth has such high levels of carbon dioxide and nitrogen. Lovelock recently defined Gaia as:
“…organisms and their material environment evolve as a single coupled system, from which emerges the sustained self-regulation of climate and chemistry at a habitable state for whatever is the current biota.” – Lovelock J. (2003) The living Earth. Nature 426, 769-770.
So, Lovelock’s work points to interwoven ecological systems that promote the development of life currently living on Earth. Naturally, the statement that Earth itself is actually one living organism encompassing the small-scale mechanisms we experience within our biosphere is a highly controversial one, but there are some experiments and tests that have been carried out to support his theory. Probably the most famous model of the Gaia hypothesis is the development of the “Daisyworld” simulation. Daisyworld is an imaginary planet whose surface is either covered in white daisies, black daisies or nothing at all. This imaginary world orbits a sun, providing the only source of energy for the daisies to grow. Black daisies have a very low albedo (i.e. they do not reflect the sun’s light), thereby getting hot and heating up the atmosphere surrounding them. White daisies have a high albedo, reflecting all the light back out of the atmosphere. The White daisies stay cool and do not contribute to atmospheric warming.
Java applet of the Daisyworld simulation »
When this basic computer simulation runs, a rather complex picture emerges. In the aim of optimizing the growth of daisies on Daisyworld, the populations of white and black daisies fluctuate, regulating the atmospheric temperatures. When the simulation starts, there are huge changes in population and temperature, but the system quickly stabilizes. Should the solar irradiance suddenly change, the white:black daisy ratio compensates to stabilize atmospheric temperatures once more. The simulated Daisyworld plants are self-regulating atmospheric temperature, optimizing their growth.
This is an oversimplified view of might be happening on Earth, but it demonstrates the principal argument that Gaia is a collection of self-regulating systems. Gaia helps to explain why atmospheric gas quantities have remained fairly constant since life formed on Earth. Before life appeared on our planet 2.5 billion years ago, the atmosphere was dominated by carbon dioxide. Life quickly adapted to absorb this atmospheric gas, generating nitrogen (from bacteria) and oxygen (from photosynthesis). Since then, the atmospheric components have been tightly regulated to optimize conditions for the biomass. Could it also explain why the oceans aren’t too salty? Possibly.
This self-regulatory system is not a conscious process; it is simply a collection of feedback loops, all working to optimize life on Earth. The hypothesis also does not interfere with the evolution of species or does it point to a “creator”. In its moderate form, Gaia is a way of looking on the dynamic processes on our planet, providing an insight to how the seemingly disparate physical and biological processes are actually interlinked. As to whether Gaia exists as an organism in it’s own right, it depends on your definition of “organism” (the fact that Gaia cannot reproduce itself is a major drawback for viewing Earth as an organism), but it certainly makes you think…
Original source: Guardian
Spirit’s Dust Dilemma
Steve Squyres and the Mars Exploration Rover team knew from the beginning that dust could cause a problem for the rovers, Spirit and Opportunity. When a thick layer of dust coats the solar panels, it blocks the sunlight that generates power for the six-wheeled robots. In the summer of 2007 a huge dust storm blanketed Mars, and deposited a fair amount of dust on solar panels of both rovers. Spirit, especially accumulated a lot of dust on its solar array. Currently, only about one-third of incoming sunlight is able to penetrate dust on Spirit’s solar panels to be converted to electricity. As a result, Spirit is experiencing the lowest energy levels to date and accumulating a backlog of data waiting to be transmitted to Earth. If only a dust devil would come along!
Spirit’s solar array input has been approximately 240 watt-hours per Martian day, or sol (100 watt-hours is the amount of energy needed to light a 100-watt bulb for one hour). The skies in the area are now clear, which means additional dust shouldn’t be accumulating on the solar panels, and sunlight should be abundant. But clear skies also mean lower temperatures on the surface of Mars, increasing the bitter cold experienced by Spirit’s rover electronics module during the current Mars winter. Nighttime temperatures are creeping closer to the point where they will trigger the survival heaters, which draw a large amount of power.
The rover team has been using the strategy of keeping Spirit awake long enough each day to keep the electronics module sufficiently warm with heat from normal operations, providing more time for science observations. However, recently the team has done less science operations in order to allow Spirit’s batteries to recharge. The engineers are being creative in the trade-offs the team makes each day to keep Spirit going through the Martian winter. Another way they are conserving energy is by restricting the number of sols on which Spirit receives direct-from-Earth instructions via the rover’s high-gain antenna and transmits data to Earth via the Odyssey orbiter.
The MER team is hoping for a dust devil event to come and clear off the solar panels, like these dust devils did back in 2005.

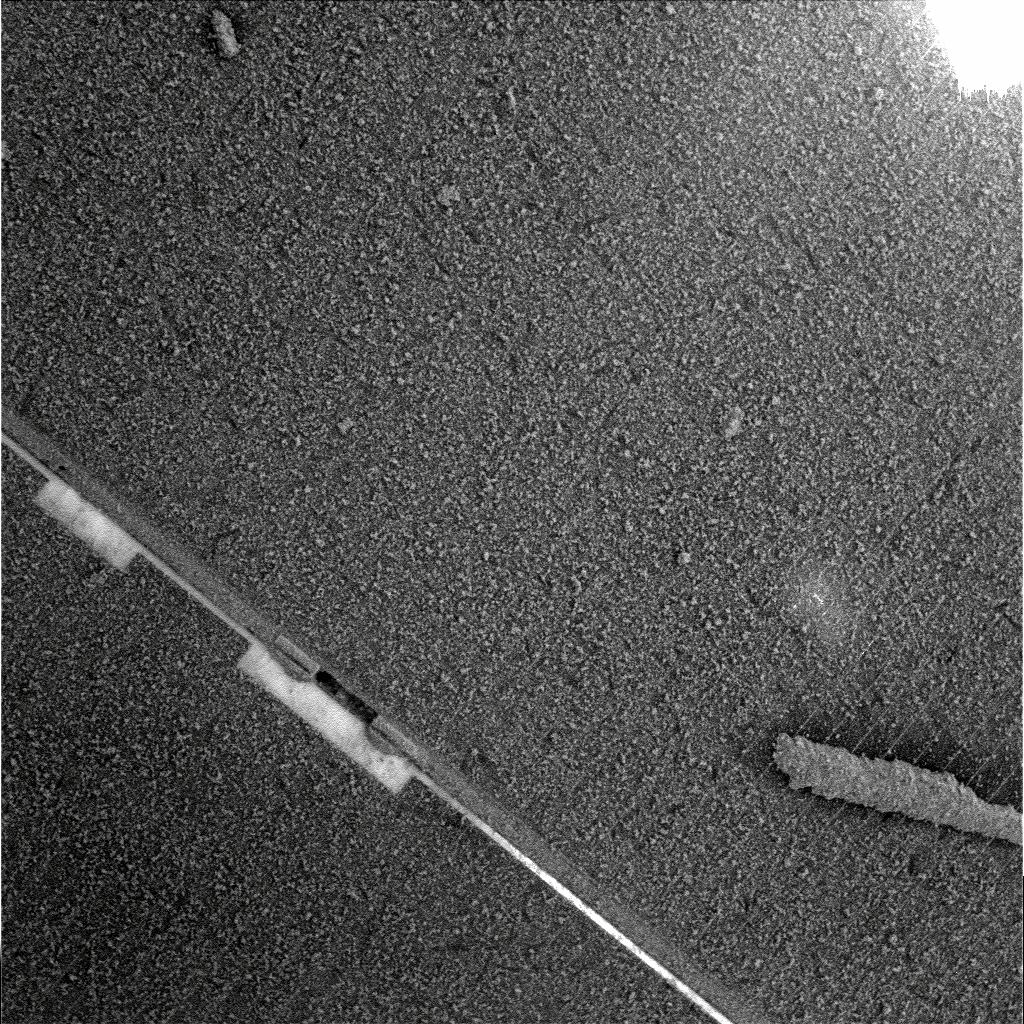
This image shows the difference in the dust accumulation before and after the dust-cleaning event back in 2005.

And this is a self-portrait the rover took of its cleaned solar panels in 2005. Here’s hoping Spirit can be wiped clean again, and the sooner the better.

Original News Source: Mars Rover website