Three “Super-Earths” Found Orbiting One Star

Artist's impression of the trio of super earths. Image credit: ESO

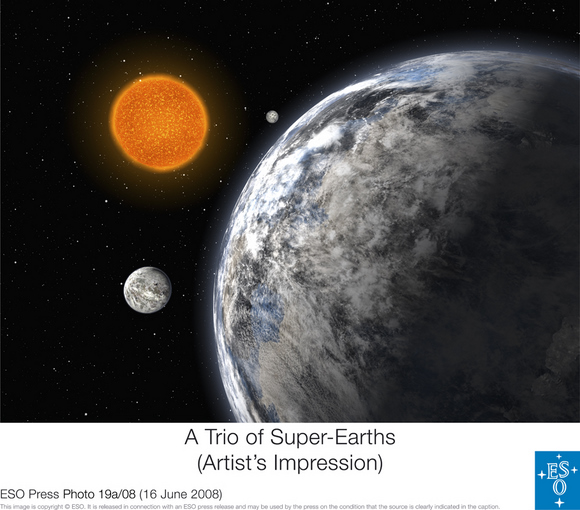
“Does every single star harbor planets and, if yes, how many?” wonders planet hunter Michel Mayor. “We may not yet know the answer but we are making huge progress towards it.” Mayor and his team of European astronomers have found a star which is orbited by at least three planets. Using the High Accuracy Radial velocity Planet Searcher (HARPS) instrument at the ESO La Silla Observatory, they have found a triple system of super-Earths around the star HD 40307. This is the first system known to have at least three “super-Earth” sized planets.

Back in 1995, Mayor, along with Didier Queloz, made the first discovery of an extrasolar planet around 51 Pegasi, and since then more than 270 exoplanets have been found, mostly around sun-like stars.

Most of these planets are giants, such as Jupiter or Saturn, and current statistics show that about 1 out of 14 stars harbors this kind of planet.

“With the advent of much more precise instruments such as the HARPS spectrograph on ESO’s 3.6-m telescope at La Silla, we can now discover smaller planets, with masses between 2 and 10 times the Earth’s mass,” says Stéphane Udry, one of Mayor’s colleagues. Such planets are called super-Earths, as they are more massive than the Earth but less massive than Uranus and Neptune (about 15 Earth masses).

HD 40307 is slightly less massive than our Sun, and is located 42 light-years away towards the southern Doradus and Pictor constellations.

“We have made very precise measurements of the velocity of the star HD 40307 over the last five years, which clearly reveal the presence of three planets,” says Mayor.

The planets, having 4.2, 6.7, and 9.4 times the mass of the Earth, orbit the star with periods of 4.3, 9.6, and 20.4 days, respectively.

The group made the announcement at a conference about extrasolar planets being held in France. The same team also announced the discovery of two other planetary systems, also with the HARPS spectrograph. In one, a super-Earth (7.5 Earth masses) orbits the star HD 181433 in 9.5 days. This star also hosts a Jupiter-like planet with a period close to 3 years. The second system contains a 22 Earth-mass planet having a period of 4 days and a Saturn-like planet with a 3-year period as well.

“Clearly these planets are only the tip of the iceberg,” says Mayor. “The analysis of all the stars studied with HARPS shows that about one third of all solar-like stars have either super-Earth or Neptune-like planets with orbital periods shorter than 50 days.”

A planet in a tight, short-period orbit is indeed easier to find than one in a wide, long-period orbit.
“It is most probable that there are many other planets present: not only super-Earth and Neptune-like planets with longer periods, but also Earth-like planets that we cannot detect yet. Add to it the Jupiter-like planets already known, and you may well arrive at the conclusion that planets are ubiquitous,” concludes Udry.

Calculations from the sample of stars studied with HARPS implies that one solar-like star out of three harbors planets with masses below 30 Earth masses and an orbital period shorter than 50 days.

News Source: ESO press release

Rare Asteroid Studied by Hawaiian Scientists

A huge impact with the asteroid Vista created a lot of debris. Credit :Don Davis)

Asteroid 10537 (1991 RY16) is a rarity. It is composed of basaltic rock (i.e. rock that cooled quickly after formation from a molten state) and appears to have evolved independently from the large asteroid Vesta. Vesta suffered a huge impact billions of years ago, and the debris from this collision litters the inner asteroid belt. These “Vestoids” make up the majority of the basaltic asteroids apart from three known isolated bodies including asteroid 1991 RY16. Scientists are therefore very interested to understand the evolution of 1991 RY16, possibly helping us understand the formation of the Solar System and why there aren’t more basaltic asteroids out there…

The asteroid belt occupies the volume of space roughly between the orbits of Mars and Jupiter. There are thousands of known rocky bodies in the belt, but half of the mass can be found in four major asteroids; Ceres, 4 Vesta, 2 Pallas, and 10 Hygiea. Ceres is actually classified as a minor (or dwarf-) planet as it is over 900km (560 miles) in diameter and is roughly spherical, unlike other asteroids that are irregular in shape. Large asteroid Vesta suffered a huge impact during the formation of the Solar System some 3.5 billion years ago and the debris (about 1% of its total mass) from this collision can be found scattered around the orbit of Vesta (~2.4 AU). These Vestoids usually explain many of the basaltic asteroids in this region of the asteroid belt.

So where does 1991 RY16 come in? Researchers at the Institute for Astronomy (IfA), University of Hawaii, carried out an analysis of the object after a previous study that utilized the Sloan Digital Sky Survey Moving Object Catalog. The IfA astronomers then used optical and near-infrared observations to derive spectroscopic data for 1991 RY16 to see whether it can be related to any of the asteroid groups in the asteroid belt. It turns out that its basaltic surface composition doesn’t appear to match up with any of the large groups of asteroids, and if its orbital radius is worked into the equation, it is highly unlikely that it could have travelled from any of the groups. 1991 RY16 appears to be an asteroid loner… or does it?

Asteroid semi-major axis plotted against inclination - orbital resonances are obvious (Moskovitz et al. 2008)

Firstly, the 5-15 km wide asteroid had to be ruled out from being a more common Vestoid. For a start 1991 RY16 isn’t even a remotely close spectroscopic match to any of the known Vestoids. Its orbit beyond the 3:1 Jupiter orbital resonance (at a distance of 2.5 AU) suggests that it could not have travelled from 2.4 AU, through the resonance and to its present orbit of 2.85 AU. The orbital resonances of the larger planets cause separation in the asteroid belt populations, confining them to their orbits. So, 1991 RY16 doesn’t originate from the Vesta impact event 3.5 billion years ago. Looking at the positions of the known asteroids (chart pictured), the IfA group ruled out the association of 1991 RY16 with any of the neighbouring asteroid groups (such as Gefion and Eos) as there is little spectroscopic evidence and it isn’t possible that the asteroid simply drifted (even after considering the strange Yarkovsky effect that predicts small rocky bodies experience a small deflection in trajectory due to anisotropic emission of thermal photons).

The possible remaining explanation could lie with a large asteroid near the orbital vicinity of 1991 RY16. The spectroscopic analysis of 1991 RY16 reveals that it could be a large chunk from another, differentiated asteroid. Although more analysis is required, 349 Dembowska (of ~140km in diameter) could be the parent asteroid 1991 RY16 was chipped from during an impact in the young Solar System. The IfA researchers are keen to point out that more observations are required to see if there is any other debris from this possible collision matching the surface composition of 1991 RY16.

For more detail into this very interesting research, check out the paper below.

Source: “A Spectroscopically Unique Main Belt Asteroid: 10537 (1991 RY16)” (arXiv pdf)

STS-124: A Mission in Pictures

Always a beautiful sight, the space shuttle Discovery touched down safely at 11:15 a.m. EDT, on Saturday, June 14, 2008, at the Kennedy Space Center in Florida. During the 13-day mission, Discovery and the crew of STS-124 delivered the new component Kibo, the Japanese Experiment Module, to the International Space Station. Mission managers say Discovery looks to be in good shape following the mission, and the crew is doing well, too. Even Garrett Reisman, who spent over 90 days on the ISS, joined the rest of the crew in walking around on the runway and surveying the shuttle. After a successful mission, its always fun to look back at some of the great images, so here’s a few…


Astronaut Ron Garan, STS-124 mission specialist, participates in the mission’s first EVA to get ready to add the Kibo Japanese Pressurized Module to the space station.

That’s two domes and two space helmets. Mark Kelly (right), STS-124 commander, and Garrett Reisman, assist astronauts Mike Fossum (left) and Ron Garan in the Quest Airlock of the International Space Station to help them get ready for an EVA.

A good look at two of the ISS solar arrays, which provide power to the station.

The ISS keeps growing, and with the addition of the Kibo lab, its actually getting pretty spacious on board the station.

The crew of the ISS took this image of the shuttle as it departed from the station, showing the now empty payload bay.

And likewise, the shuttle crew took this image of the ISS, showing the new configuration with Kibo now part of the station.

And here’s where it all started: the launch of Discovery on May 31, 2008.

See all the images from the mission here.

What is the Diameter of Earth?

Our beautiful, precious, life-supporting Earth as seen on July 6, 2015 from a distance of one million miles by a NASA scientific camera aboard the Deep Space Climate Observatory spacecraft. Credits: NASA

For those people who have had the privilege of jet-setting or traveling the globe, its pretty obvious that the world is a pretty big place. When you consider how long it took for human beings to settle every corner of it (~85,000 years, give or take a decade) and how long it took us to explored and map it all out, terms like “small world” cease to have any meaning.

But to complicate matters a little, the diameter of Earth – i.e. how big it is from one end to the other – varies depending on where you are measuring from. Since the Earth is not a perfect sphere, it has a different diameter when measured around the equator than it does when measured from the poles. So what is the Earth’s diameter, measured one way and then the other?

Oblate Spheroid:

Thanks to improvements made in the field of astronomy by the 17th and 18th centuries  – as well as geodesy, a branch of mathematics dealing with the measurement of the Earth – scientists have learned that the Earth is not a perfect sphere. In truth, it is what is known as an “oblate spheroid”, which is a sphere that experiences flattening at the poles.

Data from the Earth2014 global relief model, with distances in distance from the geocentre denoted by color. Credit: Geodesy2000

According to the 2004 Working Group of the International Earth Rotation and Reference Systems Service (IERS), Earth experiences a flattening of 0.0033528 at the poles. This flattening is due to Earth’s rotational velocity – a rapid 1,674.4 km/h (1,040.4 mph) – which causes the planet to bulge at the equator.

Equatorial vs Polar Diameter:

Because of this, the diameter of the Earth at the equator is about 43 kilometers (27 mi) larger than the pole-to-pole diameter. As a result, the latest measurements indicate that the Earth has an equatorial diameter of 12,756 km (7926 mi), and a polar diameter of 12713.6 km (7899.86 mi).

In short, objects located along the equator are about 21 km further away from the center of the Earth (geocenter) than objects located at the poles. Naturally, there are some deviations in the local topography where objects located away from the equator are closer or father away from the center of the Earth than others in the same region.

The most notable exceptions are the Mariana Trench – the deepest place on Earth, at 10,911 m (35,797 ft) below local sea level – and Mt. Everest, which is 8,848 meters (29,029 ft) above local sea level. However, these two geological features represent a very minor variation when compared to Earth’s overall shape – 0.17% and 0.14% respectively.

Meanwhile, the highest point on Earth is Mt. Chiborazo. The peak of this mountain reaches an attitude of 6,263.47 meters (20,549.54 ft) above sea level. But because it is located just 1° and 28 minutes south of the equator (at the highest point of the planet’s bulge), it receives a natural boost of about 21 km.

Mean Diameter:

Because of the discrepancy between Earth’s polar and equatorial diameter, astronomers and scientists often employ averages. This is what is known as its “mean diameter”, which in Earth’s case is the sum of its polar and equatorial diameters, which is then divided in half. From this, we get a mean diameter of 12,742 km (7917.5 mi).

The difference in Earth’s diameter has often been important when it comes to planning space launches, the orbits of satellites, and when circumnavigating the globe. Given that it takes less time to pass over the Arctic or Antarctica than it does to swing around the equator, sometimes this is the preferred path.

We have written many interesting articles about the Earth and mountains here at Universe Today. Here’s Planet Earth, The Rotation of the Earth, What is the Highest Point on Earth?, and Mountains: How Are They Formed?

Here’s how the diameter of the Earth was first measured, thousands of years ago. And here’s NASA’s Earth Observatory.

We did an episode of Astronomy Cast just on the Earth. Give it a listen, Episode 51: Earth.

Sources:

Latest Phoenix Images: Ice or Salt?

The Phoenix lander team revealed the latest images from the mission at a press briefing on Friday. This first image shows an area dug by Phoenix’s scoop, which disclosed a bright surface just a few inches down, which may be ice. “There’s still some debate about the bright material,” said Phoenix Principle Investigator Peter Smith. “Not everyone is sure that this is ice. So there’s been some debate on our team, centering around that perhaps there’s a salt layer just under the soil that also would be bright. Everyone does believe there’s ice under the surface, and whether this is ice or not is the question. The other question is, is this thick ice that goes down deep beneath the surface, or is this a thin layer and we’ll be able to scrape through? So being able to scrape with our scoop is a high priority for us.”


This pair of images taken by the Optical Microscope on NASA’s Phoenix Mars Lander offers a side-by-side comparison of an airfall dust sample collected on a substrate exposed during landing (left) and a soil sample scooped up from the surface of the ground beside the lander. In both cases the sample is collected on a silicone substrate, which provides a sticky surface holding sample particles for observation by the microscope.

Similar fine particles at the resolution limit of the microscope are seen in both samples, indicating that the soil has formed from settling of dust.

The microscope took the image on the left during Phoenix’s Sol 9 (June 3, 2008), or the ninth Martian day after landing. It took the image on the right during Sol 17 (June 11, 2008).

The scale bar is 1 millimeter (0.04 inch).


This is the latest color image of Phoenix, its surroundings and the scoop with soil.


While we can’t look inside the Thermal and Evolved Gas Analyzer (TEGA) oven which will “bake” the Martian soil to test the type of gases that are released, we can see that some of the soil has gone into TEGA. “We were finally successful and some of the material has slid down over the screen” said Smith, “sort of like material going over a cheese grater, and some of the material has slid down and filled the oven. We sent the commands for the first operation of TEGA last night, but we don’t have our data back yet, so we can’t report on any results. That will be coming later next week. So this is a very exciting time for us. We find the soil is very clumpy, it’s sticky, it’s an unusual soil not at all like the types of soils we used in our tests, which worked just fine with all the instruments. So we’ve developed another method of collecting samples, which is to tilt the scoop and vibrate it, and so it shakes down a small amount of material onto the instruments.”


And finally, here’s the latest weather report for Mars, on the 17th sol of Phoenix’s stay on Mars.

Sources: Phoenix News, NASA TV

How Long is a Year on Earth?

The eccentricity in Mars' orbit means that it is . Credit: NASA

A year on Earth is obviously 1 year long, since it’s the standard of measurement. But we can break it down further.

A year is 365.24 days. Or 8,765 hours, or 526,000 minutes, or 31.6 million seconds.

The tricky one is the number of days. Because the earth year doesn’t work out to exactly 365 days, we have the leap year. If we didn’t, days in the calendar wouldn’t match up with the position of the Earth in its orbit. Eventually, the months would flip around, and the northern hemisphere would have summer in January, and vice versa.

To fix this, we put on extra days in some years, called leap years. In those leap years, a year lasts 366 days, and not the usual 365. This gets tacked onto the end of February. Normally, February only has 28 days, but in leap years, it has 29 days.

When to you have leap years? It’s actually pretty complicated.

The basic rule is that you have a leap year if you can divide the year by 4. So 2004, 2008, etc. But years divisible by 100 are not leap years. So 1800, 1900 aren’t leap years. Unless they’re divisible by 400. So 1600 and 2000 are leap years. By following this algorithm, you can have an Earth orbit that lasts 365.24 days.

With the current system, it’s not actually perfect. There’s an extra 0.000125 days being accumulated. Over course of 8,000 years, the calendar will lose a single day.

Here’s an article about how astronomers might use cosmic rays to measure time on Earth.

And here is more information on how to calculate leap years from timeanddate.com.

We did an episode of Astronomy Cast just on the Earth. Give it a listen, Episode 51: Earth.

Thinking About Time Before the Big Bang

What happened before the Big Bang? The conventional answer to that question is usually, “There is no such thing as ‘before the Big Bang.'” That’s the event that started it all. But the right answer, says physicist Sean Carroll, is, “We just don’t know.” Carroll, as well as many other physicists and cosmologists have begun to consider the possibility of time before the Big Bang, as well as alternative theories of how our universe came to be. Carroll discussed this type of “speculative research” during a talk at the American Astronomical Society Meeting last week in St. Louis, Missouri.

“This is an interesting time to be a cosmologist,” Carroll said. “We are both blessed and cursed. It’s a golden age, but the problem is that the model we have of the universe makes no sense.”

First, there’s an inventory problem, where 95% of the universe is unaccounted for. Cosmologists seemingly have solved that problem by concocting dark matter and dark energy. But because we have “created” matter to fit the data doesn’t mean we understand the nature of the universe.

Another big surprise about our universe comes from actual data from the WMAP (Wilkinson Microwave Anisotropy Probe) spacecraft which has been studying the Cosmic Microwave Background (CMB) the “echo” of the Big Bang.

“The WMAP snapshot of how the early universe looked shows it to be hot, dense and smooth [low entropy] over a wide region of space,” said Carroll. “We don’t understand why that is the case. That’s an even bigger surprise than the inventory problem. Our universe just doesn’t look natural.” Carroll said states of low-entropy are rare, plus of all the possible initial conditions that could have evolved into a universe like ours, the overwhelming majority have much higher entropy, not lower.

But the single most surprising phenomenon about the universe, said Carroll, is that things change. And it all happens in a consistent direction from past to future, throughout the universe.

“It’s called the arrow of time,” said Carroll. This arrow of time comes from the second law of thermodynamics, which invokes entropy. The law states that invariably, closed systems move from order to disorder over time. This law is fundamental to physics and astronomy.

One of the big questions about the initial conditions of the universe is why did entropy start out so low? “And low entropy near the Big Bang is responsible for everything about the arrow of time” said Carroll. “Life and death, memory, the flow of time.” Events happen in order and can’t be reversed.

“Every time you break an egg or spill a glass of water you’re doing observational cosmology,” Carroll said.

Therefore, in order to answer our questions about the universe and the arrow of time, we might need to consider what happened before the Big Bang.

Carroll insisted these are important issues to think about. “This is not just recreational theology,” he said. “We want a story of the universe that makes sense. When we have things that seem surprising, we look for an underlying mechanism that makes what was a puzzle understandable. The low entropy universe is clue to something and we should work to find it.”

Right now we don’t have a good model of the universe, and current theories don’t answer the questions. Classical general relativity predicts the universe began with a singularity, but it can’t prove anything until after the Big Bang.

Inflation theory, which proposes a period of extremely rapid (exponential) expansion of the universe during its first few moments, is no help, Carroll said. “It just makes the entropy problem worse. Inflation requires a theory of initial conditions.”

There are other models out there, too, but Carroll proposed, and seemed to favor the idea of multi-universes that keep creating “baby” universes. “Our observable universe might not be the whole story,” he said. “If we are part of a bigger multiverse, there is no maximal-entropy equilibrium state and entropy is produced via creation of universes like our own.”

Carroll also discussed new research he and a team of physicists have done, looking at, again, results from WMAP. Carroll and his team say the data shows the universe is “lopsided.”

Measurements from WMAP show that the fluctuations in the microwave background are about 10% stronger on one side of the sky than on the other.

An explanation for this “heavy-on-one-side universe” would be if these fluctuations represented a structure left over from the universe that produced our universe.

Carroll said all of this would be helped by a better understanding of quantum gravity. “Quantum fluctuations can produce new universes. If thermal fluctuation in a quiet space can lead to baby universes, they would have their own entropy and could go on creating universes.”

Granted, — and Carroll stressed this point — any research on these topics is generally considered speculation at this time. “None of this is firmly established stuff,” he said. “I would bet even money that this is wrong. But hopefully I’ll be able to come back in 10 years and tell you that we’ve figured it all out.”

Admittedly, as writer, trying to encapsulate Carroll’s talk and ideas into a short article surely doesn’t do them justice. Check out Carroll’s take on these notions and more at his blog, Cosmic Variance. Also, read a great summary of Carroll’s talk, written by Chris Lintott for the BBC. I’ve been mulling over Carroll’s talk for more than a week now, and contemplating the beginnings of time — and even that there might be time before time — has made for an interesting and captivating week. Whether that time has brought me forward or backward in my understanding remains to be seen!

Wilkins Ice Shelf Continues Break-up, Even During Winter

Satellite images reveal the Wilkins Ice Shelf in Antarctica has experienced further break-up with an area of about 160 square kilometers breaking off during May 30 -31, 2008. ESA’s Envisat satellite captured the event. This is the first ever-documented episode to occur during the Antarctic winter. The animation here, comprised of images acquired by Envisat’s Advanced Synthetic Aperture Radar (ASAR) between May 30 and June 9, highlights the rapidly dwindling strip of ice that is protecting thousands of kilometers of the ice shelf from further break-up.

Wilkins Ice Shelf, a broad plate of floating ice south of South America on the Antarctic Peninsula, is connected to two islands, Charcot and Latady. In February 2008, an area of about 400 square km broke off from the ice shelf, narrowing the connection down to a 6 km strip; this latest event in May has further reduced the strip to just 2.7 km.

According to Dr. Matthias Braun from the Center for Remote Sensing of Land Surfaces, Bonn University, and Dr. Angelika Humbert from the Institute of Geophysics, Münster University, who have been investigating the dynamics of Wilkins Ice Shelf for months, this break-up has not yet finished.

“The remaining plate has an arched fracture at its narrowest position, making it very likely that the connection will break completely in the coming days,” Braun and Humbert said.
Long-term satellite monitoring over Antarctica is important because it provides authoritative evidence of trends and allows scientists to make predictions. Ice shelves on the Antarctic Peninsula are important indicators for on-going climate change because they are sandwiched by extraordinarily raising surface air temperatures and a warming ocean.

The Antarctic Peninsula has experienced extraordinary warming in the past 50 years of 2.5°C, Braun and Humbert explained. In the past 20 years, seven ice shelves along the peninsula have retreated or disintegrated, including the most spectacular break-up of the Larsen B Ice Shelf in 2002, which Envisat captured within days of its launch.

News Source: ESA

Doritos In Space

I’m all for the commercial use of space, but this might be a bit overboard. Back in March of this year, Ian reported on a fund raising scheme to help the United Kingdom’s physics and astronomy money woes. The scheme involved soliciting commercial companies to pay for advertising being beamed into space, supposedly directed towards potential extra terrestrial life. The manufacturer of Doritos snack chips stepped up, donating an undisclosed sum in exchange for transmitting their ad. But the Doritos people decided to turn the advertisement into a contest, and created the Doritos Broadcast Project, which invited the UK public to create a 30 second video clip that could be beamed out to the universe offering a snap shot of life on earth to anyone ‘out there’. According to a poll, 61% of the UK public believe this is just the start of communication with ET life and that we will enter into regular communication with an alien species at some stage in the future. See the winning commercial:

The winning space-ad entitled ‘Tribe’ was voted for by the British public and directed by 25-year-old Matt Bowron. It will officially be entered into the Guinness Book of Records and will be aired on the more conventional medium of television in the UK on Sunday, June 15th.

Does this really offer a “snapshot of life on Earth?” Is this the impression of ourselves we’d like to give to extraterrestrials?

The message is being pulsed out over a six-hour period from high-powered radars at the EISCAT European space station in the Arctic Circle. The University of Leicester has also been involved in the project from its inception.

EISCAT Director, Professor Tony van Eyken who will oversee the transmission said: “The signal is directed at a solar system just 42 light years away from Earth, in the ‘Ursa Major’ or Great Bear Constellation. Its star is very similar to our Sun and hosts a habitable zone that could harbor small life supporting planets similar to ours.”

Peter Charles, Head of the Doritos Broadcast Project said: “We are constantly looking to push the boundaries of advertising and this will go further than any brand has gone before. By broadcasting the winning ad to the Universe, Doritos is delivering a world first and Matt Bowron, the winner, will go down in advertising folklore. We also shouldn’t be too surprised if the first aliens start arriving on planet Earth immediately demanding a bag of Doritos.”

Wow.

Dr Nigel Bannister thinks the idea might stimulate extra public interest. “The idea of transmitting an ad into space is somewhat controversial but still of scientific interest,” he said.

“This could be a test for future very long range communications and it gives us an opportunity to tell the Universe we are here (in case someone out there is listening – like reversal of the SETI programme!).

“There could also be potential commercial interest in enterprises like this. Imagine one day that companies on Earth might wish to advertise to other planetary colonies within our solar system -for example if man ever moves to colonise Mars!”

Source: Space Daily

Crew Sees Object Float Away From Shuttle (Update)

Update: After a quick but thorough analysis of photos and video of the object and the “protuberance” on the shuttle tail fin, NASA officials say neither should pose any problem for the shuttle landing on Saturday. The object floating away was determined to be one of three thermal clips that are inside the rudder speed brake on the tail fin. They are normally fixed to the back end of the rudder, and NASA astronaut Terry Virts said it is common for these clips to be missing following a mission. Image analysts compared previous images of the clips to telephoto images taken by the crew today to determine it was one of the clips. The “protuberance” on the tail fin is considered to be “nominal” or normal, and was just a separation in the tail’s thermal cover that was enhanced by the lighting from the sun at that time, and does not pose a problem.
This morning around 6:30 am EDT, the crew of STS-124 activated the shuttle’s auxiliary power units to test the shuttle’s re-entry systems for Saturday’s scheduled landing. Everything checked out fine, but shortly afterward the crew reported seeing an object floating away from the shuttle. The crew was able to capture video of the object as it tumbled away. “We observed an object depart aft of the starboard wing,” Commander Mark Kelly said. “Looked like, and obviously it’s hard to tell dimensions and size looking out the aft windows, but it looked like it might have been a foot to a foot and a half in width. And we’ve got a pretty reasonable image of it.”

Additionally, the crew also noticed a protuberance on the shuttle’s tail fin, thought to be a small piece of thermal insulation. NASA TV reported that NASA officials are not currently overly concerned about the protuberance, but additional images are being taken by the crew and downloaded for review by experts in Houston.

NASA TV commentator Rob Navias it is not uncommon for objects to become dislodged from the payload bay or for ice from the engine bell to become dislodged after the shuttle has unusual movements, such as when auxiliary power units are activated or tested. However, the object is large enough that further review of the incident is warranted. There is no concern about the object re-contacting the shuttle, but it is being tracked from the ground.

NASA is also studying video plus digital stills of the area on the shuttle’s tail fin, at the intersection of the lower and top sections of the rudder that meet to form the speed brake, used during landing. All the aero surfaces of the rudder and speed brake were tested this morning, with five movements in either direction, and no unusual data was detected. NASA reports that all the landing systems appear to be in good shape to support entry and landing.

The area in question on the tail fin is covered with a reusable thermal protection system and it does have a thermal barrier seal. That seems to be where the slight “bump” as the crew called it, or protuberance is.

This morning Kelly, Pilot Ken Ham and flight engineer Ron Garan are honing in on their piloting skills by conducting a computer simulation of landing the shuttle.

There will be media interviews with the shuttle crew at about 11:50 this morning, where details of the object and protuberance might be discussed. Look for updates here.

News Sources: NASA TV, Spaceflightnow.com