Scientists Detect “Dark Flow:” Matter From Beyond the Visible Universe

Just as unseen dark energy is increasing the rate of expansion of the universe, there’s something else out there causing an unexpected motion in distant galaxy clusters. Scientists believe the cause is the gravitational attraction of matter that lies beyond the observable universe, and they are calling it “Dark Flow,” in the vein of two other cosmological mysteries, dark matter and dark energy. “The clusters show a small but measurable velocity that is independent of the universe’s expansion and does not change as distances increase,” said lead researcher Alexander Kashlinsky at NASA’s Goddard Space Flight Center in Greenbelt, Md. “The distribution of matter in the observed universe cannot account for this motion.”

“We never expected to find anything like this,” he said.

Using NASA’s Wilkinson Microwave Anisotropy Probe’s (WMAP) three-year view of the microwave background and a catalog of clusters, the astronomers detected hundreds of galaxy clusters that appear to be carried along by a mysterious cosmic flow. The bulk cluster motions are traveling at nearly 2 million miles per hour. The clusters are heading toward a 20-degree patch of sky between the constellations of Centaurus and Vela.

Several astronomers teamed up to identify some 700 X-ray clusters that exhibited a subtle spectral shift. This sample includes objects up to 6 billion light-years — or nearly half of the observable universe — away.

They found this motion is constant out to at least a billion light-years. “Because the dark flow already extends so far, it likely extends across the visible universe,” Kashlinsky says.

The finding flies in the face of predictions from standard cosmological models, which describe such motions as decreasing at ever greater distances.

Cosmologists view the microwave background – a flash of light emitted 380,000 years after the big bang – as the universe’s ultimate reference frame. Relative to it, all large-scale motion should show no preferred direction.

Big-bang models that include a feature called inflation offer a possible explanation for the flow. Inflation is a brief hyper-expansion early in the universe’s history. If inflation did occur, then the universe we can see is only a small portion of the whole cosmos.

WMAP data released in 2006 support the idea that our universe experienced inflation. Kashlinsky and his team suggest that their clusters are responding to the gravitational attraction of matter that was pushed far beyond the observable universe by inflation. “This measurement may give us a way to explore the state of the cosmos before inflation occurred,” he says.

The next step is to narrow down uncertainties in the measurements. “We need a more accurate accounting of how the million-degree gas in these galaxy clusters is distributed,” says Atrio-Barandela.

“We’re assembling an even larger and deeper catalog of X-ray clusters to better measure the flow,” Ebeling adds. The researchers also plan to extend their analysis by using the latest WMAP results, released in March.

The result will appear in the October 20 edition of Astrophysical Journal Letters, which is available electronically this week.

Preprint of Dark Flow Paper, results and implications

Preprint of Dark Flow Paper, technical details

Source: NASA

Saturn’s Rings May Be Billions of Years Old

Saturn's rings. Credit: NASA/JPL

Saturn’s enigmatic rings may be much older and also much more massive than previously thought, according to a new study. Because Saturn’s rings look so clean and bright, it was thought the rings were younger than the planet itself, which is estimated to be about 4.5 billion years old. But using data from the Cassini spacecraft’s UVIS (Ultraviolet Imaging Spectrograph) instrument, Principal Investigator Dr. Larry Esposito and his team used computer simulations to study colliding particles in Saturn’s rings and their erosion by meteorites. Their results support the possibility that Saturn’s rings formed billions of years ago, perhaps at the time when giant impacts excavated the great basins on the Moon. The findings also suggest that giant exoplanets may also commonly have rings.

“Both Cassini observations and theoretical calculations can allow the rings of Saturn to be billions of years old. This means we humans are not just lucky to see rings around Saturn. This would lead us to expect massive rings also to surround giant planets circling other stars,” said Esposito.

Also, simulations run by Esposito’s colleagues Glen Stewart and Stuart Robbins from the University of Colorado showed that Saturn’s ring particles clump together, meaning previous estimates of the mass might be too low, perhaps by a factor of 3.

Saturns rings strip.  Credit:  NASA/JPL
Saturns rings strip. Credit: NASA/JPL

Meteorites slowly grind and shatter the particles in the ring. Gradually, a layer of dust and fragments builds up and covers each particle, making each particle more massive while “cleaning up” the rings.

Recycling of ring material extends their lifetime and reduces the darkening that was expected previous to this study if the rings were older.

One problem with this proposal for more massive and ancient rings is that the Pioneer 11 space mission to Saturn in 1979 measured the ring mass indirectly by observing charged particles created by cosmic rays bombarding the rings.

“Those mass estimates were similar to the ones from Voyager star occultations, apparently confirming the previous low mass value. However, we now recognize that the charged particles are double-valued. That means they could arise from either a small or large mass. We now see that the larger mass value could be consistent with the underestimates due to ring clumpiness,” said Esposito.

Source: European Planetary Science Congress

NASA Uses 90 Rubber Ducks to Study Global Warming

Little yellow ducks, the new face of fighing climate change (Wikimedia Commons)

[/caption]NASA scientists have dropped 90 yellow rubber ducks into holes in Greenland’s Jakobshavn glacier in an attempt to understand why glaciers speed up during summer months as they slip into the sea. The ducks, attached to a football-sized probe, have an email address and message prompting anyone who discovers the ducks to contact NASA to reveal where and when the duck was found. There is an undisclosed award for anyone who finds one of these rubber global warming crusaders. The NASA scientists, based at the Jet Propulsion Laboratory (JPL) in California, hope this campaign will shed new light on the melting mechanisms behind Greenland’s fastest moving glacier…

This story brings back memories of when 30,000 rubber ducks were washed off a cargo ship bound for the US from China back in 1992. Since then, these intrepid explorers have travelled on the world’s ocean currents, ending up as far afield as the middle of the Pacific to the coast of England. Although they have lost their yellow colouring after years of high seas and Sun damage, the duck-shaped pieces of plastic have provided scientists with a valuable insight into ocean circulation and are still found on beaches today. They have also become a commodity (changing hands for over £500 or $1000), been the focus of children’s story books and provided data for a computer model called the Ocean Surface Currents Simulation (used to help fisheries and find people lost at sea). So, in the footsteps of their forefathers, these new NASA rubber recruits hope to provide climatologists with information about the current global warming trend and impacts on polar ice.

Alberto Behar, one of the JPL scientists working with the army of rubber ducks explains, “Right now it’s not understood what causes the glaciers themselves to surge in the summer.” The rubber ducks will help to tackle this problem by carrying a probe with them so their progress can be tracked via GPS. The football sized probe will also relay information about the glacier’s innards as the rubber ducks flow with the ice into the sea.

So far, nobody has reported finding a duck or a probe, but Behar is hopeful that a fisherman or hunter might do in the near future. “We haven’t heard back but it may take some time until somebody actually finds it and decides to send us an e-mail that they have found it,” he said. “These are places that are quite remote so there aren’t people walking around.” Let’s hope the promise of a reward will be enough incentive for the finder to make contact with NASA (otherwise we might see them being advertised on eBay for £500 or $1000…).

The Jakobshavn Glacier is famous in its own right. The iceberg that sank the Titanic in 1912 is thought to originate from it and the glacier has a phenomenal ice discharge rate today, responsible for nearly 7% of the ice flowing from Greenland.

Sources: The Sydney Morning Herald, Times Online (from June 28th, 2007)

Solar Cycle 24 Sunspots Finally Say “Hello!”

Now you see them... The sunspot group as observed by SOHO MDI today (NASA/SOHO)

[/caption]
After an extended period of calm for Solar Cycle 24, a cluster of sunspots have appeared on the disk of the Sun. Although we have observed sunspots since the beginning of this new solar cycle (which officially began on January 4th, 2008 with the observation of a high-latitude sunspot pair), this is the first time for many months “new” Cycle 24 sunspots have shown themselves. Before today, the sunspots (including occasional flares and coronal mass ejections) belonged to the previous cycle (Cycle 23). It would appear the spots have evolved into a cluster in a high-latitude location with the magnetic polarity consistent with this new cycle. But does this mean we can expect an increase in solar activity after this pretty dull period of “blank” solar disk observations? Your guess is as good as mine

Overlapping solar cycles are natural occurrences, and extended solar minima are not unexpected, but many predictions of an extended period of solar calm have been put forward since Solar Cycle 24 appeared to shy away after the initial excitement in January. Although the Sun has been surprisingly quiet for several months, we’ve still had sporadic sunspot activity (plus the occasional flare and CME eruption), but none could be attributed to the new Cycle 24 (although I erroneously thought the August sunspot activity was due to Cycle 24, it was in fact due to the overlapping Cycle 23).

A closeup of the Cycle 24 spots. Observed on September 22nd at Selsey, West Sussex, UK (© Pete Lawrence)

So how can we be so sure these new observations are of Cycle 24 spots and not Cycle 23 spots? After quickly glancing at the Solar and Heliospheric Observatory (SOHO) image (top), we can see a cluster of activity at a fairly high latitude. Generally speaking, one would expect sunspots at the beginning of a new cycle to appear at high latitudes. As the 11-year solar cycle progresses, sunspot activity will begin to drift equator-wards, to lower latitudes. “Old” Cycle 23 sunspots have generally appeared near the solar equator, so the sunspots observed today can be attributed to the “new” Cycle 24.

The clincher for identifying these spots as belonging to a new solar cycle is their magnetic polarity. Sunspots often appear in pairs of opposite polarity (i.e. one will be magnetic north, the other will be magnetic south), and this new cluster is consistent with the polarity expected for Cycle 24 sunspots. SOHO uses its Michelson Doppler Imager (MDI) Magnetogram instrument to observe magnetic polarity, and it would appear that the polarity of this sunspot cluster has an opposite magnetic north/south to previous Cycle 23 observations.

So does this mean we might see an increase in solar activity from here on in? Although this is an encouraging observation, the Sun could revert back to its “blank” state as quickly as it revealed these sunspots to SOHO. However, there is also a chance this could herald the beginning of accelerated solar activity, possibly still fulfilling NASA’s 2006 prediction that Solar Cycle 24 will be a “doozy.”

Watch this space

Original source: Space Weather

Opportunity’s Next Adventure: The Big Drive

The Big Drive to Endeavour-crater. Credit: NASA/JPL

[/caption]

Opportunity, the intrepid Mars Exploration Rover, is going to put the pedal to the metal and head out for a crater nearly 12 kilometers (7 miles) away. That would match the distance the rover has traveled since landing in 2004. But the call of the unknown is compelling the rover science team to make the attempt. “We may not get there, but it is scientifically the right direction to go anyway,” said Steve Squyres, principal investigator for the science instruments on Opportunity and its twin rover, Spirit. For an “aging” rover (what age is 4 in rover years?), this might be setting the bar pretty high. But maybe it’s the journey and not the destination.

“This is a bolder, more aggressive objective than we have had before,” said John Callas, the project manager the rovers. “It’s tremendously exciting. It’s new science. It’s the next great challenge for these robotic explorers.”

“This crater is staggeringly large compared to anything we’ve seen before.” The crater, named Endeavour, is 22 kilometers (13.7 miles) across. “I would love to see that view from the rim,” Squyres said. “But even if we never get there, as we move southward we expect to be getting to younger and younger layers of rock on the surface. Also, there are large craters to the south that we think are sources of cobbles that we want to examine out on the plain. Some of the cobbles are samples of layers deeper than Opportunity will ever see, and we expect to find more cobbles as we head toward the south.”

The rover team estimates Opportunity may be able to travel about 110 yards each day it is driven toward the Endeavour crater. Even at that pace, the journey could take two years. But why not go for it, and see how long the rovers can last?

Opportunity's shadow with Victoria Crater in the background.  Credit:  NASA/JPL/ASU
Opportunity's shadow with Victoria Crater in the background. Credit: NASA/JPL/ASU

Opportunity, like Spirit, is well past its expected lifetime on Mars, and might not keep working long enough to reach the crater. However, two new resources not available during the 4-mile drive toward Victoria Crater in 2005 and 2006 are expected to aid in this new trek.

One is imaging from orbit of details smaller than the rover itself, using the High Resolution Imaging Science Experiment (HiRISE) camera on NASA’s Mars Reconnaissance Orbiter, which arrived at the Red Planet in 2006.

“HiRISE allows us to identify drive paths and potential hazards on the scale of the rover along the route,” Callas said. “This is a great example of how different parts of NASA’s Mars Exploration Program reinforce each other.”

Also, Opportunity now has a better “brain” for driving across the the plains of Mars. A new version of flight software uplinked to Opportunity and Spirit in 2006, boosts their ability to autonomously choose routes and avoid hazards such as sand dunes.

During its first year on Mars, Opportunity found geological evidence that the area where it landed had surface and underground water in the distant past. The rover’s explorations since have added information about how that environment changed over time. Finding rock layers above or below the layers already examined adds windows into later or earlier periods of time.

Source: JPL

Anything Under That Rock on Mars? Phoenix to Take a Peek

The rock "Headless." NASA/JPL-Caltech/University of Arizona/ Texas A&M University

[/caption]
Ever wondered what might crawl out from under a rock on Mars? The Phoenix lander is going to attempt to find out today by trying to nudge a rock aside today with its robotic arm to see what might be underneath. Engineers have developed a plan to try moving a rock on the north side of the lander. This rock, roughly the size and shape of a VHS videotape, is called “Headless.” Even though the Phoenix mission has been extended for a second time – the mission is now on through December, the team feels like it’s time to pull out all the stops and do as much work as possible. “We’re getting towards fall in the northern plains of Mars and our sun is dropping lower day by day,” said mission principal investigator Peter Smith on NPR’s Science Friday. “Our days are getting precious.” So, even though Phoenix’s robotic arm was not designed to move rocks, the team wants to give it a shot. “The appeal of studying what’s underneath is so strong we have to give this a try,” said Michael Mellon, a Phoenix science team member at the University of Colorado, Boulder.

“We don’t know whether we can do this until we try,” said Ashitey Trebi Ollennu, a robotics engineer at NASA’s Jet Propulsion Laboratory, Pasadena, Calif. “The idea is to move the rock with minimum disturbance to the surface beneath it. You have to get under it enough to lift it as you push it and it doesn’t just slip off the scoop.”

The lander receives commands for the whole day in the morning, so there’s no way to adjust in mid-move if the rock starts slipping. Phoenix took stereo-pair images of Headless to provide a detailed three-dimensional map of it for planning the arm’s motions. On Saturday, Sept. 20, the arm enlarged a trench close to Headless. Commands sent to Phoenix Sunday evening, Sept. 21, included a sequence of arm motions for today, intended to slide the rock into the trench.

If the technique works, the move would expose enough area for digging into the soil that had been beneath Headless.

Morning frost on Mars.  NASA/JPL-Caltech/University of Arizona/ Texas A&M University
Morning frost on Mars. NASA/JPL-Caltech/University of Arizona/ Texas A&M University

The scientific motive is related to a hard, icy layer found beneath the surface in trenches that the robotic arm has dug near the lander. Excavating down to that hard layer underneath a rock might provide clues about processes affecting the ice.

“The rocks are darker than the material around them, and they hold heat,” Mellon said. “In theory, the ice table should deflect downward under each rock. If we checked and saw this deflection, that would be evidence the ice is probably in equilibrium with the water vapor in the atmosphere.”

An alternative possibility, if the icy layer were found closer to the surface under a rock, could by the rock collecting moisture from the atmosphere, with the moisture becoming part of the icy layer.

Source: JPL

Deep Inside a Giant: Part 2 – Centaurus A by Mike Sidonio

Centaurus A Dustlane - Mike Sidonio

[/caption]

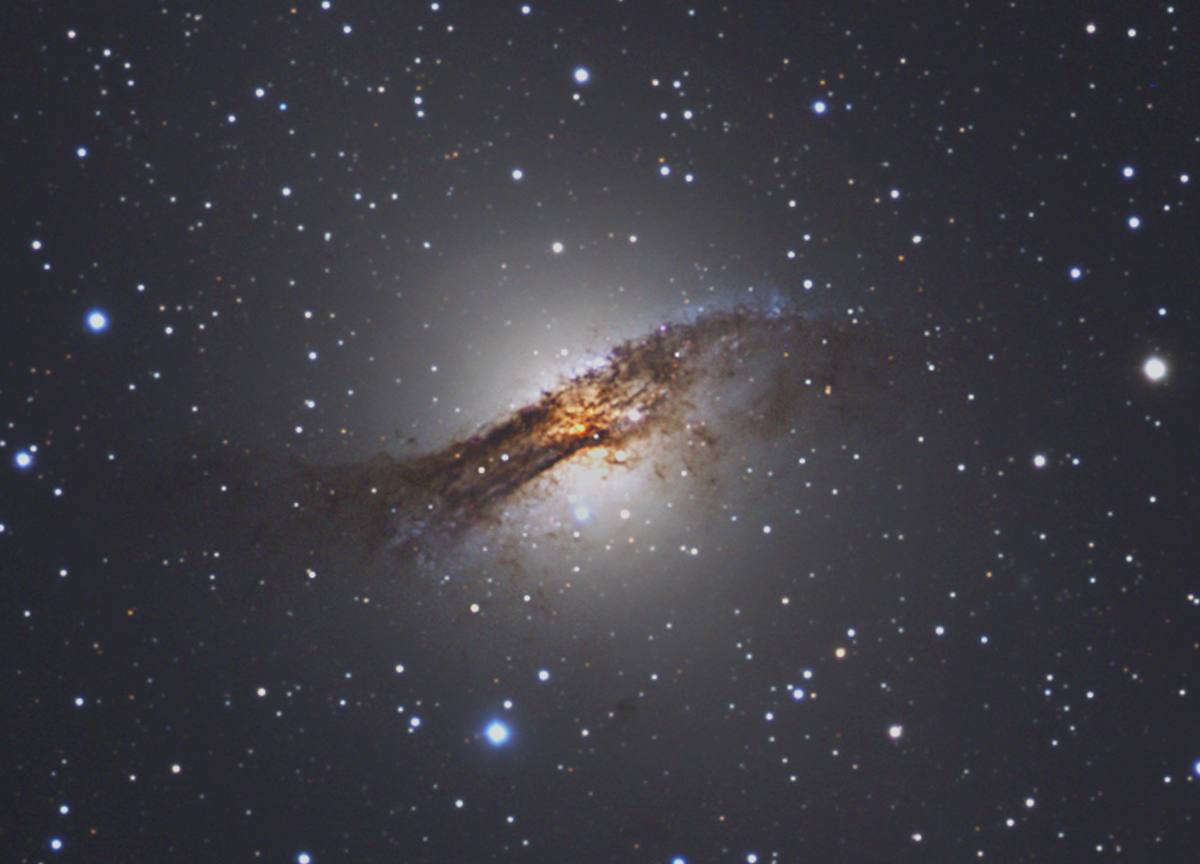
Our first glimpse into the intricacies of Centaurus A was the big picture. We soon found out that not only was the first photograph a deep study, but the study of NGC 5128 was going to go deeper as well. One of the most obvious of all features is the central dust lane which positively crackles to the eye photographically. Let’s be mindful of the radiation and get just a little closer….

In every visual representation of Centaurus A, one of the most dramatic of all features is the central dustlane. To the human eye, the dust is an obstruction – blocking the starlight and what lay beyond. But, to the camera, shifting to redder wavelengths allows us a glimpse at what lay beyond. Through carefully controlled exposures and filtering, red emission from ionized gas at the H-alpha line appears, and blue regions of star formation along the dust lane spring to life – where blue giant stars are being formed. According to 2000 study done by Wild and Eckart; “The interstellar medium of Centaurus A (NGC 5128) has been studied extensively in recent years, using mostly molecular lines tracing low to medium density gas. The amount and distribution of the dense molecular gas was largely unknown. Here we present new millimeter data of the rotational transitions and obtained spectra of the emission which traces dense molecular gas at the center and along the prominent dust lane at offset positions. We find that Centaurus A and the Milky Way are comparable in their line luminosity. However, towards the nucleus the fraction of dense molecular gas measured via the line luminosity ratio, as well as the star formation efficiency, is comparable to ultra-luminous infrared galaxies (ULIRGs). Within the off-nuclear dust lane and for Centaurus A as a whole these quantities are between those of ULIRGs and normal and infrared luminous galaxies. This suggests that most of the FIR luminosity of Centaurus A originates in regions of very dense molecular gas and high star formation efficiency.”

A highly efficient star forming region… Yes, indeed. Those brilliant blue regions you see along the edges are brand new star clusters. Merger induced star formation…

Do you see now why the dustlane in Centaurus A appears to scream? Normally star formation occurs in the dense parts of molecular clouds… collapsing themselves into a ball of plasma to form a star. But, according the work of Martig and Bournaud; “Star formation in galaxies is for a part driven by galaxy mergers. At low redshift, star formation activity is low in high-density environments like groups and clusters, and the star formation activity of galaxies increases with their isolation. This star formation-density relation is observed to be reversed at z~1, which is not explained by theoretical models so far. We study the influence of the tidal field of a galaxy group or cluster on the star formation activity of merging galaxies, using N-body simulations including gas dynamics and star formation. We find that the merger-driven star formation is significantly more active in the vicinity of such cosmological structures compared to mergers in the field. The large-scale tidal field can thus enhance the activity of galaxies in dense cosmic structures, and should be particularly efficient at high redshift before quenching processes take effect in the densest regions.”

But… But, what happens if you have a galaxy that happens to be tidally triggered into star formation and then it just happens to merge with another galaxy at the same time? Aaaaah…. You’re beginning to see the light aren’t you? The galaxy that merged with NGC 5128 was triggered into a burst of star formation, then it combined with Centaurus A and a whole new thing happened. Let’s take a look at the work of Peng and Ford: “Stellar streams in galaxy halos are the natural consequence of a history of merging and accretion. We present evidence for a blue tidal stream of young stars in the nearest giant elliptical galaxy, NGC 5128 (Centaurus A). Using optical UBVR color maps, unsharp masking, and adaptive histogram equalization, we detect a blue arc in the northwest portion of the galaxy that traces a partial ellipse with an apocenter of 8 kpc. We also report the discovery of numerous young star clusters that are associated with the arc. The brightest of these clusters is spectroscopically confirmed, has an age of 350 Myr, and may be a protoglobular cluster. It is likely that this arc, which is distinct from the surrounding shell system and the young jet-related stars in the northeast, is a tidally disrupted stellar stream orbiting the galaxy. Both the age derived from the integrated optical colors of the stream and its dynamical disruption timescale have values of 200-400 Myr. We propose that this stream of young stars was formed when a dwarf irregular galaxy, or similar-sized gas fragment, underwent a tidally triggered burst of star formation as it fell into NGC 5128 and was disrupted 300 Myr ago. The stars and star clusters in this stream will eventually disperse and become part of the main body of NGC 5128, suggesting that the infall of gas-rich dwarfs plays a role in the building of stellar halos and globular cluster systems.”

Needless to say, the developments in Centaurus A are a little shocking, aren’t they? And shocked gas is what it’s all about. Says John Graham; “Observational evidence for shock-induced star formation is found in the northeast radio lobe of the nearby radio galaxy Centaurus A (NGC 5128). A gas cloud, recently detected in H i, is impacted by the adjacent radio jet to the extent that cloud collapse is triggered and loose chains of blue supergiant stars are formed. Diffuse clouds and filaments of ionized gas have been observed near the interface of the H i cloud and the radio jet. These show velocities that cover a range of more than 550 km s−1. Line intensities in their spectra are characteristic of a shock-related origin with strong [N ii] and [S ii] relative to Hα. The [O iii]/Hα line ratio indicates a large range in excitation that is not correlated with velocity. Distinct from this component is a group of four apparently normal H ii regions that are excited by embedded young stars and whose velocities are very close to that of the H i cloud. Star formation will continue for as long as the gas cloud remains close to the radio jet. The loose chains of blue stars in the area are resolved only because NGC 5128 is so close. The reported faint blue extensions and plumes in more distant analogs probably have similar origins.”

So now we have all kinds of things we’ve learned deep inside this giant. Is there anything else we should know before we leave this part and go on? Oh, you know it… A supermassive black hole 200 million times the mass of our own Sun.

Using the infrared vision of Hubble, astronomers can now see a hot gas disk is tilted in a different direction from the orientation of the jet – the indicator of the black hole. It’s believed this may be because the merger is so recent and the disk has not yet aligned to the spin, or the galaxies may still be playing tug of war. According to Ethan Schrier of STSCI, “This black hole is doing its own thing. Aside from receiving fresh fuel from a devoured galaxy, it may be oblivious to the rest of the galaxy and the collision. We have found a complicated situation of a disk within a disk within a disk, all pointing in different directions.” The most astounding part of all is the black hole itself may possible be a merger of two independent black holes! Is this why there is core-dominated radio-loud quasars here as well? As a radio galaxy it releases 1000 times the radio energy of the Milky Way in the form of large bi-directional radio lobes that extend some 800,000 light years into intergalactic space. Well, guess what… There’s theories on that, too.

According, to Saxton, Sutherland and Bicknell, that radio source may just be a plasma bubble: “We model the northern middle radio lobe of Centaurus A (NGC 5128) as a buoyant bubble of plasma deposited by an intermittently active jet. The extent of the rise of the bubble and its morphology imply that the ratio of its density to that of the surrounding ISM is less than 10^{-2}, consistent with our knowledge of extragalactic jets and minimal entrainment into the precursor radio lobe. Using the morphology of the lobe to date the beginning of its rise through the atmosphere of Centaurus A, we conclude that the bubble has been rising for approximately 140Myr. This time scale is consistent with that proposed by Quillen et al. (1993) for the settling of post-merger gas into the presently observed large scale disk in NGC 5128, suggesting a strong connection between the delayed re-establishment of radio emission and the merger of NGC 5128 with a small gas-rich galaxy. This suggests a connection, for radio galaxies in general, between mergers and the delayed onset of radio emission. In our model, the elongated X-ray emission region discovered by Feigelson et al. (1981), part of which coincides with the northern middle lobe, is thermal gas that originates from the ISM below the bubble and that has been uplifted and compressed. The “large-scale jet” appearing in the radio images of Morganti et al. (1999) may be the result of the same pressure gradients that cause the uplift of the thermal gas, acting on much lighter plasma, or may represent a jet that did not turn off completely when the northern middle lobe started to buoyantly rise. We propose that the adjacent emission line knots (the “outer filaments”) and star-forming regions result from the disturbance, in particular the thermal trunk, caused by the bubble moving through the extended atmosphere of NGC 5128.”

And now you know just a little bit more about what’s deep inside a giant…

Many thanks to AORAIA member, Mike “Strongman” Sidonio for the use of this incredible image.

Angle of the Sun

Why Are There Seasons
The angle of the Sun and the Earth's seasons. Image credit: NASA

[/caption]
The amount of the Sun’s energy falling at any point on the Earth depends on the angle of the Sun. This is reason why the seasons have different temperatures, and the polar regions are colder, on average than regions around the equator. Let’s take a look at why the angle of the Sun is so important, and how its change effects the Earth’s climate.

To understand how various parts of the Earth receive less energy, imagine holding a flashlight, and pointing straight at a piece of paper. Light comes out of the flashlight and forms a perfect circle on the paper. At this point, the energy from the flashlight is most concentrated in each square centimeter on the paper. Now imagine angling the paper so that the flashlight’s beam creates a big ellipse on the paper. The same amount of energy is coming out of the flashlight, but it’s being spread out across a much larger area of paper. Each square centimeter of paper is receiving less light than it was before.

Take this analogy to the Earth. When the Sun is directly overhead, like for people in the tropics, the maximum amount of energy is being soaked up by each square meter of Earth. This causes temperatures to rise. For the polar latitudes, the Sun is at a steep angle, so the same amount of energy from the Sun is falling over a much larger area.

During summer in the northern horizon, the Sun is at its maximum angle in the sky, and we get the most energy. But in the winter, the Sun is at a much steeper angle, and so we get less energy from the Sun. And this is why we experience different seasons – it’s all in the angle of the Sun.

Here’s more information from Universe Today about how the Earth has seasons. And Mars has seasons too.

Windows on the Universe has a great description of this. Here’s a handy tool you can use to calculate sunrise and sunset times, as well as the angle of the Sun.

We have recorded an episode of Astronomy Cast just about the Sun called The Sun, Spots and All.

Planetary Scientists Studying Changes in Red Spot Junior

As far as storms go, nothing will rival Jupiter’s Great Red Spot (GRS). But of interest is a smaller and newer storm called Oval BA, a giant anticyclone on Jupiter also known as Red Spot Junior. ‘Smaller’ is a relative term, as although Oval BA is about half the size of GRS, it has a diameter about the size of our Earth. It formed in 2000 as several vortices converged. However, recently Oval BA has undergone some changes. Suddenly it turned from white to red in a period of just a few months, and planetary scientists are trying to understand the processes that could cause the changes. While they are able to explain some of Red Spot Junior’s attributes, they are puzzled by others.

“Our group has made an in-depth analysis of all the aspects regarding the history and evolution of Oval BA,” said Dr. Santiago Pérez-Hoyos, of the Planetary Science Group of the University of the Basque Country in Spain. “The most strongly reddened region was an annulus around its centre. However, when we calibrated images taken with the Hubble Space Telescope, we found that it didn’t actually alter in red or infrared wavelengths during the period. Instead, it became darker in blue and ultraviolet wavelengths, which made it appear visually redder.”

The apparent reddening was first reported by amateur astronomers in early 2006, but it was not until April that professional astronomers were able to image the impressive alteration of the second largest storm in the Solar System after the Great Red Spot (GRS).

Using data from Cassini, the Hubble Space Telescope, NASA’s New Horizons mission and computer models the Planetary Science Group analyzed possible causes for the color change, including alterations to dynamical, photochemical and diffusion processes.

Pérez-Hoyos said, “The most likely cause appears to be an upward and inward diffusion of either a colored compound or a coating vapor that may interact later with high energy solar photons at the upper levels of Oval BA.”

The group were able to rule out that the reddening was caused by any dynamical processes. They found no change to the strength of the “hurricane” and, although some changes in the circulation around the spot had taken place, the maximum wind speeds (which may range up to 400 kilometers per hour or more) were consistent with measurements previous to 2000 of the storms that combined to form Oval BA.

The group modeled the wind flow in detail using high resolution simulations, in order to understand why the red material may be confined to the annulus region and how the color change happened in the observed time scales. The model accounts well for the temperature and wind structure inside the oval BA.

Models also showed that the change could not be attributed to interactions of Oval BA with the GRS, which were relatively close at the time. The flow around both vortices is in the zonal directions and is so strong that separates both storms

The oval height did not change over the period and there were no large changes in the temperature gradient of the oval.

Pérez-Hoyos said, “There is much to be understood about this problem yet. Future spacecraft missions and a continuous observation of the planet (as done by amateur astronomers) will surely give us new clues on the behaviour of Jupiter’s atmosphere that will result in a better understanding of it.”
The team presented their findings at the European Planetary Science Congress in Münster on Monday, 22nd September.

Source: European Planetary Conference

Why is Mars’ Southern Polar Cap Crooked?

Mars Express Data from Mars South Pole. Credits: ESA/ Image Courtesy of F. Altieri (IFSI-INAF) and the OMEGA team

[/caption]
Like Earth, Mars has frozen polar caps, but unlike Earth, these caps are made of carbon dioxide ice as well as water ice. During the southern hemisphere’s summer, much of the ice cap sublimates, or evaporates directly to a gas, but leaves behind what is known as the residual polar cap. The problem is that while the winter cap is symmetrical about the south pole, the residual cap is offset by some three to four degrees. Using data from ESA’s Mars Express spacecraft, scientists say two things are to blame: the Martian weather system, and interestingly, so is the largest impact crater on Mars – even though it is nowhere near the south pole.

Using the Planetary Fourier Spectrometer (PFS) onboard Mars Express, Marco Giuranna of the Istituto di Fisica dello Spazio Interplanetario CNR (IFSI), Rome, Italy, and colleagues have measured the temperature of Mars’ atmosphere from the ground up to an altitude of 50 km above the south polar region.

They charted the way the atmosphere changes in temperature and other characteristics over more than half a Martian year, and monitored the way carbon dioxide builds into the southern ice cap as the autumn turns into winter on Mars. “It is not a straightforward process. We found that two regional weather systems developed from mid-fall through the winter,” says Giuranna.

These weather systems are derived from strong eastward winds that blow straight into the Hellas Basin, the largest impact structure on Mars with a diameter of 2300 km and a depth of 7 km. The crater’s depth and the steep rise of the walls deflect the winds and create what are called Rossby waves on Earth. This creates a low pressure system near the south pole in the western hemisphere and a high-pressure system in the eastern hemisphere, again near the south pole.

Giuranna found that the temperature of the low-pressure system is often below the condensation point for carbon dioxide, so the gas condenses and falls from the sky as snow and builds up on the ground as frost. In the high-pressure system, the conditions are never appropriate for snow, so only ground frost occurs. Thus, the south polar cap is built by two different mechanisms.

The areas that have extensive snow cover do not sublimate in the summer because they reflect more sunlight back into space than the surface frost. Frost grains tend to be larger than snow grains and have rougher surfaces. The ragged texture traps more sunlight, driving the sublimation.

So the western area of the southern polar cap, built of snow and frost, not only has a larger amount of carbon dioxide ice deposited but also sublimates more slowly during the summer, while the western area built of frost disappears completely. This explains why the residual cap is not symmetrically placed around the south pole.

“This has been a martian curiosity for many years,” says Giuranna. Thanks to Mars Express, planetary scientists now understand a new facet of this amazing, alien world.

Source: ESA