
Right now a live webcast, “Around the World in 80 Telescopes” is taking place. This is a live 24-hour webcast, taking place today (Friday) that started with a broadcast from the Gemini North Telescope in Hawaii at 9 am GMT, (night time in Hawaii), moving around the globe for whistle-stop tours of the international observatories while the large telescopes are exploring night skies, observing distant galaxies, searching for extrasolar planets around other stars, or studying our own solar system. Watch below, or here’s the link for watching on UStream. They are experiencing some technical difficulties, but on the whole, this is a great chance to see observatories around the world, and see their observations, as well. Enjoy!
Free video streaming by Ustream
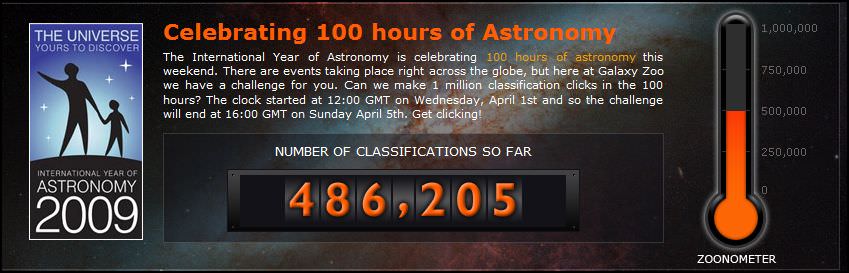
Help Galaxy Zoo Reach Its Goal!
[/caption]
Reminiscent of a telethon or a community fundraiser, Galaxy Zoo has challenged the public to complete one million classification clicks of galaxies from the Sloan Digital Sky Survey during the 100 Hours of Astronomy. The clock started ticking at 12:00 GMT on Wednesday, April 1st, with the challenge ending at 16:00 GMT on Sunday April 5th. The Galaxy Zoo site even includes a thermometer-like gadget called the Zoonometer to provide up-to-the minute ticks on the number of clicks. If you have just returned from a cave on Mars and haven’t heard of Galaxy Zoo, or if you don’t know what the 100 Hours of Astronomy is about, keep reading. Otherwise, head on over to Galaxy Zoo and start clicking!
Galaxy Zoo was launched in July 2007, with a data set of a million galaxies, imaged with a robotic telescope, the Sloan Digital Sky Survey. In order to understand how these galaxies formed, the idea was to get the public to help classify them according to their shapes. The human brain can do this task better than even the fastest computer. With so many galaxies, the team thought that it might take at least two years for visitors to the site to work through them all. Within 24 hours of launch, the site was receiving 70,000 classifications an hour, and more than 50 million classifications were received by the project during its first year, from almost 150,000 people. With the public’s help the Zoo team has published six papers from the findings, and have received viewing time with other, bigger telescopes to clarify the discoveries.
Zoo 2 launched a few months ago, and focuses on the nearest, brightest and most beautiful galaxies, and asks users to make more detailed classifications.
100 Hours of Astronomy is an event of the International Year of Astronomy that wants to get as many people as possible to look through a telescope – just as Galileo did 400 years ago. This four-day event encompasses astronomy clubs, groups, individuals, observatories, science centers and more around the world as they reach out to the public to achieve this common goal. There’s lots of great events, so check out Tammy’s article to find out more, or check out the 100 Hours of Astronomy website – but hurry – you’ve only got until Sunday April 5th to participate!
NASA Looks to Rebalance Aging Workforce

NASA has taken action to rebalance its aging workforce, according to Open NASA, a collaborative blog written by NASA employees. The space agency has adopted a policy to have a goal of 50% of all new civil servants hired to be “fresh-out hires,” or be within three years of receiving their degrees. This move comes from discussions from a strategic management group that focused on the long-term effects of NASA’s past hiring practices and the upcoming gap in US human space flight. This is a somewhat of a big move on NASA’s part, which some say is long overdue.
NASA’s aging workforce has long been a focus of discussion. With over thirty percent of the NASA workforce eligible for retirement, it has been widely recognized that the space agency needs to attract a new generation of workers, but also preserve institutional memory. NASA’s Strategic Management Council (SMC) decided that the risk of a shortfall in critical skills is so great, that dramatic action was needed to change these trends.
Not many people leave NASA in any given year, so the agency doesn’t hire many civil servants in one year. However, the average age of NASA is now 47 and yet the average age of their few new hires is just shy of 40. Only 19% of recent hires have been in their 20’s. “It’s been no wonder that the space business continues to age rapidly,” a member of the SMC wrote.
They continued, “If we get close to the 50% fresh-out hiring goal this year, that’ll probably mean more than doubling the number of new people in their 20’s and early 30’s that we hire.”
A hiring experiment run at MSFC this past year showed that applying this policy NASA-wide means the agency’s average age could actually begin to turn around and start to come back down.
NASA is also looking at a number of other actions:
Exploring the possibility of hiring co-op students at NASA Headquarters;
Promote leadership training and identify high-potential candidates;
Ensure Agency-wide consistency and quality of mentoring programs;
Implement new employee rotation programs;
Expand communication technologies;
Institute a business resource management model that provides employees time for innovation;
Motivate employees, e.g. set aside launch tickets for employees, at all levels, at each center;
Source: Open NASA
Titan (Weirdness) is More Than Meets The Eye
[/caption]
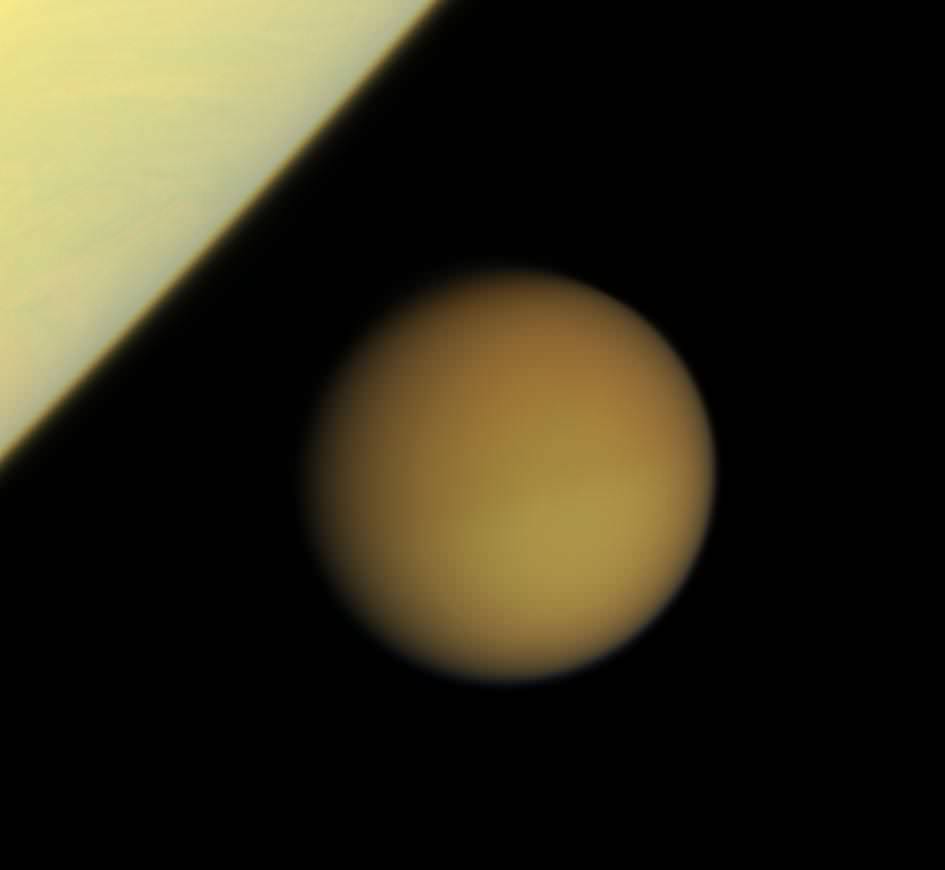
Think Titan looks pretty round?
Not quite, according to new data released today by the Cassini radar team — and slight irregularities in the shape of the bizarre moon may account for the concentration of lakes at the highest latitudes, among other perplexing features.

The radar image above, obtained by Cassini’s radar instrument during a near-polar flyby in 2007, shows a big island smack in the middle of one of the larger lakes imaged on Saturn’s moon Titan. The island is about 90 kilometers (62 miles) by 150 kilometers (93 miles) across, about the size of Kodiak Island in Alaska or the Big Island of Hawaii. The image is centered at about 79 north degrees north (north is left) and 310 degrees west, adding weight to the theory that most of Titan’s lakes occur near the poles.
Titan is an intriguing object partly because its climate cycles are reminiscent of Earth’s, but tend to rely on hydrocarbons like methane and ethane instead of water — which couldn’t exist in a liquid state at temperatures hundreds of degrees below zero. Methane and ethane fill the air with a smoggy haze that rains down as ash. Sometimes it’s washed away by hydrocarbons that flow like gasoline and collect in black lakes with surfaces as smooth as glass.
Cassini has been orbiting Saturn for four years, observing Titan periodically with multiple radar instruments. A research team led by Howard Zebker, a geophysicist at Stanford University, has been using the radar data to estimate the surface elevation. Combined, two instruments — a nadir-pointing radar altimeter and a multiple-beam synthetic aperture radar (SAR) imaging system — measure the time delay of the altimeter echoes and the precise radar beam angles to points on the surface.
“These techniques show that the poles of Titan lie at lower elevations than the equator, and that the topography also varies longitudinally,” the authors report in today’s Science Express..
“If we posit that the lakes are surface expressions of a more or less continuous liquid organic ‘water table,’ then the lower elevations of the poles could lead to the observed preponderance of lakes at high latitudes,” they add. In other words, the lower elevations of poles may make them the only places where any continuous, liquid “water table” would be close enough to the moon’s surface to appear as lakes.
Titan’s overall shape, they suggest, might be that a sphere slightly flattened at the top and bottom. The exact mechanisms behind the oblate shape are unclear. Titan is also elongated toward Saturn, due to the tides raised by Saturn’s gravity.
Source: The paper appears online at the Science Express website. More Titan images are available at the Cassini website.
Where Are All the Sunspots?

[/caption]
There’s not a lot happening on the sun these days, at least in the sunspot department. “We’re experiencing a very deep solar minimum,” says solar physicist Dean Pesnell of NASA’s Goddard Space Flight Center in Greenbelt, Md. In 2008, no sunspots were observed on 266 of the year’s 366 days (73 percent). Sunspot counts for 2009 have dropped even lower, percentage-wise. As of March 31st, there were no sunspots on 78 of the year’s 90 days (87 percent). Those who keep an eye on the sun say this is the quietest sun in almost a century. So, what does this all mean?
Sunspots are planet-sized islands of magnetism on the surface of the sun, and they are sources of solar flares, coronal mass ejections, and intense UV radiation. The sun has a natural cycle of about 11 years of high and low sunspot activity. This was discovered by German astronomer Heinrich Schwabe in the mid-1800s. Plotting sunspot counts, Schwabe saw that peaks of solar activity were always followed by valleys of relative calm—a clockwork pattern that has held true for more than 200 years.
The current solar minimum is part of that pattern. In fact, it’s right on time. But is it supposed to be this quiet?

Measurements by the Ulysses spacecraft reveal a 20 percent drop in solar wind pressure since the mid-1990s—the lowest point since such measurements began in the 1960s. The solar wind helps keep galactic cosmic rays out of the inner solar system. With the solar wind flagging, more cosmic rays penetrate the solar system, resulting in increased health hazards for astronauts. Weaker solar wind also means fewer geomagnetic storms and auroras on Earth.
Careful measurements by several NASA spacecraft have also shown that the sun’s brightness has dimmed by 0.02 percent at visible wavelengths and a whopping 6 percent at extreme UV wavelengths since the solar minimum of 1996. Radio telescopes are recording the dimmest “radio sun” since 1955.
All these lows have sparked a debate about whether the ongoing minimum is extreme or just an overdue correction following a string of unusually intense solar maxima.
“Since the Space Age began in the 1950s, solar activity has been generally high,” said forecaster David Hathaway of NASA’s Marshall Space Flight Center. “Five of the ten most intense solar cycles on record have occurred in the last 50 years. We’re just not used to this kind of deep calm.”
Deep calm was fairly common a hundred years ago. The solar minima of 1901 and 1913, for instance, were even longer than what we’re experiencing now. To match those minima in depth and longevity, the current minimum will have to last at least another year.
In a way, the calm is exciting, says Pesnell. “For the first time in history, we’re getting to observe a deep solar minimum.” A fleet of spacecraft — including the Solar and Heliospheric Observatory (SOHO), the twin probes of the Solar Terrestrial Relations Observatory (STEREO), and several other satellites — are all studying the sun and its effects on Earth. Using technology that didn’t exist 100 years ago, scientists are measuring solar winds, cosmic rays, irradiance and magnetic fields and finding that solar minimum is much more interesting than anyone expected.
Modern technology cannot, however, predict what comes next. Competing models by dozens of solar physicists disagree, sometimes sharply, on when this solar minimum will end and how big the next solar maximum will be. The great uncertainty stems from one simple fact: No one fully understands the underlying physics of the sunspot cycle.
And the only thing scientists can do it to keep watching. Pesnell believes sunspot counts should pick up again soon, “possibly by the end of the year,” to be followed by a solar maximum of below-average intensity in 2012 or 2013.
Source: NASA
Morristown UFO? Hoaxers Tell Their Story
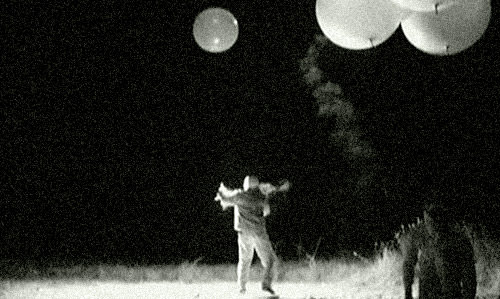
If you follow UFO sightings at all (and even if you don’t) you probably heard about the Morristown, New Jersey UFO’s from earlier this year. Reports of the sightings in January 2009 were covered extensively in newspapers around the country, on CNN, several national talk radio shows, and even was featured in the History Channel’s new show, UFO Hunters. Well, yesterday two New Jersey residents Joe Rudy and Chris Russo revealed something big: its was all a hoax. The two created the entire five-night spectacle by tying flares to helium balloons. Everyone should read their account over at Skeptics.com (and the Bad Astronomer beat me to the punch by posting about it before I could, so read his take on it, too.) Why did they do this? “We set out on a mission to help people think rationally and question the credibility of so-called UFO “professionals,” write Rudy and Russo, “We delivered what every perfect UFO case has: great video and pictures, “credible” eyewitnesses (doctors and pilots), and professional investigators convinced that something amazing was witnessed. Does this bring into question the validity of every other UFO case? We believe it does.”
The article provides links to videos of how they created the hoax, and provides all the extensive media reaction. Most of the media includes quotes from “experts” including a pilot who saw UFO lights. But the two “hoaxers” call into question the validity of so-called UFO investigators and shows like the History Channel’s UFO Hunters, as well as eye-witness accounts even from so-called experts. They make some great points in their article: “This begs an important question: are UFO investigators simply charlatans looking to make a quick buck off human gullibility, or are they alarmists using bad science to back up their biased opinions that extraterrestrial life is routinely visiting our planet? Either way, are these people deserving of their own shows on major cable networks? If a respected UFO investigator can be easily manipulated and dead wrong on one UFO case, is it possible he’s wrong on most (or all) of them? Do the networks buy into this nonsense, or are they in it for the ratings? How can a television network that has pretensions of providing honest and factual programming be taken seriously when the topic of one of their top rated shows deals with chasing flares and fishing line?”
New View of Young, High-Mass Binary Star at Heart of Orion

[/caption]
A new glimpse inside the heart of Orion has confirmed the separation between the binary star system that orbit each other so closely, astronomers once believed they could be a single star.
The research team, led by Stefan Kraus and Gerd Weigelt from the Max-Planck-Institute for Radio Astronomy (MPIfR) in Bonn, Germany, used ESO’s Very Large telescope Interferometer (VLTI) to obtain the sharpest ever image of the young double star Theta 1 Ori C in the Orion Trapezium Cluster.
The binary stars represent the most massive star in the nearest high-mass star-forming region to Earth.
Theta 1 Ori C is the dominant and most luminous star in the Orion star nursery. Located at a distance of only about 1,300 light years, it provides a unique laboratory to study the formation process of high-mass stars in detail. The intense radiation of Theta 1 Ori C is ionizing the whole Orion nebula. With its strong wind, the star pair also shapes the famous Orion proplyds, young stars still surrounded by their protoplanetary dust disks.
Although Theta 1 Ori C appeared to be a single star, both with conventional telescopes and the Hubble Space Telescope, the team discovered the existence of a close companion.

“VLTI interferometry with the AMBER instrument allowed us, for the first time, to obtain an image of this system with the spectacular angular resolution of only 2 milliarcseconds”, says Stefan Kraus. “This corresponds to the resolving power of a space telescope with a mirror diameter of 130 meters.”
The new image clearly separates the two young, massive stars of this system. The observations have a spatial resolution of about 2 milliarcseconds, corresponding to the apparent size of a car on the surface of the Moon.
The VLTI image reveals that in March 2008 the angular distance between the two stars was only about 20 milliarcseconds. Additional position measurements of the binary system have been obtained over the last 12 years using the technique of bispectrum speckle interferometry with 3.6- to 6-meter-class telescopes, allowing high-angular resolution observations even at visual wavelengths down to 440 nm.
The collection of measurements shows that the two massive stars are on a very eccentric orbit with a period of 11 years. Using Kepler’s third law, the masses of the two stars were derived to be 38 and 9 solar masses. Furthermore, the measurements allow a trigonometric determination of the distance to Theta 1 Ori C and, thus, to the very center of the Orion star-forming region.
The resulting distance of 1,350 light-years is in excellent agreement with the work of another research group led by Karl Menten, also from MPIfR, who measured trigonometric parallaxes of the nonthermal radio emission of Orion Nebula stars using the Very Long Baseline Array. These results are important for studies of the Orion region as well as the improvement of theoretical models of high-mass star formation.
The researchers say the results highlight new possibilities of high-resolution stellar imaging achievable with infrared interferometry. The technique allows astronomers to combine the light from several telescopes, forming a huge virtual telescope with a resolving power corresponding to that of a single telescope with 200 meters diameter.
“Our observations demonstrate the fascinating new imaging capabilities of the VLTI,” said Gerd Weigelt. “This infrared interferometry technique will certainly lead to many fundamental new discoveries.”
LEAD IMAGE CAPTION: VLTI/AMBER image of Theta 1 Ori C in the Orion Trapezium Cluster, plus position measurements of the binary system obtained over the last 12 years. Credit: Max Planck Institute/VLTI/AMBER
Sources: Max Planck Institute press release (emailed through Eurekalert), and the original paper.
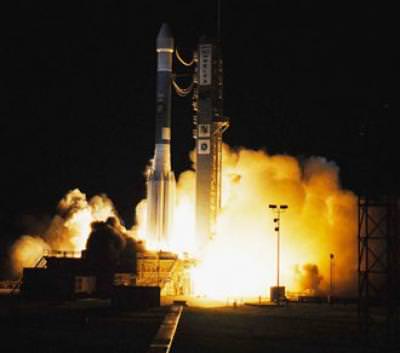
Will Rocket Launches Deplete the Ozone?
[/caption]
A new study predicts that Earth’s stratospheric ozone layer will suffer significant damage from future unregulated rocket launches. The study provides a market analysis for estimating future ozone layer depletion based on the expected growth of the space industry and known impacts of rocket launches. The increase in launches could cause ozone depletion that eventually could exceed ozone losses from CFCs (chlorofluorocarbons) which were banned in the 1980’s. “As the rocket launch market grows, so will ozone-destroying rocket emissions,” said Professor Darin Toohey of CU-Boulder’s atmospheric and oceanic sciences department, a member of the study. “If left unregulated, rocket launches by the year 2050 could result in more ozone destruction than was ever realized by CFCs.” The study says more research should be done on how different rockets affect the ozone before imposing stricter regulations on chemicals used in rocket fuels.
Current global rocket launches deplete the ozone layer by no more than a few hundredths of 1 percent annually, said Toohey. But as the space industry grows and other ozone-depleting chemicals decline in the Earth’s stratosphere, the issue of ozone depletion from rocket launches is expected to move to the forefront.
Rockets around the world use a variety of propellants, including solids, liquids and hybrids. Martin Ross, lead author of the study from The Aerospace Corporation Ross said while little is currently known about how they compare to each other with respect to the ozone loss they cause, new studies are needed to provide the parameters required to guide possible regulation of both commercial and government rocket launches in the future.
Since some proposed space efforts would require frequent launches of large rockets over extended periods, the new study was designed to bring attention to the issue in hopes of sparking additional research, said Ross. “In the policy world, uncertainty often leads to unnecessary regulation,” he said. “We are suggesting this could be avoided with a more robust understanding of how rockets affect the ozone layer.”
“Twenty years may seem like a long way off, but space system development often takes a decade or longer and involves large capital investments,” Ross continued. “We want to reduce the risk that unpredictable and more strict ozone regulations would be a hindrance to space access by measuring and modeling exactly how different rocket types affect the ozone layer.”
Highly reactive trace-gas molecules known as radicals dominate stratospheric ozone destruction, and a single radical in the stratosphere can destroy up to 10,000 ozone molecules before being deactivated and removed from the stratosphere. Microscopic particles, including soot and aluminum oxide particles emitted by rocket engines, provide chemically active surface areas that increase the rate such radicals “leak” from their reservoirs and contribute to ozone destruction, said Toohey.
In addition, every type of rocket engine causes some ozone loss, and rocket combustion products are the only human sources of ozone-destroying compounds injected directly into the middle and upper stratosphere where the ozone layer resides, he said.
The research team is optimistic that a solution to the problem exists. “We have the resources, we have the expertise, and we now have the regulatory history to address this issue in a very powerful way,” said Toohey. “I am optimistic that we are going to solve this problem, but we are not going to solve it by doing nothing.”
Source: EurekAlert
This Week’s Where In The Universe Challenge

Are you ready for another Where In The Universe Challenge? Take a look and see if you can name where in the Universe this image is from. Give yourself extra points if you can name the spacecraft responsible for the image. As usual, we’ll provide the image today, but won’t reveal the answer until tomorrow. This gives you a chance to mull over the image and provide your answer/guess in the comment section — if you dare! Check back tomorrow on this same post to see how you did. Good luck!
UPDATE: The answer has now been posted below.
This image was taken on On March 4, 2009, by the Moderate Resolution Imaging Spectroradiometer (MODIS) on NASA’s Terra satellite. It is not plane contrails as some have suggested, but clouds that formed over the northeast Pacific Ocean that form around the particles in ship exhaust. This image shows how these ship “tracks” are different from the natural marine clouds in the same area. You can see a natural-color view of this image here, but from this enhanced image, scientists can determine the size of the cloud droplets.
Cloud droplets form when water vapor condenses onto a small particles, like the ship exhaust. The ship tracks are brighter than the regular clouds because the cloud particles in them are smaller (yellow and peach), but more numerous, than the particles in the natural clouds (lavender to dark purple).
Why are scientists concerned with cloud brightness? A cloud’s brightness impacts how much sunlight gets bounced back to space and how much reaches the surface of the Earth, which influences global climate. The size of the droplets also influences the amount of rain the clouds produce; smaller droplets are less likely to collide and form drops that are big enough to fall as rain.
How’d you do? Check back next week for another WITU Challenge!
IYA Live Telescope Today – NGC 2516 – “The Diamond Cluster”

Wow… If you had a chance to watch our live remote telescope today, then you were in for an awesome view. This was my first opportunity to call the shot as to where the telescope was aimed and I’ve always wanted to see NGC 2516 with my own eyes. Needless to say, despite small aperture and viewing with a remote camera, I wasn’t disappointed – I was blown away. Did we save a replay for you? Darn right we did…
The following factual information is a cut and paste from Wikipedia:
NGC 2516 – “The Diamond Cluster”: Constellation – CARINA
Southern open cluster NGC 2516, The Diamond Cluster, was discovered by Abbe Lacaille in 1751-1752.
Called “The Diamond Cluster” because of its stellar clarity, the cluster itself is easily visible with the naked eye from dark skies but binoculars will yield a much better view.
The Diamond Cluster contains two beautiful 5th magnitude red giants and three double stars. A small telescope would be required to split the double stars. It contains about 100 stars that appear about the same size as a full moon.
NGC 2516 and the recently discovered nearby star cluster Mamajek 2 in Ophiuchus have similar age and metallicity. Recently, kinematic evidence was presented by E. Jilinksi and coauthors that suggests that these two stellar groups may have formed in the same star-forming complex some 135 million years ago.
Now that we’ve seen NGC 2516, did you happen to notice a little “artifact” that cruised through the picture right before the end? It would appear the southern hemisphere has its share of satellites, too! As always, you can visit the remote telescope by clicking on the IYA “LIVE Remote Cam” Logo to your right. We’ll be broadcasting whenever skies are clear and dark in Central Victoria! Enjoy…
(Information Source: Wikipedia)