NASA Weighing Debris Hit Risk for Hubble Repair Mission

The odds of Loss Of Crew and Vehicle for the STS-125 mission. Credit: NASASpaceflight.com

[/caption]
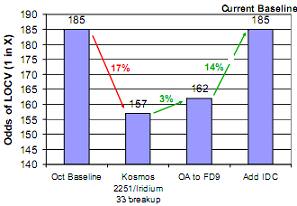
There’s good news and bad news for the upcoming Hubble repair mission. The good news is that the statistical threat posed to space shuttle Atlantis and her crew by micro-meteoroid orbiting debris (MMOD) is currently no greater than last year, even with the collision of two satellites in February and other recent satellite breakups. The chance of the shuttle being hit by MMOD during a mission to Hubble is 1 in 185. But that’s also the bad news. The 1 in 185 chance of a catastrophic impact to a shuttle in Hubble’s orbit is, obviously, quite high, and higher than NASA’s limit of 1 in 200. The final decision of whether this risk is acceptable will be discussed at a Flight Readiness Review meeting on April 30. It is anticipated that NASA will override the limit and accept the risk. Without a servicing mission by a space shuttle crew, the telescope is not expected to last more than another year or two.

According to an article on NASASpaceflight.com, NASA analysts were able to reach this particular ratio by making use of the known probability of detecting and repairing critical Thermal Protection System damage while on orbit, factoring in the length of the mission and orientation of the shuttle during the mission (both attached and unattached to the Hubble) and even adding in how a “rescue mission” would come into play in the event of a catastrophic impact.

NASA guidelines say the Space Shuttle Program cannot accept a Loss of Crew and Vehicle (LOCV) ratio in excess of 1 in 200.

A hole in the shuttle from a micrometeroid after a mission in 2006. Credit: NASA

Immediately after the Kosmos/Iridium satellite collision and factoring in other recent breakups which include the Chinese ASAT/Fengyun 1C, the Kosmos 2421, the risk of LOCV increased to 1 in 157 for Atlantis.

But with the long delay for STS-125, mission planners were able to investigate and implement several mitigation tactics and changes to the flight’s activities that brought the risk back down to 1 in 185 chance.

The NASA team is also looking at different options that will reduce the risk, which include eliminating one EVA day (which would reduce risk by ~6 percent to 1 in 196), eliminating two EVA days (which would reduce risk by ~12 percent to 1 in 208), or eliminating the crew off duty day after the Hubble is released (which would reduce risk to 1 in 201).

Delaying the mission would likely have no effect on the statistical risk. The mission was already delayed when data handling processor on the spacecraft failed in September 2008 and again due to Hurricane Ike in October 2008. With the mitigation tactics, the 1 in 185 chance is no higher than it was determined to be last September.

NASA also analyzed the risk for STS-400 rescue flight, which is 1 in 294. That ratio is only if the crew does an inspection of the Wing Leading Edge panels and Nose Cap and has a short mission duration of just seven days. If the STS-400 crew does not perform any TPS inspection, the LOCV ratio rises to 1 in 217.

But everything is going full-steam-ahead for the mission; Atlantis is on launch pad 39 B being prepared for the mission, Endeavour will be sent to pad 39 A tomorrow (Friday) to prepare for the STS-400 rescue mission, if needed (otherwise Endeavour will move to pad 39 B for the next shuttle mission, STS-127 to the ISS scheduled for June) and the the STS-125 crew is in full training and preparations for the flight.

Credit: NASASpaceflight.com

Bridge Between the Stars – NGC 602: Hubble Visualization by Jukka Metsavainio

NGC 602 Parallel Hubble Visualization by Jukka Metsavainio

[/caption]

It’s been awhile hasn’t it? Time may have passed, but absence makes the heart grow fonder. For those of you who have missed our very special dimensional looks into the Cosmos, then it’s high time we let our minds and eyes relax and we take a 200 thousand light-year distant journey towards the edge of the Small Magellanic Cloud for a look at a bright, young open cluster of stars known as NGC 602…

Whenever we present a dimensional visualization it is done in two fashions. The first is called “Parallel Vision” and it is much like a magic eye puzzle. When you open the full size image and your eyes are the correct distance from the screen, the images will seem to merge and create a 3D effect. However, for some folks, this doesn’t work well – so Jukka has also created the “Cross Version”, where you simply cross your eyes and the images will merge, creating a central image which appears 3D. Upon further study, we’ve also come to realize that there is a certain percentage of people who also are unable to make this happen as well. You aren’t weird – just a percentage. Here’s why…

Typical for hunting animals (as opposed to ‘prey’ animals), we have our eyes set in the front of our heads. Our eyes are typically about 2½ inches apart, and so they see slightly different versions of the scene in front of them, from which the visual part of our brain constructs an internal three-dimensional model. Thus a human being can directly estimate the distance of something without moving a muscle – an important evolutionary advantage for a hunter. The trick is to then ‘fool’ the brain into processing the photographic images as if they really were distant scenes, not just color photos a few inches away. First, you will need a piece of white card, about 12 inches long. You hold the card vertically between your eyes and the pictures, so that it touches the centerline of the stereo pairs. Next? A pair of cheap reading glasses. If you usually have to wear reading glasses then you’ll need a higher power. Try different pairs in the store until you find one that will allow you see sharply no further away than a little over 12 inches. That’s it! Then sit back, relax and prepare to be blown away…

NGC 602 Cross Hubble Visualization by Jukka Metsavainio

Cruising along some 200 thousand light-years away from the Milky Way is the Small Magellanic Cloud – a satellite galaxy of ours. Sitting on its edge is cloud of gas and dust which comprise a nebula known as M90, and within it shines a sparkling cluster of new stars called NGC 602. But these new stars aren’t shy… They’re hot and massive. The radiation and shock waves which pour from them have pushed the nebula away, compressing it and triggering new star formation. While these pre-main sequence embryonic suns lay hidden to all but infrared wavelengths, the beauty of this area is the chemical properties it shares with our own galaxy.

According to the studies of L.R. Carlson (et al) NGC 602’s star formation at a low chemical abundance makes it a “good analog to the early universe in terms of examining the processes and patterns of star formation. This cluster in particular is ideally suited to this aim. Its location in the wing of the SMC means that, while its chemical properties should be similar to those of the rest of the galaxy, it is relatively isolated.” Isolated… But young, very young. Says Carlson, “This pre-Main Sequence population formed coevally with the central cluster about 5 million years ago. Spitzer Space Telescope (SST) images of the region in all four Infrared Array Camera (IRAC) bands reveal a second population of Young Stellar Objects (YSOs), which formed after the stars seen with HST/ACS imaging. Some of these very young objects are still embedded in nebular material. We infer that star formation started in this region less than five million years ago with the formation of the central cluster and gradually propagated towards the outskirts where we find evidence of on going star formation less than a million years old.”

Another interesting factor is NGC 602’s position in the wing of the Small Magellanic Cloud leading to the Magellanic Bridge – a stream of neutral hydrogen which connects the two Magellanic Clouds like a invisible cord. While it’s mostly comprised of low-metallicity gas there have been two early-type stars found inside it. The Magellanic Bridge is also a favored region for investigations of interstellar gas and star formation in very low metallicity region… Much like the home of our bright young cluster. Why is this so fascinating? Because studying star formation in regions like this gives astronomers a look at what may happen during galaxy formation – long before heavier elements are created from successive generations of stars undergoing nuclear fusion.

So, as you look deep into this bridge between the stars, gaze with wonder at the long “elephant trunks” of dust and turn your mind towards these beautiful, bright blue stars still forming from gravitationally collapsing gas clouds. It is a very unique event, occurring where it should not happen – but is. A true bridge between the stars…

And touchstone to the Cosmos.

Many thanks to Jukka Metsavainio for his magic with Hubble Space Telescope images and allowing us this incredible look inside another mystery of space.

Constraining the Orbits of Planet X and Nemesis

Artists impression of the hypothetical star, Nemesis (Wikipedia)

[/caption]

If Planet X was out there, where would it be? This question posed by an Italian researcher turns out to be a lot more involved than you’d think. As opposed to all the 2012 idiocy hype flying around on the internet, this research is actually based on a little thing called science. By analysing the orbital precession of all the inner-Solar System planets, the researcher has been able to constrain the minimum distance a hypothetical object, from the mass of Mars to the mass of the Sun, could be located in the Solar System. As most of the astronomical community already knows, the two purveyors of doom (Planet X and the Sun’s evil twin, Nemesis) exist only in the over-active imaginations of a few misinformed individuals, not in reality…

Planet X and Nemesis are hypothetical objects with more grounding in ancient prophecy and doomsday theories based on pseudo-science. This might be the case, but Planet X came from far more rational beginnings.

The name “Planet X” was actually coined by Percival Lowell at the start of the 20th century when he predicted there might be a massive planet beyond the orbit of Neptune. Then, in 1930, Clyde Tombaugh appeared to confirm Lowell’s theory; a planet had been discovered and it was promptly named Pluto. However, as time went on, it slowly became apparent that Pluto wasn’t massive enough to explain the original observations of the perturbations of Uranus’ orbit (the reason for Lowell’s Planet X prediction in the first place). By the 1970’s and 80’s modern observation techniques proved that the original perturbations in Uranus’ orbit were measurement error and not being caused by a massive planetary body. The hunt for Planet X pretty much ended with the discovery of Pluto in 1930, but it never lived up to its promise as a massive planetary body (despite what the woefully erroneous doomsday theories say otherwise).

Now an Italian researcher has published results from a study that examines the orbital dynamics of the inner-Solar System planets, and relates them to the gravitational influence of a massive planetary body orbiting the Sun from afar.

To cut a long story short, if a massive planetary body or a small binary sibling of the Sun were close to us, we would notice their gravitational influence in the orbital dynamics of the planets. There may be some indirect indications that a small planetary body might be shaping the Kuiper Cliff, and that a binary partner of the Sun might be disturbing the Oort Cloud every 25 million years or so (relating to the cyclical mass extinctions in Earth’s history, possibly caused by comet impacts), but hard astronomical proof has yet to be found.

Lorenzo Iorio from the National Institute of Nuclear Physics in Pisa (Italy) has taken orbital data from many years of precise observations and used his computations to predict the closest possible distance at which a massive planet could orbit if it was out there.

It turns out that all the planets the mass of Mars and above have been discovered within the Solar System. Iorio computes that the minimum possible distances at which a Mars-mass, Earth-mass, Jupiter-mass and Sun-mass object can orbit around the Sun are 62 AU, 430 AU, 886 AU and 8995 AU respectively. To put this into perspective, Pluto orbits the Sun at an average distance of 39 AU.

So if we used our imaginations a bit, we could say that a sufficiently sized Planet X could be patrolling a snail-paced orbit somewhere beyond Pluto. But there’s an additional problem for Planet X conspiracy theorists. If there was any object of sufficient size (and by “sufficient” I mean Pluto-mass, I’m being generous), according to a 2004 publication by David Jewitt, from the Institute for Astronomy, University of Hawaii, we would have observed such an object by now if it orbited within 320 AU from the Sun.

Suddenly, the suggestion that Planet X will be making an appearance in 2012 and the crazy idea that anything larger than a Pluto-sized object is currently 75 AU away seems silly. Sorry, between here and a few hundred AU away, it’s just us, the known planets and a load of asteroids (and perhaps the odd plutino) for company.

Source: arXiv, Astroengine.com

Satellites Show How Earth Moved During Earthquake

An Envisat Advanced Synthetic Aperture Radar (ASAR) interferogram. Credit: IREA-CNR

[/caption]
If you have ever experienced an earthquake, you know that the Earth literally moves beneath your feet. And now there’s satellite data to show just how much. Scientists studying satellite radar data from ESA’s Envisat and the Italian Space Agency’s COSMO-SkyMed, have been able analyze the movement of Earth during and after a recent earthquake in central Italy. A 6.3 earthquake shook the town of L’Aquila in on April 6, 2009, and satellite data is being used to map surface deformation in the Earth that took place after the quake and the numerous aftershocks that followed.

Using Synthetic Aperture Radar (SAR) data from these satellites, scientists took two or more radar images of the same ground location and compared them. The data is precise enough to show the differences in a scale of a few millimeters between images taken before and after the quake

Combining the before and after data, the scientists created ‘interferogram’ images that appear as rainbow-colored interference patterns. A complete set of colored bands, called ‘fringes’, represents ground movement relative to the spacecraft of half a wavelength, which is 2.8 cm in the case of the Envisat.
The Envisat interferogram shows nine fringes surrounding an area where the ground moved as much as 25 cm (along a line between the satellite’s orbital position and the earthquake area).

An Envisat Advanced Synthetic Aperture Radar (ASAR) interferogram. Credits: INGV

“By using available 3D ground displacements from five GPS location sites around the affected area, we were able to confirm the preliminary results obtained with Envisat data,” said Stefano Salvi from INGV’s Earthquake Remote Sensing Group.

The COSMO-SkyMed , which is a constellation of three satellites, can provide more frequent data. This means new interferograms can be calculated every few days.

The COSMO-SkyMed data together with the Envisat data and possibly radar data from other satellites will ensure a dense sampling of the ground deformation around the L’Aquila area in the next months, which could make this earthquake one of the most covered by SAR Interferometry measurements.

To ensure all scientists are able to contribute to the analysis of the earthquake, ESA is making its Earth observation dataset collected over the L’Aquila area freely accessible with an innovative fast data download mechanism. The dataset will be continuously updated with the newest Envisat acquisitions.
“We produced an interferogram just a few hours after the Envisat acquisition by combining these data with data acquired before the earthquake on 1 February. We were pleased that we were able to immediately see the pattern of the earthquake,” said Riccardo Lanari of IREA-CNR in Naples, Italy.

Source: ESA

Woowoo Ads on Universe Today

Hey everyone, I’ve noticed there’s a Twitterstorm going on out there over the kinds of ads showing up on Universe Today. You know the ones for 2012, and strange theories about how Einstein was wrong. These are the contextual ads provided by Google Adsense, and without them, Universe Today would be a shadow of its former self.

Tim Farley over at Skeptical Software Tools wrote a reasoned response to the controversy of allowing woowoo ads on a scientific site, and it pretty much matches my point of view. But I chimed in on the comments of his site with a more detailed response. Here’s what I had to say:

“Thanks Tim, I appreciate the reasoned response to the situation. What you’ve described is essentially my position on the matter. Google Adsense is the only advertiser out there that will actually pay the bills, so I can pay the writers, server costs, etc. Without the money from Adsense, Universe Today would be a shadow of its current self. I’d layoff the writers, move the site to a $10/month host, and go get a real job.

And don’t think that I haven’t tried to bring in real advertisers. I’ve started up advertising networks, cold-called every telescope manufacturer, and begged my readers to help find sponsors for Universe Today – and that was met with silence. I know that it’s just a matter of time before lots of advertising moves online, but until then what do people suggest we do?

So for now, it’s Adsense. Big, bold Adsense ads that take up a tiny fraction of the site’s total real estate. Compare that to a newspaper or magazine and you’ll see that UT has less advertising.

The big complaint, obviously, is that there are 2012 and woowoo ads selling all kinds of nutty theories. But those ads paid for a multi-part series of articles that debunked every aspect of the 2012 silliness. Those ads keep the BAUT forum going. And they’re not the only ads on the site, there are also ads for telescopes, trips to the Kennedy Space Center and other space-related stuff.

So why don’t I filter out the woowoo ads? I tried that. Within a day or so, I filled up my filter list completely and it was just a fraction of the ads out there. And there’s no way I can see them all. And if you filter some, it just lets others float to the top.

We’re at an uncomfortable time in the world economy, with massive advertising resources shifting from the old media publishers to the new online world. Universe Today and the other space media sites are perfectly positioned to reap the rewards when the shift is actually finished. And when it does, we’ll have lots of very appropriate advertisers, spending the kind of money required to keep these kinds of sites going. It’ll be awesome, and there’ll be ice cream for everyone.

But until then, we have to do what we can to survive. I’m grateful that I can pay salaries to 6 full and part time writers and still feed my children. And the woowoos are contributing to that. I think it’s a hilarious transfer of wealth, honestly.

Universe Today is financially stable and growing nicely. As it grows, I can bring on more writers and provide better coverage. The site is almost completely immune the current troubles in the world economy. (I’ve worked in my basement developing Universe Today in my spare time before and I can do it again)

If you don’t like ads, I suggest you install Adblock for Firefox. Zip done, never see an ad again. And the when the future has arrived, I’ll let you know.

But if you want to complain about Universe Today, I beg you to complain about the content, tone and coverage of the articles and our respect for science and skepticism. Don’t worry about the ads, they’ll get sorted out soon enough.

Fraser Cain
Publisher
Universe Today”

So there you go.

Where In The Universe #51

It’s Wednesday, so that means its time for another “Where In The Universe” challenge to test your visual knowledge of the cosmos. See if you can name where in the Universe this image is from, and give yourself extra points if you can name the spacecraft responsible for the image. Make your guess and post a comment, but please no links to the answer. Check back sometime on Thursday to find the answer and see how you did.

UPDATE: The answer has now been posted below. Don’t peek at the answer until you make your guess!

This is Waw An Namus, (or also called Uau En Namus) which is a volcano in south-central Libya. It was photographed from the Space Shuttle on mission STS-52. I love the description of this landform on the referring webpage from Oregon State:

“A low caldera about 4 km in diameter is surrounded by a 5 – 10 km wide dark black deposit of ash that stands out starkly against the yellowish desert. The few people who have visited have been struck by its beauty: The Italian geologist Angelo Pesce wrote that as seen from the rim, one is “overwhelmed by a scene of rare beauty….Inside, the only thing one wishes is to be alone and wander in admiration from one end to the other.” But Pesce also complains about the “veritable cloud of mosquitoes, which not having many occasions to feed on fresh blood warmly welcome visitors to their desert realm. The Arabic word Namus means mosquito.”

Not sure I’d want to take a stroll through the clouds of mosquitoes!

This image was actually suggested by our publisher, Fraser Cain. We were hoping people would think it might be Io, which a few of you guessed. If anyone else has any suggestions for a Where In The Universe Challenge, email me at nancyatkinson04 at yahoo.com

Check back next week for another WITU Challenge!

Major Utility Company Makes Agreement for Space Based Solar Power

Solar Collecting Satellite. Image courtesy of Mafic Studios.

[/caption]
One of the largest utility companies in the US has decided to look towards space to find more power. Pacific Gas and Electric (PG&E) in California announced a proposed agreement with startup company Solaren Corporation to provide 200 mega watts of space based solar power (SBSP) starting in 2016. PG&E is now seeking approval from California state regulators for permission to sign this agreement. While PG&E is not making any financial investment at this time, the announcement shows that SBSP is being taken seriously as a viable energy source. PG&E and the two other California utilities are required by the state to source 20 percent of their power from renewable sources by 2010 and 30 percent by 2017. None are producing the required amount so far.

Solaren Corporation is a small, 8-year-old company based in California whose executives have experience working for Boeing and Lockheed Martin. According to PG&E’s website, Solaren says it plans to generate the power using solar panels in earth orbit, then convert it to radio frequency energy for transmission to a receiving station in California. From there, the energy will be converted to electricity and fed into PG&E’s power grid

The proposed agreement is for the delivery of 200MW starting in 2016 for 15 years.

Earlier this year Universe Today interviewed Peter Sage from Space Energy, another SBSP company. Sage said in a statement released today that this announcement is a
“huge step forward for both Solaren and Space Energy as it highlights to the investment community that utility firms are willing to recognize Space-Based Solar Power as a credible and viable source of energy.” Sage added that while the 200 mega watts Solaren is planning to provide represents only 20% of the planned capacity of one of Space Energy’s satellites, it successfully validates the overall business case for SBSP within the larger energy industry.

The U.S. Department of Energy and NASA began seriously studying the concept of solar power satellites in the 1970s, again in the 1990’s and in 2007, a major study by the Defense Department’s National Security Space Office gave the concept another boost, concluding that “there is enormous potential for energy security, economic development, improved environmental stewardship … and overall national security for those nations who construct and possess a SBSP capability.”

It seems like a win-win situation for PG&E. They told their customers, “If Solaren succeeds, PG&E’s customers have a great opportunity to benefit from affordable clean energy. There is no risk to PG&E customers; PG&E has contracted only to pay for power that Solaren delivers.”

PG&E has 5.1 million electric customer accounts and 4.2 million natural-gas customer accounts in Northern and Central California.

Sources: Space Energy press release, PG&E website

COLBERT on the ISS

The C.O.L.B.E.R.T patch.

[/caption]

2nd UPDATE: Watch the video of astronaut Suni Williams on “The Colbert Report” below .

There will be a COLBERT on the International Space Station. Word has it that NASA, however, did not name Node 3 on the ISS after comedian Stephen Colbert, who won a NASA-sponsored naming contest for the next module that will be brought to the station. According to Robert Pearlman on CollectSPACE, NASA will announce on Comedy Central’s “Colbert Report” later tonight (Tuesday) that the module’s name will be “Tranquility” – in deference to Apollo 11’s landing site on the Moon (40th anniversary and all this year). But NASA did name a new treadmill after Colbert, kinda sorta. NASA created an acronym for the treadmill as the Combined Operational Load Bearing External Resistance Treadmill, or COLBERT. Of course, this isn’t actually official yet. Pearlman’s article was published two hours before the “Colbert Report” aired (even though NASA’s press release specificially stated the name would “not be publicly released until the program airs.” Hmmm… guess nothing is sacred.) We’ll post the video and official word when available. You can see an image of the current treadmill on the ISS below.

UPDATE: Yes, it is true. Node 3 is Tranquility and the treadmill is C.O.L.B.E.R.T. The “official” treadmill patch is above, and the video from “The Colbert Report” is below. Colbert took it well, and he’s excited about the treadmill. Excerpts from NASA’s press release are below, as well.

Astronaut Suni Williams on the ISS treadmill. Credit: NASA

Here’s astronaut Suni Williams running on the current ISS treadmill. She ran a marathon in space on this treadmill.

Here’s info from NASA’s official press release on the new Node 3 name:

“The public did a fantastic job and surprised us with the quality and volume of the suggestions,” said Bill Gerstenmaier, associate administrator for Space Operations. “Apollo 11 landed on the moon at the Sea of Tranquility 40 years ago this July. We selected ‘Tranquility’ because it ties it to exploration and the moon and symbolizes the spirit of international cooperation embodied by the space station.”

“We don’t typically name U.S. space station hardware after living people and this is no exception,” Gerstenmaier joked. “However, NASA is naming its new space station treadmill the ‘Combined Operational
Load Bearing External Resistance Treadmill,’ or COLBERT. We have invited Stephen to Florida for the launch of COLBERT and to Houston to try out a version of the treadmill that astronauts train on.”

The treadmill is targeted to launch to the station in August. It will be installed in Tranquility after the node arrives at the station next year, scheduled for February 2010.

The Anatomy of a Solar Explosion in 3-D

STEREO-A viewing a coronal mass ejection leaving the sun between December 12-13, 2008. Credit: NASA


Wouldn’t it be great if solar physicists could predict sun storms just like meteorologist predict hurricanes? Well, now perhaps they can. NASA’s twin STEREO observatories have made the first 3-D measurements of solar explosions, known as coronal mass ejections (CMEs), allowing scientists to see their size and shape, and image them as they travel approximately 93 million miles from the sun to Earth. With STEREO, scientists can now capture images of solar storms and make real-time measurements of their magnetic fields, much the same way that satellites allow forecasters to see the development of a hurricane. Eruptions from the sun’s outer atmosphere, or corona, can wreak havoc on satellites (and astronauts) in orbit or induce large currents in power grids on Earth, which can cause power disruptions or black outs.

“We can now see a CME from the time it leaves the solar surface until it reaches Earth, and we can reconstruct the event in 3D directly from the images,” said Angelos Vourlidas, a solar physicist at the Naval Research Laboratory, Washington, and project scientist for the Sun Earth Connection Coronal and Heliospheric Investigation aboard STEREO. In the video above, see some of the 3-D imagery, and hear Vourlidas talk about about the new findings.

[/caption]
CMEs spew billions of tons of plasma into space at thousands of miles per hour and carry some of the sun’s magnetic field with it. These solar storm clouds create a shock wave and a large, moving disturbance in the solar system. The shock can accelerate some of the particles in space to high energies, a form of “solar cosmic rays” that can be hazardous to spacecraft and astronauts. The CME material, which arrives days later, can disrupt Earth’s magnetic field, or magnetosphere, and upper atmosphere.

STEREO consists of two nearly identical observatories that make simultaneous observations of CMEs from two different vantage points. One observatory ‘leads’ Earth in its orbit around the sun, while the other observatory ‘trails’ the planet. STEREO’s two vantage points provide a unique view of the anatomy of a solar storm as it evolves and travels toward Earth. Once the CME arrives at the orbit of Earth, sensors on the satellites take in situ measurements of the solar storm cloud, providing a “ground truth” between what was seen at a distance and what is real inside the CME.

The combination is providing solar physicists with the most complete understanding to date of the inner workings of these storms. It also represents a big step toward predicting when and how the impact will be felt at Earth. The separation angle between the satellites affords researchers to track a CME in three dimensions, something they have done several times in the past few years as they have learned to use this new space weather tool.

Visualization of a coronal mass ejection event on December 12-13, 2008 as seen simultaneously by the two STEREO spacecraft. The images on the right were taken by STEREO-A, while the images on the left were taken by STEREO-B. The images were taken by the COR2 telescopes on STEREO’s SECCHI instrument suite. Credit: NASA

“The in situ measurements from STEREO and other near-Earth spacecraft link the physical properties of the escaping CME to the remote images,” said Antoinette “Toni” Galvin, a solar physicist at the University of New Hampshire, and the principal investigator on STEREO’s Plasma and Suprathermal Ion Composition (PLASTIC) instrument. “This helps us to understand how the internal structure of the CME was formed and to better predict its impact on Earth.”

Until now, CMEs could be imaged near the sun but the next measurements had to wait until the CME cloud arrived at Earth three to seven days later. STEREO’s real-time images and measurements give scientists a slew of information—speed, direction, and velocity—of a CME days sooner than with previous methods. As a result, more time is available for power companies and satellite operators to prepare for potentially damaging solar storms.

Much like a hurricane’s destructive force depends on its direction, size, and speed, the seriousness of a CME’s effects depends on its size and speed, as well as whether it makes a direct or oblique hit across Earth’s orbit.

CMEs disturb the space dominated by Earth’s magnetic field. Disruptions to the magnetosphere can trigger the brightly colored, dancing lights known as auroras, or Northern and Southern Lights. While these displays are harmless, they indicate that Earth’s upper atmosphere and ionosphere are in turmoil.

Sun storms can interfere with communications between ground stations and satellites, airplane pilots, and astronauts. Radio noise from a storm can also disrupt cell phone service. Disturbances in the ionosphere caused by CMEs can distort the accuracy of Global Positioning System (GPS) navigation and, in extreme cases, induce stray electrical currents in long cables and power transformers on the ground.

The twin STEREO spacecraft were launched October 25, 2006, into Earth’s orbit around the sun.

Sources: NASA, APL

Volcanic Ash

Ash plume from Mount Cleveland. Image credit: NASA

[/caption]
When volcanoes erupt, they can release large quantities of lava, rocks, hot gasses and volcanic ash. This volcanic ash is made up of pulverized rock and glass particles smaller than 2 millimeters in diameter. Once ejected into the air, it can travel for hundreds of kilometers before coming back to Earth.

There are two kinds of volcanic ash: fine ash, with particles smaller than 0.063 mm, and course ash, with particles smaller than 2 mm. Larger rocks aren’t kept aloft and rain down around the volcano’s cone during an eruption. The largest rocks are called volcanic bombs, and they can be as large as 6 meters across.

Ash is created when solid rock shatters and magma separates into tiny particles during an explosive eruption. The violent eruption together with steam tears apart the rock surrounding the volcano’s vent, and fires it up into the air – sometimes many kilometers into the air.

Once the volcanic ash is in the air, obscures light from the Sun, turning the sky hazy and yellow. It can even make spectacular sunsets. A large enough eruption can spread volcanic ash around the world, cooling the Earth for several years. The smallest particles can be held aloft in the Earth’s atmosphere for years, and spread around the planet on high-altitude winds.

Volcanic ash is part of one of the biggest dangers with volcanoes: pyroclastic flows. These occur when hot gas and ash erupt from a volcano and flow down its flanks at high speed. These flows can have temperatures higher than 1,000 degrees C, and travel at more than 700 km/hour. It’s impossible to outrun a pyroclastic flow.

When the ash finally lands around a volcano, it can cause further problems. Just a few centimeters of ash is heavy enough to collapse roofs, and kill animals and crops. If there’s rain, the ash turns into a sticky, muddy mess that will take months to clean up.

We have written many articles about volcanoes for Universe Today. Here’s an article about different types of volcanoes, and here’s one about different types of lava.

Want more resources on the Earth? Here’s a link to NASA’s Human Spaceflight page, and here’s NASA’s Visible Earth.

We have also recorded an episode of Astronomy Cast about Earth, as part of our tour through the Solar System – Episode 51: Earth.