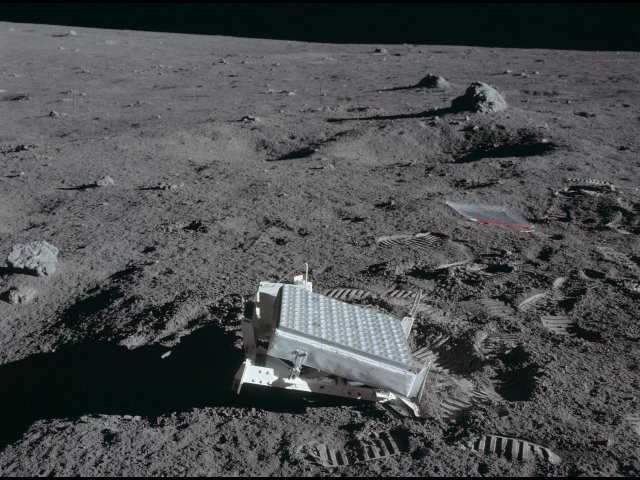
Representing what may be the first long term lunar environmental impact study, recent laser ranging data from the Apache Point Observatory in New Mexico suggests the Lunar Ranging Retro Reflectors (LRRRs) left on the Moon by Apollo missions 11, 14 and 15 are beginning to shows signs of age.
Apache Point Observatory’s Lunar Laser-ranging Operation (the acronym says it all) has been collecting ranging data from the LRRRs since 2006, using a 3.5 metre telescope and a 532 nm laser.
A typical APOLLO observing session involves shooting the laser at the largest of the LRRRs (Apollo 15’s) over a ‘run’ of four to eight minutes. Each shot sends about 1017 photons to the Moon, from which only one returned photon per shot may be detected. This is why the laser is shot thousands of times at a 20 Hz repetition rate during each run.
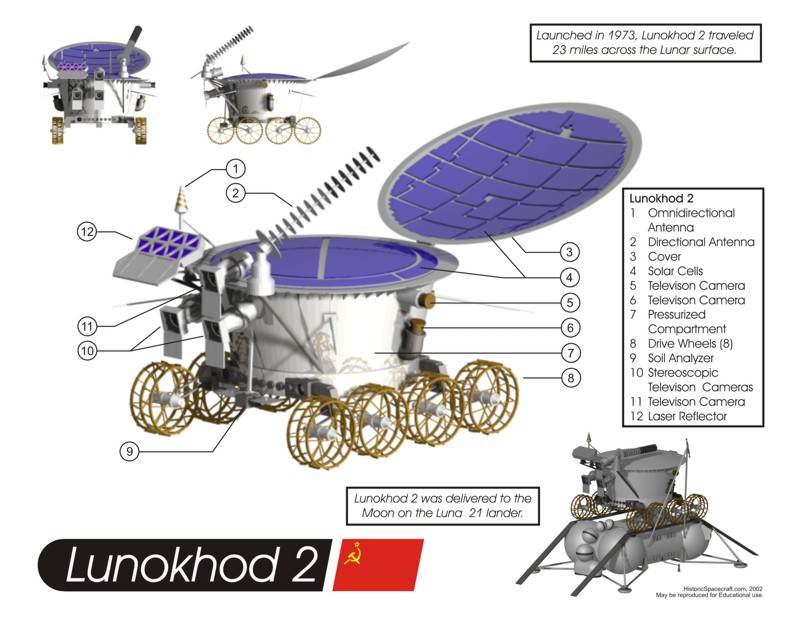
If the return signal from the Apollo 15 LRRR is good, the laser is then directed to fire at the Apollo 11 and 14 reflectors. The laser can even be directed to the Russian Lunokhod 2 reflector, landed on the Moon in 1973, although this reflector does not return a reliable signal if it is in sunlight, probably because heating affects the reflectors’ refractive index and distorts the return signal.
Lunokhod 2 (moon walker in Russian), an 840 kg rover that landed on the Moon on January 15, 1973 and undertook scientific investigations on the lunar surface until May 1973.
The Apollo LRRRs were designed to remain isothermal, even in direct sunlight, to avoid the problem apparently suffered by Lunokhod 2. But a review of current and historical data has revealed a noticeable decline in their performance at each Full Moon. Since the reflectors are directed straight at Earth, they experience the most direct sunlight at a Full Moon.
Recent Apache Point Observatory data has been compared to historical data collected by earlier observatories involved in lunar laser ranging. For the period 1973 to 1976, no Full Moon deficit was apparent in data records, but it began to emerge clearly in a 1979 to 1984 data set. The research team estimate that return signal efficiency at Full Moon has degraded by a factor of 15 over the approximately forty years since the Apollo reflectors were placed on the Moon.
While heating effects may play a part in the performance degradation of the LRRRs, lunar dust is suggested to be the more likely candidate, as this would be consistent with the very gradual performance degradation – and where the most substantial performance loss occurs right on Full Moon. These findings may require careful consideration when designing future optical devices that are intended to remain on the lunar surface for long periods.
On the bright side – all the reflectors, including Lunokhod 2’s, are still functioning on some level. Hopefully, decades before their slow and steady decline progresses to complete failure, even more efficient replacement devices will be landed on the lunar surface – perhaps carefully positioned by a gloved hand or otherwise by robotic means.
The Martin Jetpack in flight. Image courtesy Martin Jetpack
[/caption]
Step right up — you can now get your very own jetpack. That’s right, a real, not-science-fiction-honest-to-goodness jetpack. New Zealander Glenn Martin has been working on perfecting his jetpack for 30 years, and in 1998 created the Martin Aircraft Company to develop and market his idea. Now, the jetpack has become a reality. The 200-horsepower, dual-propeller is designed to fly average-sized person for 48 km (30 miles) in 30 minutes on 18 liters (5 gallons) of gas. The newest model can also reach heights of 2,400 meters (about 1.5 miles). Price? $100,000. “They are a helluva lot of fun to fly,” said Martin.
A drawing of the body of the Martin Jetpack. Courtesy Martin Aircraft Company.
Jetpacks have gone beyond being a science-fiction icon to become part of our cultural mind-set, and are such a powerful idea that several people have tried to develop them. The first serious attempts were instigated by the US military in the 1950s. The idea was to build an ultimate ‘all terrain vehicle’ to move military commanders around a battlefield. The Bell Rocket Belt was the most successful and first flew in 1961. But it only flew for 26 seconds.
Glenn Martin said he wanted to build a jetpack that could beat the 30 second mark, and beyond. He first developed his concept in 1981 based on a mathematical formula he came up with to determine what type of engine and thrust would be needed. In 2005, the 9th prototype achieved sustained flight times, laying the foundation for a viable and successful pre-production prototype to be developed.
Martin’s jetpack sounds like motorcycle or lawn mower. Since the jetpacks weigh less than 254 pounds, they don’t require a pilot’s license to fly. However, they must be flown under federal aviation regulations because it is powered by a piston driven engine. Martin says that buyers will be required to go through training before taking to the skies. The jetpack is also equipped with a low-altitude emergency parachute.
Those who have tested the jetpack say that with only the controls in front of you, flying a jetpack is a real free-flight experience.
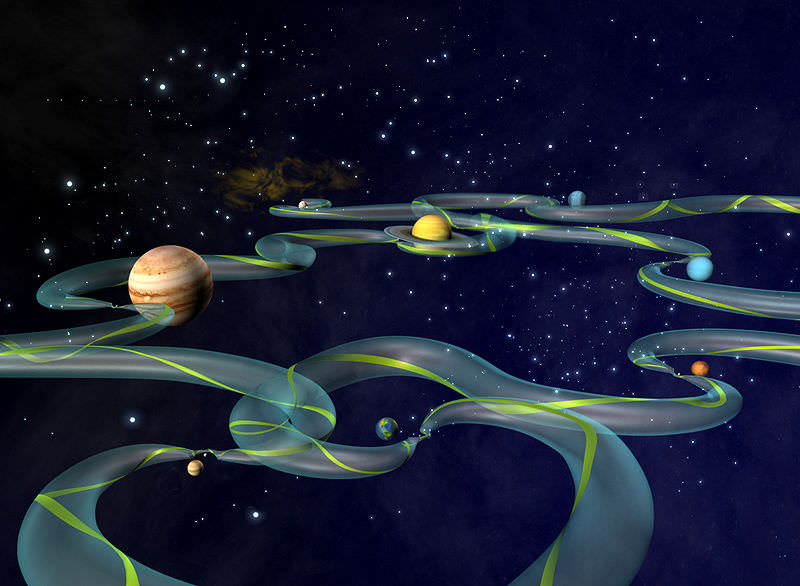
Short on fuel, but good at astrophysics? It is possible to tour the solar system on less than 30 Altairian dollars a day by using the Interplanetary Transport Network (ITN).
The ITN is based on gravity assist manoeuvres and low energy transfer orbits around and between Lagrange points. Using the ITN, it is theoretically possible to tour the solar system with an exceedingly economic use of fuel as long as you have an abundance of patience and don’t mind taking an often circuitous route to your destination.
If you imagine the whole solar system as a rubber sheet which is warped by gravity wells, then the planets are really just small depressions of different depths pressed into the sides the Sun’s overarching gravity well.
What’s important to this story is that the edges of those small depressions are nearly flat with respect to the otherwise steep slopes created by the Sun and the planets. It takes a lot less energy to move around on these flat edges, than it does trying to climb straight up the steep slopes.
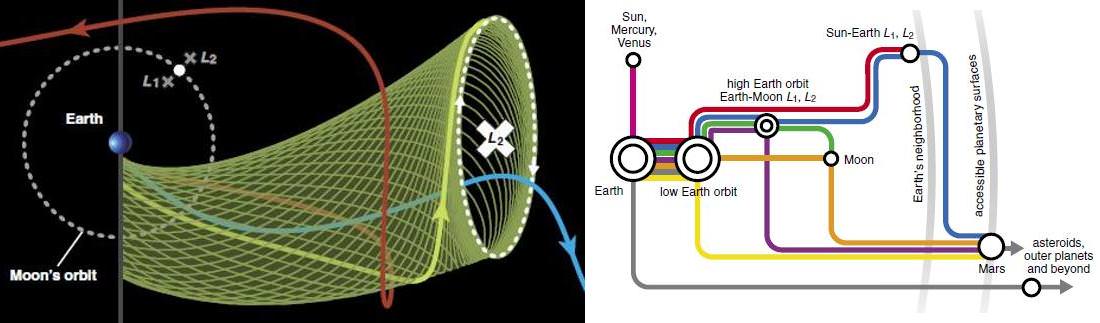
The flat edge that is present around the Earth’s gravity well is land marked by Lagrange point 1 (or L1) lying directly between the Sun and the Earth – and Lagrange point 2 (L2) on the opposite side of the Earth directly away from the Sun.
It’s possible for a spacecraft to orbit a Lagrange point and be carried around the Sun with very little expenditure of energy. It’s because you are essentially riding the bow wave of the Earth as it orbits the Sun – so you are carried the Sun at the same orbital speed as the Earth (30 kilometres a second) without having to burn a lot of fuel in the process.
Also the Lagrange points represent junction points to enable low energy transfer between different planetary orbits. As though the solar system’s space-time curvature makes for a giant skateboard park, it’s possible to step off L1 and follow a trajectory down to Venus – or you can coast across the flat edge of Earth’s gravity well for about 3 million kilometres to L2 and then step off on a long winding path to the L1 of Mars. Here you might rest again before perhaps shuffling across to Mars’ L2 and then on to Jupiter.
Mathematical analysis of the gravitational interactions between three or four bodies (say, your spacecraft, the Earth and the Sun – and then add Mars too) – is complex and has some similarities with chaos theory. But such an analysis can identify interconnecting pathways right across the solar system, which ITN proponents refer to as ‘tubes’.
The image on the left (Credit: American Scientist) shows an ITN ‘tube’ approaching Earth’s L2. At this point a cosmic hitchhiker can either double back on a trajectory towards Venus (red line), stay in orbit around L2 and tag along with Earth– or continue on through (blue line), perhaps entering another ITN tube on the way to Mars. The image on right shows a tongue-in-cheek depiction of the ITN tube network (Credit: NASA).
ITN principles have been adopted by a number of spacecraft missions to conserve fuel. Edward Belbruno proposed a low energy lunar transfer to get the Japanese probe Hiten into lunar orbit in 1991 despite it only having 10% of the fuel required for a traditional trans-lunar insertion trajectory. The manoeuvre was successful, although travel time to the Moon was five months instead of the traditional three days. NASA’s Genesis mission and the ESA’s SMART-1 are also considered to have used low energy ITN-like trajectories.
So impoverished hitchhikers, maybe you can still have that grand tour of planets by using the ITN – but make sure you pack a towel, it will be a very long trip.
(Recommended reading: Ross, S.D. (2006) The interplanetary transport network. American Scientist 94(3), 230–237.)
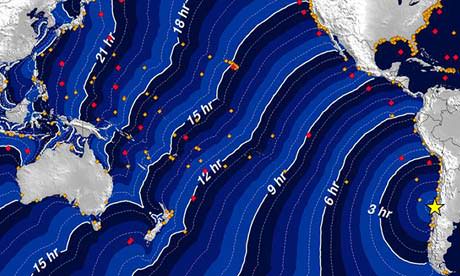
Chart of the Chile tsunami's travel time, released by the National Atmospheric and Oceanic Administration. Photograph: AFP/Getty Images
[/caption]
While a huge earthquake off the coast of Chile triggered a tsunami that moved at the speed of a jet aircraft across the Pacific Ocean on Feb. 27, the tsunami event – thankfully — was smaller than scientists expected. Some experts forecasted the event would produce 9-foot tall tsunami waves slamming coastlines along the Pacific Rim, which did not materialize; it would have been one of the biggest tsunami on record. At magnitude 8.8, this earthquake was among the largest seismic activity ever recorded. So, why was the resulting tsunami not a “mega event” as well?
“It is too early to know for sure,” said Anne Sheehan, a geologist from the University of Colorado – Boulder.
“It was a truly enormous “megathrust” earthquake, shallow and offshore,” Sheehan told Universe Today. “That kind of earthquake can generate a large tsunami if it displaces a large area of seafloor vertically (either up or down). It could be that more of the earthquake displacement was at depth below the seafloor, and did not rupture the seafloor surface as much as was expected given the size and depth of the earthquake.”
Sheehan said the Chilean earthquake released more than 400 times the energy of the recent Haiti earthquake. “It was truly an enormous earthquake in terms of energy release, the largest in the world since the 2004 Sumatra earthquake and the fifth largest since 1900,” she said.
The earthquake that generated the great Indian Ocean tsunami of 2004 is estimated to have released the energy of 23,000 Hiroshima-type atomic bombs, according to the U.S. Geological Survey (USGS).
The 8.8 quake in Chile released the energy equivalent of 20 billion tons of TNT, or 400 times the largest nuclear weapon ever detonated, the Tsar Bomba, a 50 megaton test done by the USSR in 1961. A tsunami warning buoy was deployed by the Chilean Navy and WHOI off the northern coast of Chile in December 2004 as part of a national warning system west of Chile. (Photo by Robert Weller, WHOI)
Chile is along the “Ring of Fire” that stretches north from South America to the Aleutian Islands, then south through Japan, Indonesia and to New Zealand. The fault zone of the Chilean earthquake was extremely long — several hundred miles — signaling the potential for further large earthquakes in the region.
“These large earthquakes in the Southern Hemisphere have the potential to cause tsunamis all over the Pacific Rim,” Sheehan said in a press release. “Fortunately, people have a much greater understanding of the phenomenon today. Before 2004, a lot of people didn’t even know what a tsunami was,” she said.
Sheehan said she believes that lessons learned by Chilean experts following a world-recording setting magnitude 9.5 quake there in 1960, and subsequent quakes in the next several decades, resulted in stricter building codes, saving many lives. “The death toll is expected to be far smaller than in Haiti, an example showing that mitigation efforts really can be effective.”
As of this writing, the death toll stands of the Chile earthquake stands at 711. The quake in Haiti killed over 200,000 people. Early earthquake picture posted on Twitter by @tapeks.
Lessons learned from the 2004 Indian Ocean event also allowed officials to send out effective early warnings and initiate the evacuation of tens of thousands of people living on Pacific islands. Now, even more is being learned about the nature of tsunamis from this latest event, and future predictions should improve.
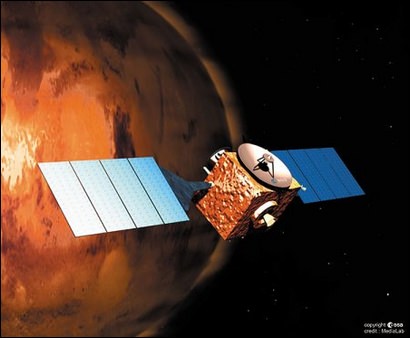
An illustration showing the ESA's Mars Express mission. Credit: ESA/Medialab)
Understanding the present-day Martian climate gives us insights into its past climate, which in turn provides a science-based context for answering questions about the possibility of life on ancient Mars.
Our understanding of Mars’ climate today is neatly packaged as climate models, which in turn provide powerful consistency checks – and sources of inspiration – for the climate models which describe anthropogenic global warming here on Earth.
But how can we work out what the climate on Mars is, today? A new, coordinated observation campaign to measure ozone in the Martian atmosphere gives us, the interested public, our own window into just how painstaking – yet exciting – the scientific grunt work can be.
[/caption]
The Martian atmosphere has played a key role in shaping the planet’s history and surface. Observations of the key atmospheric components are essential for the development of accurate models of the Martian climate. These in turn are needed to better understand if climate conditions in the past may have supported liquid water, and for optimizing the design of future surface-based assets at Mars.
Ozone is an important tracer of photochemical processes in the atmosphere of Mars. Its abundance, which can be derived from the molecule’s characteristic absorption spectroscopy features in spectra of the atmosphere, is intricately linked to that of other constituents and it is an important indicator of atmospheric chemistry. To test predictions by current models of photochemical processes and general atmospheric circulation patterns, observations of spatial and temporal ozone variations are required.
The Spectroscopy for Investigation of Characteristics of the Atmosphere of Mars (SPICAM) instrument on Mars Express has been measuring ozone abundances in the Martian atmosphere since 2003, gradually building up a global picture as the spacecraft orbits the planet.
These measurements can be complemented by ground-based observations taken at different times and probing different sites on Mars, thereby extending the spatial and temporal coverage of the SPICAM measurements. To quantitatively link the ground-based observations with those by Mars Express, coordinated campaigns are set up to obtain simultaneous measurements.
Infrared heterodyne spectroscopy, such as that provided by the Heterodyne Instrument for Planetary Wind and Composition (HIPWAC), provides the only direct access to ozone on Mars with ground-based telescopes; the very high spectral resolving power (greater than 1 million) allows Martian ozone spectral features to be resolved when they are Doppler shifted away from ozone lines of terrestrial origin.
A coordinated campaign to measure ozone in the atmosphere of Mars, using SPICAM and HIPWAC, has been ongoing since 2006. The most recent element of this campaign was a series of ground-based observations using HIPWAC on the NASA Infrared Telescope Facility (IRTF) on Mauna Kea in Hawai’i. These were obtained between 8 and 11 December 2009 by a team of astronomers led by Kelly Fast from the Planetary Systems Laboratory, at NASA’s Goddard Space Flight Center (GSFC), in the USA. Credit: Kelly Fast About the image: HIPWAC spectrum of Mars’ atmosphere over a location on Martian latitude 40°N; acquired on 11 December 2009 during an observation campaign with the IRTF 3 m telescope in Hawai’i. This unprocessed spectrum displays features of ozone and carbon dioxide from Mars, as well as ozone in the Earth’s atmosphere through which the observation was made. Processing techniques will model and remove the terrestrial contribution from the spectrum and determine the amount of ozone at this northern position on Mars.
The observations had been coordinated in advance with the Mars Express science operations team, to ensure overlap with ozone measurements made in this same period with SPICAM.
The main goal of the December 2009 campaign was to confirm that observations made with SPICAM (which measures the broad ozone absorption spectra feature centered at around 250 nm) and HIPWAC (which detects and measures ozone absorption features at 9.7 μm) retrieve the same total ozone abundances, despite being performed at two different parts of the electromagnetic spectrum and having different sensitivities to the ozone profile. A similar campaign in 2008, had largely validated the consistency of the ozone measurement results obtained with SPICAM and the HIPWAC instrument.
The weather conditions and the seeing were very good at the IRTF site during the December 2009 campaign, which allowed for good quality spectra to be obtained with the HIPWAC instrument.
Kelly and her colleagues gathered ozone measurements for a number of locations on Mars, both in the planet’s northern and southern hemisphere. During this four-day campaign the SPICAM observations were limited to the northern hemisphere. Several HIPWAC measurements were simultaneous with observations by SPICAM allowing a direct comparison. Other HIPWAC measurements were made close in time to SPICAM orbital passes that occurred outside of the ground-based telescope observations and will also be used for comparison.
The team also performed measurements of the ozone abundance over the Syrtis Major region, which will help to constrain photochemical models in this region.
Analysis of the data from this recent campaign is ongoing, with another follow-up campaign of coordinated HIPWAC and SPICAM observations already scheduled for March this year.
Putting the compatibility of the data from these two instruments on a firm base will support combining the ground-based infrared measurements with the SPICAM ultraviolet measurements in testing the photochemical models of the Martian atmosphere. The extended coverage obtained by combining these datasets helps to more accurately test predictions by atmospheric models.
It will also quantitatively link the SPICAM observations to longer-term measurements made with the HIPWAC instrument and its predecessor IRHS (the Infrared Heterodyne Spectrometer) that go back to 1988. This will support the study of the long-term behavior of ozone and associated chemistry in the atmosphere of Mars on a timescale longer than the current missions to Mars.
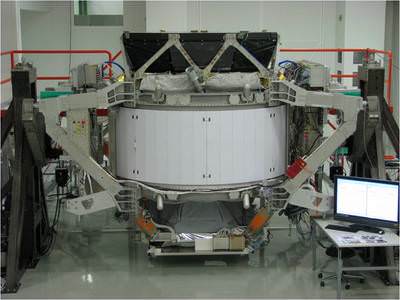
AMS-2 during integration activities at CERN facility in Switzerland. Credit: ESA
[/caption]
The long-awaited experiment that will search for dark matter is getting closer to heading to the International Space Station. The Alpha Magnetic Spectrometer (AMS) is undergoing final testing at ESA’s Test Centre in the Netherlands before being launched on the space shuttle to the ISS, currently scheduled for July, 2010. The AMS will help scientists better understand the fundamental issues on the origin and structure of the Universe by observing dark matter, missing matter and antimatter. As a byproduct, AMS will gather other information from cosmic radiation sources such as stars and galaxies millions of light years from our home galaxy.
ISS officials have been touting that science is now beginning to be done in earnest on the orbiting laboratory. The AMS will be a giant leap in science capability for the ISS. Not only is it the biggest scientific instrument to be installed on the International Space Station (ISS), but also it is the first magnetic spectrometer to be flown in space, and the largest cryogenically cooled superconducting magnet ever used in space. It will be installed on the central truss of the ISS.
AMS had been cut from the ISS program following the 2003 Columbia shuttle accident, but the outcry over the cancellation forced NASA to rethink their decision. Most of AMS’s $1.5-billion costs have been picked up the international partners that NASA wishes to stay on good terms with. 56 institutes from 16 countries have contributed to the AMS project, with Nobel laureate Samuel Ting coordinating the effort.
In an interview with the BBC, Ting said results from AMS may take up to three years to search for antimatter in other galaxies, and dark matter in our own.
The instrument was built at the European Organization for Nuclear Research (CERN) in Geneva, Switzerland. The first part of the tests was also conducted at CERN, when the detector was put through its paces using a proton beam from CERN’s Super Proton Synchrotron accelerator to check its momentum resolution and its ability to measure particle curvature and momentum.
AMS’s ability to distinguish electrons from protons was also tested. This is very important for the measurement of cosmic rays, 90% of which are protons and constitute a natural background for other signals that interest scientists. AMS will be looking for an abundance of positrons and electrons from space, one of the possible markers for dark matter.
Once the extensive testing is complete, AMS will leave ESTEC at the end of May on a special US Air Force flight to Kennedy Space Center in Florida. It will be launched to the ISS on the Space Shuttle Endeavour on flight STS-134, now scheduled for July.
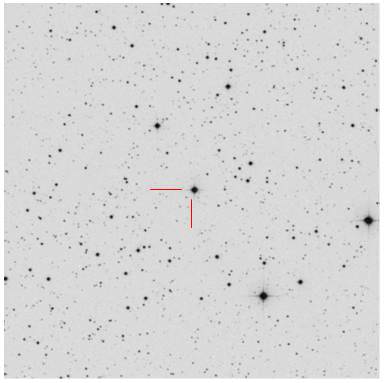
The planet XO-3b, and the star XO-3 positions - Credit : DSS survey
[/caption]Almost everyone the world over recognizes the letters X and O to represent a kiss and a hug, but this time the XO stands for Extrasolar Planet XO-3b. If you’d like an extra special “kiss and hug” for Valentine’s Day, then why not visit with Baraket Observatory on Februrary 13th as they present their live, on-line AstroCast of XO-3b transiting its parent star! This is definitely an event you won’t want to miss, so step inside for more information…
On February 13, 2010, Baraket Observatory will webcast (weather permitting) the transit of an extra solar planet named “XO-3b”. The event will be observed by using a highly sophisticated robotic telescope and a sensitive cooled CCD camera. The observatory will transfer live images of the transit as they’re being captured by the Bareket Internet EDU scope, while plotting its light curve through the site as the transit progress. This truly amazing process will give students and the general pubic a unique in side view to behind the observatory scenes, while presenting to the viewers how science is being done – all in real time. The event will be about 2 hours in duration, scheduled to take place at 19:00 UTC.
Live Astro-cast of the ExtraSolar Planet XO-3b Transit (European Server)
The American Association of Variable Star Observers (AAVSO) is collaborating with Bareket Observatory on variable-object studies, of which transiting exoplanets are a key element. The AAVSO has calibrated nearby stars in each of the known transiting exoplanet systems to act as local standards against which you can compare the host star for variability. The AAVSO is also working with the XO project team to study other variable stars that they have discovered during their exoplanet survey. Exoplanet transits are hard to detect, since the dip is only one percent or so in brightness, but with care, any amateur observer with a CCD camera can watch the transit of a planet around another star. A transit means the extra solar planet acts very similar to Venus, in our own solar system, when it passed in front of our Sun (in a direct geometrical line between the sun and the Earth), featuring a “mini eclipse”. While Venus can be easily observed against the solar disc, the extended XO-3b planet only presented as a dim singular dot in the sky. While it’s total brightness only slightly vary during the extra solar planet transit, for a relatively short period of time. The drop in the brightness is proportional to the planet’s surface. Usually within a 1% for a gaseous giant (Such as Jupiter) and as low as 0.01% for an Earth–sized planet. Searching for extra solar planets by detecting their transit is well within the possibilities of many today’s Earth based observatories and now watching a transit electronically is like a dream come true!
Flowers and candy for Valentine’s Day? Sure, that’s nice… But if you want to win an astronomer’s heart, give ’em a big XO!
This project is a part of the Bareket observatory Live-@stro outreach programs.
But do the WMAP data really, truly, absolutely contain evidence of anomalies, things that just do not fit within the six-parameters-and-a-model the WMAP team recently reported?
In a word, no.
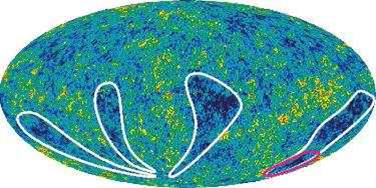
Seven Year Microwave Sky (Credit: NASA/WMAP Science Team)
Every second year since 2003 the WMAP science team has published a set of papers on their analyses of the cumulative data, and their findings (with the mission due to end later this year, their next set will, sadly, be their last). With time and experience – not to mention inputs from the thousands of other researchers who have picked over the data – the team has not only amassed a lot more data, but has also come to understand how WMAP operates far better. As a consequence, not only are the published results – such as limits on the nature of dark energy, and the number of different kinds of neutrinos – more stringent and robust, but the team has also become very au fait with the various anomalies reported.
For the first time, the team has examined these anomalies, in detail, and has concluded that the answer to the question, in their words, “are there potential deviations from ?CDM within the context of the allowed parameter ranges of the existing WMAP observations?” is “no”.
The reported anomalies the team examined are many – two prominent cold spots, strength of the quadrupole, lack of large angular scale CMB power, alignment of the quadrupole and octupole components, hemispherical or dipole power asymmetry, to name but a handful – but the reasons for the apparent anomalies are few.
“Human eyes and brains are excellent at detecting visual patterns, but poor at assessing probabilities. Features seen in the WMAP maps, such as the large Cold Spot I near the Galactic center region, can stand out as unusual. However, the likelihood of such features can not be discerned by visual inspection of our particular realization of the universe,” they write, and “Monte Carlo simulations are an invaluable way to determine the expected deviations within the ?CDM model. Claims of anomalies without Monte Carlo simulations are necessarily weak claims”.
Stephen Hawking’s initials in the CMB (Credit: NASA/WMAP Science Team)
An amusing example: Stephen Hawking’s initials (“SH”) can be clearly seen in the WMAP sky map. “The “S” and “H” are in roughly the same font size and style, and both letters are aligned neatly along a line of fixed Galactic latitude,” the team says; “A calculation would show that the probability of this particular occurrence is vanishingly small. Yet, there is no case to made for a non-standard cosmology despite this extraordinarily low probability event,” they dryly note.
Many of the reports of WMAP CMB anomalies would likely make for good teaching material, as they illustrate well the many traps that you can so easily fall into when doing after-the-fact (a posteriori) statistical analyses. Or, as the team puts it in regard to the Stephen Hawking initials: “It is clear that the combined selection of looking for initials, these particular initials, and their alignment and location are all a posteriori choices. For a rich data set, as is the case with WMAP, there are a lot of data and a lot of ways of analyzing the data.”
And what happens when you have a lot of data? Low probability events are guaranteed to occur! “For example, it is not unexpected to find a 2? feature when analyzing a rich data set in a number of different ways. However, to assess whether a particular 2? feature is interesting, one is often tempted to narrow in on it to isolate its behavior. That process involves a posteriori choices that amplify the apparent significance of the feature.”
So, does the team conclude that all this anomaly hunting is a waste of effort? Absolutely not! I’ll quote from the team’s own conclusion: “The search for oddities in the data is essential for testing the model. The success of the model makes these searches even more important. A detection of any highly significant a posteriori feature could become a serious challenge for the model. The less significant features discussed in this paper provided the motivation for considering alternative models and developing new analysis of WMAP (and soon Planck) data. The oddities have triggered proposed new observations that can further test the models. It is often difficult to assess the statistical claims. It may well be that an oddity could be found that motivates a new theory, which then could be tested as a hypothesis against ?CDM. The data support these comparisons. Of course, other cosmological measurements must also play a role in testing new hypotheses. No CMB anomaly reported to date has caused the scientific community to adopt a new standard model of cosmology, but claimed anomalies have been used to provoke thought and to search for improved theories.”
Primary source: Seven-Year Wilkinson Microwave Anisotropy Probe (WMAP) Observations: Are There Cosmic Microwave Background Anomalies? (arXiv:1001.4758). The five other Seven-Year WMAP papers are: Seven-Year Wilkinson Microwave Anisotropy Probe (WMAP) Observations: Cosmological Interpretation (arXiv:1001.4538), Seven-Year Wilkinson Microwave Anisotropy Probe (WMAP) Observations: Planets and Celestial Calibration Sources (arXiv:1001.4731), Seven-Year Wilkinson Microwave Anisotropy Probe (WMAP) Observations: Sky Maps, Systematic Errors, and Basic Results (arXiv:1001.4744), Seven-Year Wilkinson Microwave Anisotropy Probe (WMAP) Observations: Power Spectra and WMAP-Derived Parameters (arXiv:1001.4635), and Seven-Year Wilkinson Microwave Anisotropy Probe (WMAP) Observations: Galactic Foreground Emission (arXiv:1001.4555). Also check out the official WMAP website.
Arabidopsis plants imaged in white light (left) and Green Fluorescent Protein (GFP) excitation illumination, right. The arabidopsis plants are also part of the Plant Habitat-03 experiment. Image provided by Anna-Lisa Paul, Ph.D. and Robert Ferl, Ph.D., Department of Horticultural Sciences, University of Florida.
[/caption]
Glowing plants from space? Sounds like science fiction or the next B-horror movie. But glowing plants, willow trees, potential biofuels and more are being studied on the International Space Station and are part of key research in biotechnology, physiology, life sciences, and physical sciences going on in space. “This is not your grandfather’s backyard garden,” said Dr. Robert Ferl from the University of Florida, Gainesville.” We are now understanding fundamental biological principals that essentially can only be studied when you leave the surface of the Earth.”
Scientists are abuzz this week with the newly proposed 2011 NASA budget which extends the life of the International Space Station to 2020, and perhaps beyond. “The possibility of an expanded budget for full utilization of the space station means that scientists can do the research and also the technology development that will fulfill the complete potential of ISS,” said Julie Robinson, program scientists for ISS, “and that we will be able to bring back to Earth all the benefits that our new knowledge and technology can provide.”
At a press briefing today at Kennedy Space Center, a group of scientists shared current and future science investigations for the ISS, and the highlight was seeing some plants that actually glow in different colors to give scientists cues to what is taking place within the plant. Robert Ferl at a press conference at KSC with a device from the APEX-TAGES experiment. Image: Nancy Atkinson
The Advanced Plant EXperiments on Orbit – Transgenic Arabidopsis Gene Expression System (APEX-TAGES) investigation uses Arabidopsis thaliana, or thale cress that has genetically modified so it can glow.
“Plants don’t talk a lot,” said Ferl, “so molecular biologists have been able to equip plants with the tools to have them communicate with us. Plants can glow with certain colors when certain genes are activated, when things happen like changes in their environments.”
APEX-TAGES uses a new real-time imaging system in conjunction with the “glowing” that removes the need for harvesting thereby allowing the plant to continue to grow and making it possible to follow the development of stress in a plant over time. The experiment also doesn’t require a lot of time and interaction from the ISS crew, as digital images can be transmitted from the site of the experiment to the site of the researchers.
Plants get cues from things on Earth, such as light, gravity, humidity. The question is, Ferl said –which applies to all biology — is what happens to terrestrial biology when it is no longer on Earth? Key to the research is understanding the adaptations that have to take place in order for plants in space to continue to grow successfully and produce fruit.
“What are the limts to terrestrial biology? How far can it travel and explore?” said Ferl “50% of plant DNA is like ours, and 80% of plant genes are like ours. So plants can support us with food, air, and water revitalization, but they are interesting because by studying them we learn more about what happens to complex biology as it leaves the surface of the earth.” Perry Johnson-Green with the Canadian space agency displays the type of Willow trees grown in the ISS. Image: Nancy Atkinson
Also highlighted at the briefing were studies of plant cell metabolism of a potential biofuel plant, Jatropha, and research done on the first trees ever grown on the space station, Canadian Cambium willow trees, that was sponsored by the Canadian Space Agency and performed on orbit by Canadian astronaut Robert Thirsk, who just returned from the ISS in November.
Robinson also discussed an experiment on the ISS that found a better method of producing microencapsulated drugs for cancer and diabetes. A patent was issued at the end of 2009 and clinical trials are now being scheduled.
With $50 million of the proposed budget going directly to ISS, as well as additional funds coming from the NASA’s Science Directorate and technology development, Robinson said that scientists and technology developers will be fully utilizing the ISS as a National Lab in the coming years.
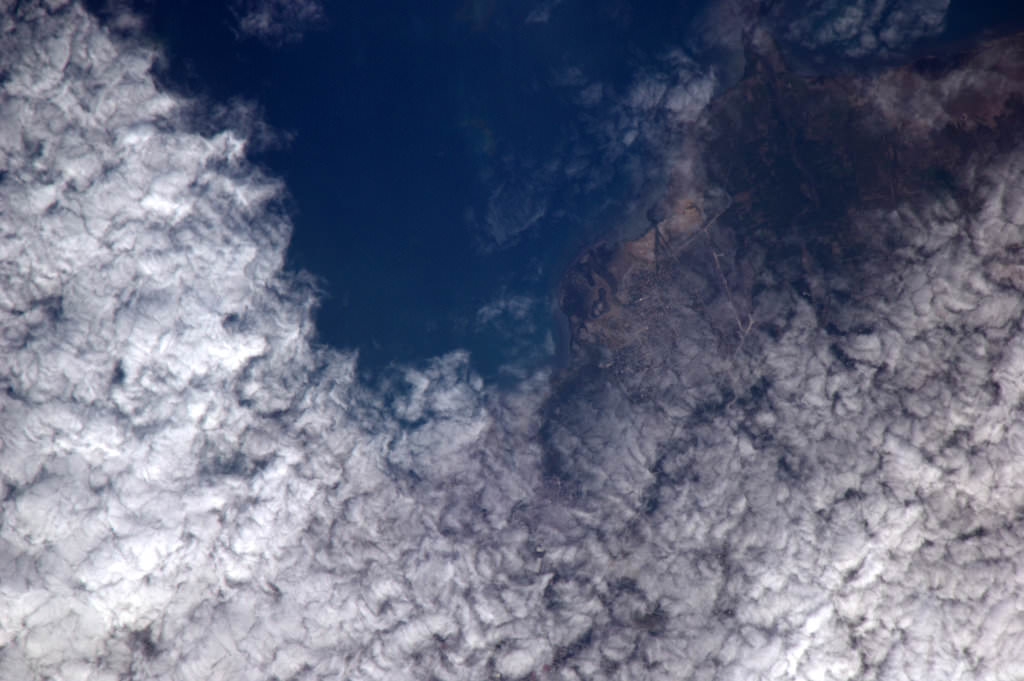
Twitpic of Golden Gate Bridge in San Francisco, CA from the ISS on Jan 30, 2010 Credit Astronaut Soichi Noguchi
[/caption]
“Golden Gate Bridge, San Fransisco, CA. Beautiful shadow :-),” tweeted Astronaut Soichi Noguchi along with a live image he shot from space from inside the International Space Station.
The 5 man crew comprising Expedition 22 aboard the ISS now have the capability to transmit live, unfiltered views and comments from space. And whats more is that starting on Feb. 1 they’ll be streaming live video from the outpost, orbiting some 220 miles above the earth while speeding along at 17,500 MPH.
Astronaut TJ Creamer twittered the first unassisted post only 1 week ago on Jan 22.
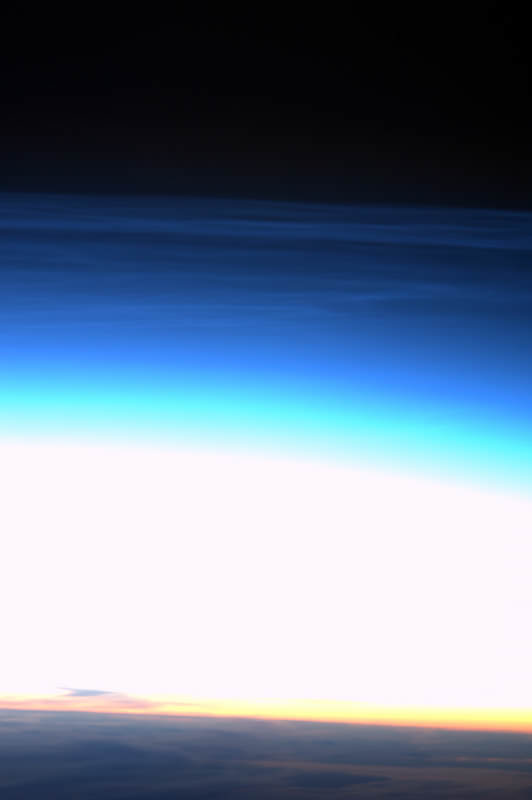
Yesterday afternoon (Jan 30) he tweeted about his next picture targets, “Gonna try to take some pix of the Moon and the mesospheric clouds.”
“Noctilucent clouds. Antarctic. Priceless.” Credit: Astronaut Soichi NoguchiNoguchi sent down other beautiful shots, including “priceless” noctilucent clouds above Antarctica, city lights above Tokyo, and Port-Au-Prince, Haiti with “prayers” from the crew. He shot these In between his station work.
Noguchi tweeted on Jan 29, that he was working with the Japanese robotic arm (JEMRMS) which is attached to Japan’s giant “Kibo” science research module. “JMSRMS is working just fine-just like sim on the ground. I am very excited. The task is to check the status of external experiment facility. KOOL:-).” Kibo is the largest research laboratory on the ISS.
You can follow all the tweets from three of the crew; Astronauts Soichi Noguchi, TJ. Creamer and Jeff Williams at this link: http://twitter.com/NASA_Astronauts
“Great Saturday on board ISS. Taking photos of Earth, preparing for Shuttle arrival, Station maintenance, and calls home.” Reports Jeff Williams in the newest tweet.
“Our internal cameras wlll stream to the Web beginning Monday [Feb 1] ! Wave when you see us!! :)” tweets Creamer.
The live video will be available during all crew duty hours and when the complex is in contact with the ground through its high-speed communications antenna and NASA’s Tracking and Data Relay Satellite System. Live streaming video of the earth and the stations exterior has been available since March 2009.
Meanwhile, everything remains on schedule for the Feb. 7 launch of STS 130 to deliver the Tranquility and Cupola modules.


")


")
")