[/caption]
From a JPL press release.
NASA has released the first-ever airborne radar images of the deformation in Earth’s surface caused by a major earth quake — the magnitude 7.2 temblor that rocked Mexico’s state of Baja California and parts of the American Southwest on April 4, 2010. The data reveal that in the area studied, the quake moved the Calexico, Calif., region in a downward and southerly direction up to 80 centimeters (31 inches).
A science team at NASA’s Jet Propulsion Laboratory, Pasadena, Calif., used the JPL-developed Uninhabited Aerial Vehicle Synthetic Aperture Radar (UAVSAR) to measure surface deformation from the quake. The radar flies at an altitude of 12.5 kilometers (41,000 feet) on a Gulfstream-III aircraft from NASA’s Dryden Flight Research Center, Edwards, Calif.
The team used a technique that detects minute changes in the distance between the aircraft and the ground over repeated, GPS-guided flights. The team combined data from flights on Oct. 21, 2009, and April 13, 2010. The resulting maps are called interferograms.
The April 4, 2010, El Mayor-Cucapah earthquake was centered 52 kilometers (32 miles) south-southeast of Calexico, Calif., in northern Baja California. It occurred along a geologically complex segment of the boundary between the North American and Pacific tectonic plates. The quake, the region’s largest in nearly 120 years, was also felt in southern California and parts of Nevada and Arizona. It killed two, injured hundreds and caused substantial damage. There have been thousands of aftershocks, extending from near the northern tip of the Gulf of California to a few miles northwest of the U.S. border. The area northwest of the main rupture, along the trend of California’s Elsinore fault, has been especially active, and was the site of a large, magnitude 5.7 aftershock on June 14.
UAVSAR has mapped California’s San Andreas and other faults along the plate boundary from north of San Francisco to the Mexican border every six months since spring 2009, looking for ground motion and increased strain along faults. “The goal of the ongoing study is to understand the relative hazard of the San Andreas and faults to its west like the Elsinore and San Jacinto faults, and capture ground displacements from larger quakes,” said JPL geophysicist Andrea Donnellan, principal investigator of the UAVSAR project to map and assess seismic hazard in Southern California.
Each UAVSAR flight serves as a baseline for subsequent quake activity. The team estimates displacement for each region, with the goal of determining how strain is partitioned between faults. When quakes do occur during the project, the team will observe their associated ground motions and assess how they may redistribute strain to other nearby faults, potentially priming them to break. Data from the Baja quake are being integrated into JPL’s QuakeSim advanced computer models to better understand the fault systems that ruptured and potential impacts to nearby faults, such as the San Andreas, Elsinore and San Jacinto faults.
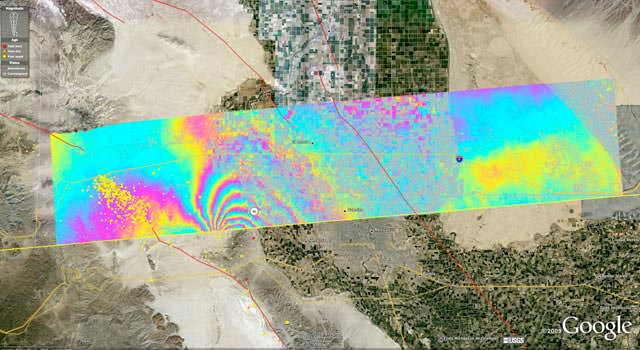
One figure (Figure 1) shows a UAVSAR interferogram swath measuring 110 by 20 kilometers (69 by 12.5 miles) overlaid atop a Google Earth image. Each colored contour, or fringe, of the interferogram represents 11.9 centimeters (4.7 inches) of surface displacement. Major fault lines are marked in red, and recent aftershocks are denoted by yellow, orange and red dots.
The quake’s maximum ground displacements of up to 3 meters (10 feet) actually occurred well south of where the UAVSAR measurements stop at the Mexican border. However, these displacements were measured by JPL geophysicist Eric Fielding using synthetic aperture radar interferometry from European and Japanese satellites and other satellite imagery, and by mapping teams on the ground.
Scientists are still working to determine the exact northwest extent of the main fault rupture, but it is clear it came within 10 kilometers (6 miles) of the UAVSAR swath, close to the point where the interferogram fringes converge. “Continued measurements of the region should tell us whether the main fault rupture has moved north over time,” Donnellan said.
An enlargement of the interferogram is shown in another figure (Figure 2), focusing on the area where the largest deformation was measured. The enlargement, which covers an area measuring about 20 by 20 kilometers (12.5 by 12.5 miles), reveals many small “cuts,” or discontinuities, in the fringes. These are caused by ground motions ranging from a centimeter to tens of centimeters (a few inches) on small faults. “Geologists are finding the exquisite details of the many small fault ruptures extremely interesting and valuable for understanding the faults that ruptured in the April 4th quake,” said Fielding. Another figure, (Figure 3) shows a close-up of the region where the magnitude 5.7 aftershock struck.
“UAVSAR’s unprecedented resolution is allowing scientists to see fine details of the Baja earthquake’s fault system activated by the main quake and its aftershocks,” said UAVSAR Principal Investigator Scott Hensley of JPL. “Such details aren’t visible with other sensors.”
UAVSAR is part of NASA’s ongoing effort to apply space-based technologies, ground-based techniques and complex computer models to advance our understanding of quakes and quake processes. The radar flew over Hispaniola earlier this year to study geologic processes following January’s devastating Haiti quake. The data are giving scientists a baseline set of imagery in the event of future quakes. These images can then be combined with post-quake imagery to measure ground deformation, determine how slip on faults is distributed, and learn more about fault zone properties.
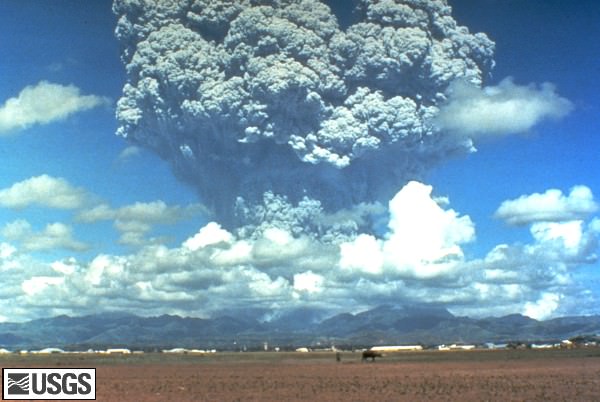
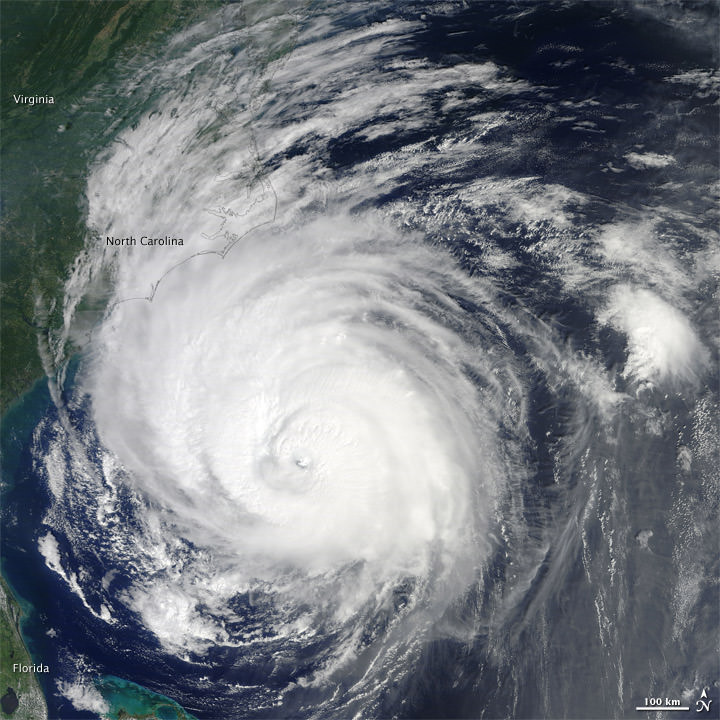
UAVSAR is also serving as a flying test bed to evaluate the tools and technologies for future space-based radars, such as those planned for a NASA mission currently in formulation called the Deformation, Ecosystem Structure and Dynamics of Ice, or DESDynI. That mission will study hazards such as earth quakes, volcanoes and landslides, as well as global environmental change.
See all the maps at this webpage.


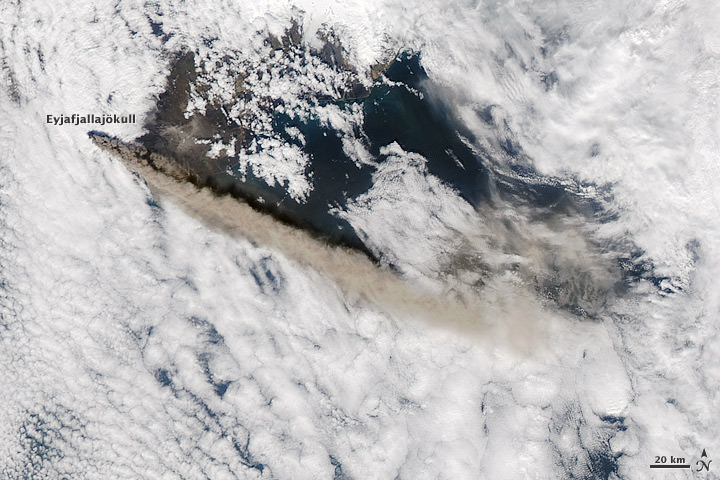

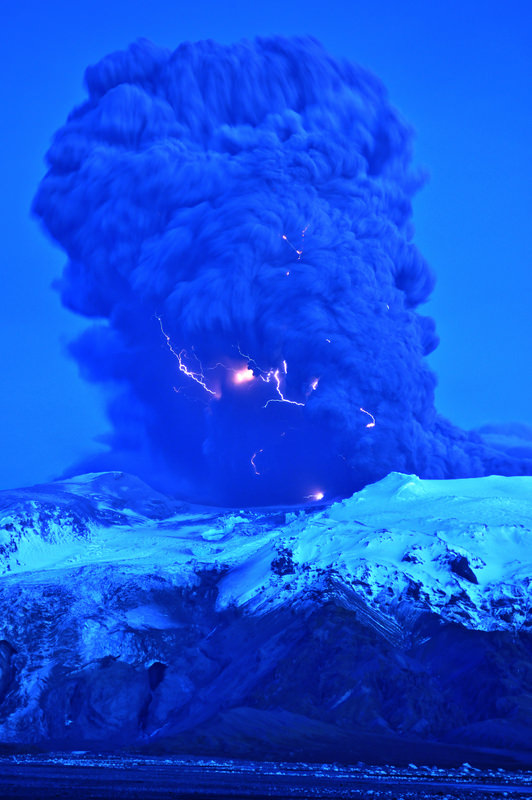
. Image courtesy of and copyright Snaevarr Gudmundsson.")


