Model projections of wave heights from the Japan quake on Friday. Image from NOAA. Click image for higher resolution.
The massive magnitude 8.9 earthquake that struck off the east coast Japan’s main island on March 11, 2011 set in motion a fierce tsunami that may have claimed thousands of lives, and sent tsunami warnings all across the Pacific basin, thousands of kilometers away from the quake’s epicenter. How do earthquakes trigger such enormous tsunami events, and how can scientists predict where these massive waves might travel? Universe Today talked with Anne Sheehan, who is a professor of geological sciences at University of Colorado at Boulder, and is also affiliated with the Cooperative Institute for Research in Environmental Sciences, as well as getting input from David Admiraal, an associate professor of Engineering at the University of Nebraska Lincoln.
We’re getting a lot of visitors to our site today, many searching for information about earthquakes, tsunamis, and the ‘SuperMoon’ phenomenon. Just to be clear, the Moon did not cause the earthquake in Japan. Several scientists have posted articles online today clarifying the topic, and all of them, in no uncertain terms, agree that the the upcoming perigee of the Moon — where it is closer than usual in its orbit to Earth — had nothing to do with the earthquake and ensuing tsunami. Tammy discussed this yesterday, but as we often do, we’ll also point you in the direction of an article by astronomer Phil Plait about this topic, and another by Ben Goldacre, who completely debunks an article that appeared in the Daily Mail about the possibility of a connection between the two events.
In addition, Dr. Jim Garvin, chief scientist at NASA’s Goddard Space Flight Center, has provided some answers to questions about the ‘supermoon’ phenomenon, below:
Question: What is the definition of a supermoon and why is it called that?
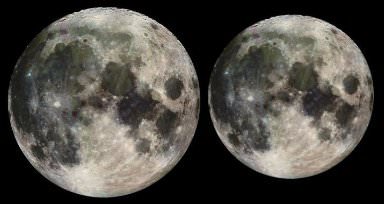
Garvin: ‘Supermoon’ is a situation when the moon is slightly closer to Earth in its orbit than on average, and this effect is most noticeable when it occurs at the same time as a full moon. So, the moon may seem bigger although the difference in its distance from Earth is only a few percent at such times.
It is called a supermoon because this is a very noticeable alignment that at first glance would seem to have an effect. The ‘super’ in supermoon is really just the appearance of being closer, but unless we were measuring the Earth-Moon distance by laser rangefinders (as we do to track the LRO [Lunar Reconnaissance Orbiter] spacecraft in low lunar orbit and to watch the Earth-Moon distance over years), there is really no difference. The supermoon really attests to the wonderful new wealth of data NASA’s LRO mission has returned for the Moon, making several key science questions about our nearest neighbor all the more important.
Question: Are there any adverse effects on Earth because of the close proximity of the moon?
Garvin: The effects on Earth from a supermoon are minor, and according to the most detailed studies by terrestrial seismologists and volcanologists, the combination of the moon being at its closest to Earth in its orbit, and being in its ‘full moon’ configuration (relative to the Earth and sun), should not affect the internal energy balance of the Earth since there are lunar tides every day. The Earth has stored a tremendous amount of internal energy within its thin outer shell or crust, and the small differences in the tidal forces exerted by the moon (and sun) are not enough to fundamentally overcome the much larger forces within the planet due to convection (and other aspects of the internal energy balance that drives plate tectonics). Nonetheless, these supermoon times remind us of the effect of our ‘Africa-sized’ nearest neighbor on our lives, affecting ocean tides and contributing to many cultural aspects of our lives (as a visible aspect of how our planet is part of the solar system and space).
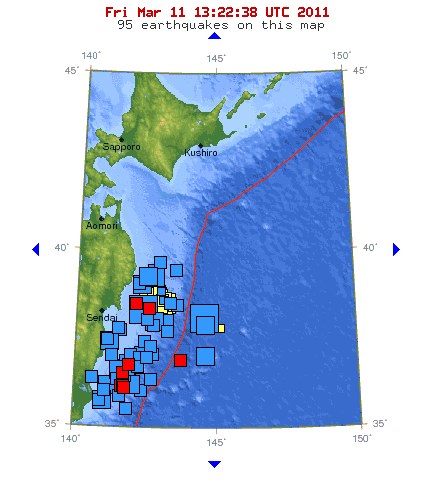
Earthquake map from the USGS of recent quake activity around Japan. Credit: USGS
[/caption]
An 8.9-magnitude earthquake struck off the coast of northern Japan on March 11, one of the strongest to ever hit Japan. The massive quake has triggered tsunamis not only in Japan, but around the Pacific Basin. Walls of water and debris have inundated coastal areas of Japan, and tsunami warnings were issued for at least 20 countries and numerous Pacific islands, including coastal Russia, the western coast of Canada and the US, the Marcus Islands, Taiwan, Guam and the Hawaiian Islands, where a full coastal evactuation has been taking place throughout early Friday morning. Strong aftershocks, as strong as 6.5-magnitude continue to shake the region, (the latest U.S. Geological Survey map, above, shows 95 recent quakes in the area) and at least one nuclear power plant in Japan may be encountering problems. Images coming from Japan show widespread damage from both the quakes and the tsunamis.
The USGS reported that the epicenter of the earthquake was 373 kilometers (231 miles) northeast of Tokyo and 130 km (80 miles) east of Sendai, Honshu. Police reports from Sendai say that so 200-300 bodies have been recovered, but the total death toll will likely be much, much higher. Reports say this is the 6th largest earthquake ever monitored, and the largest in Japan in over 140 years.
Tokyo did not suffer much damage, but in northern Japan, many areas were devastated. Compounding the damage was a wall of water that rushed inland of the island nation, leveling houses and washing away boats, cars and other debris. Click here to see some shocking images from the New York Times.
Reports says Japan is evacuating thousands of people from nearby a nuclear power plant, but the current condition of the reactor core is unknown at this time. Four reactors are located near the Earthquake area. The reactors were shut down, and no leaks have been found so far, but the cooling system for the reactors may not be working correctly.
Reports via Twitter say the roof may have collapsed at JAXA Tsukuba Space Center.
Tsunami waves have now begun to wash ashore in the Hawaiian Islands. The first waves are not necessarily the strongest; waves are predicted to be 2-3 meters (6-8 ft.) in Hawaii. Tsunamis are very hard to predict, and the USGS says wave heights can vary widely.
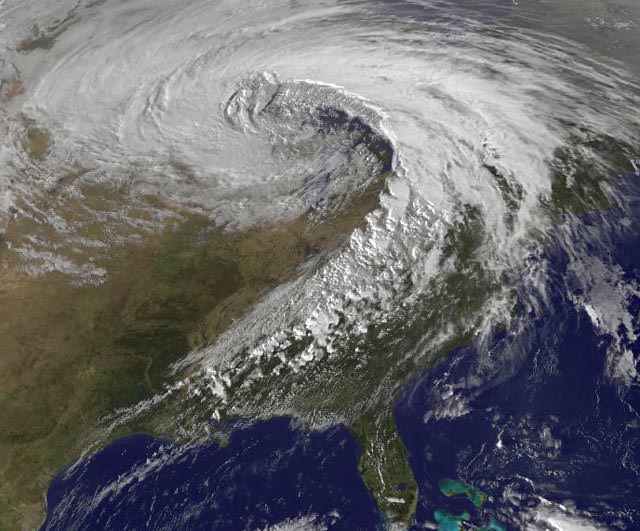
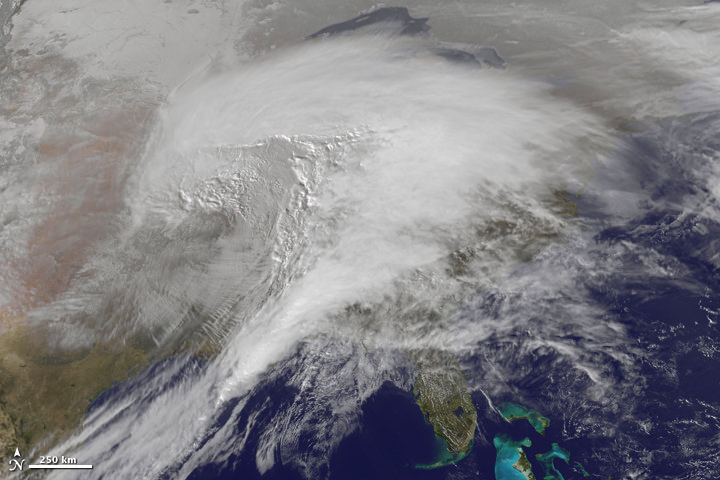
Here's an image from the top animation, the storm as seen on January 31, 2011
To speak in the vernacular of the peasantry, this storm was a whopper. Heavy snow, ice, freezing rain, and frigid wind battered about two thirds of the United States, making it “a winter storm of historic proportions,” said the National Weather Service. This animation—made with images from the NOAA-NASA GOES 13 satellite—shows the giant storm developing and moving across the country between January 31 and February 2. Below is another video view from GOES-East satellite, which includes infrared water vapor imagery from January 29 -February 1, 2011.
And there’s also an update on Cyclone Yasi.
[/caption]
Cyclone Yasi as seen on Feb. 1, 2011 from The Moderate Resolution Imaging Spectroradiometer (MODIS) on NASA’s Terra satellite
Yasi weakened after coming ashore early on Thursday morning but was still strong enough to produce high winds and tidal surges that sent waves crashing deep into seaside communities. Thankfully, so far no lives have been lost because of this storm. Officials said lives were saved because after days of dire warnings people heeded directions to flee to evacuation centers or bunker themselves at home. Track the storm on WeatherUnderground, and read more on the latest news from Yasi on The Guardian.
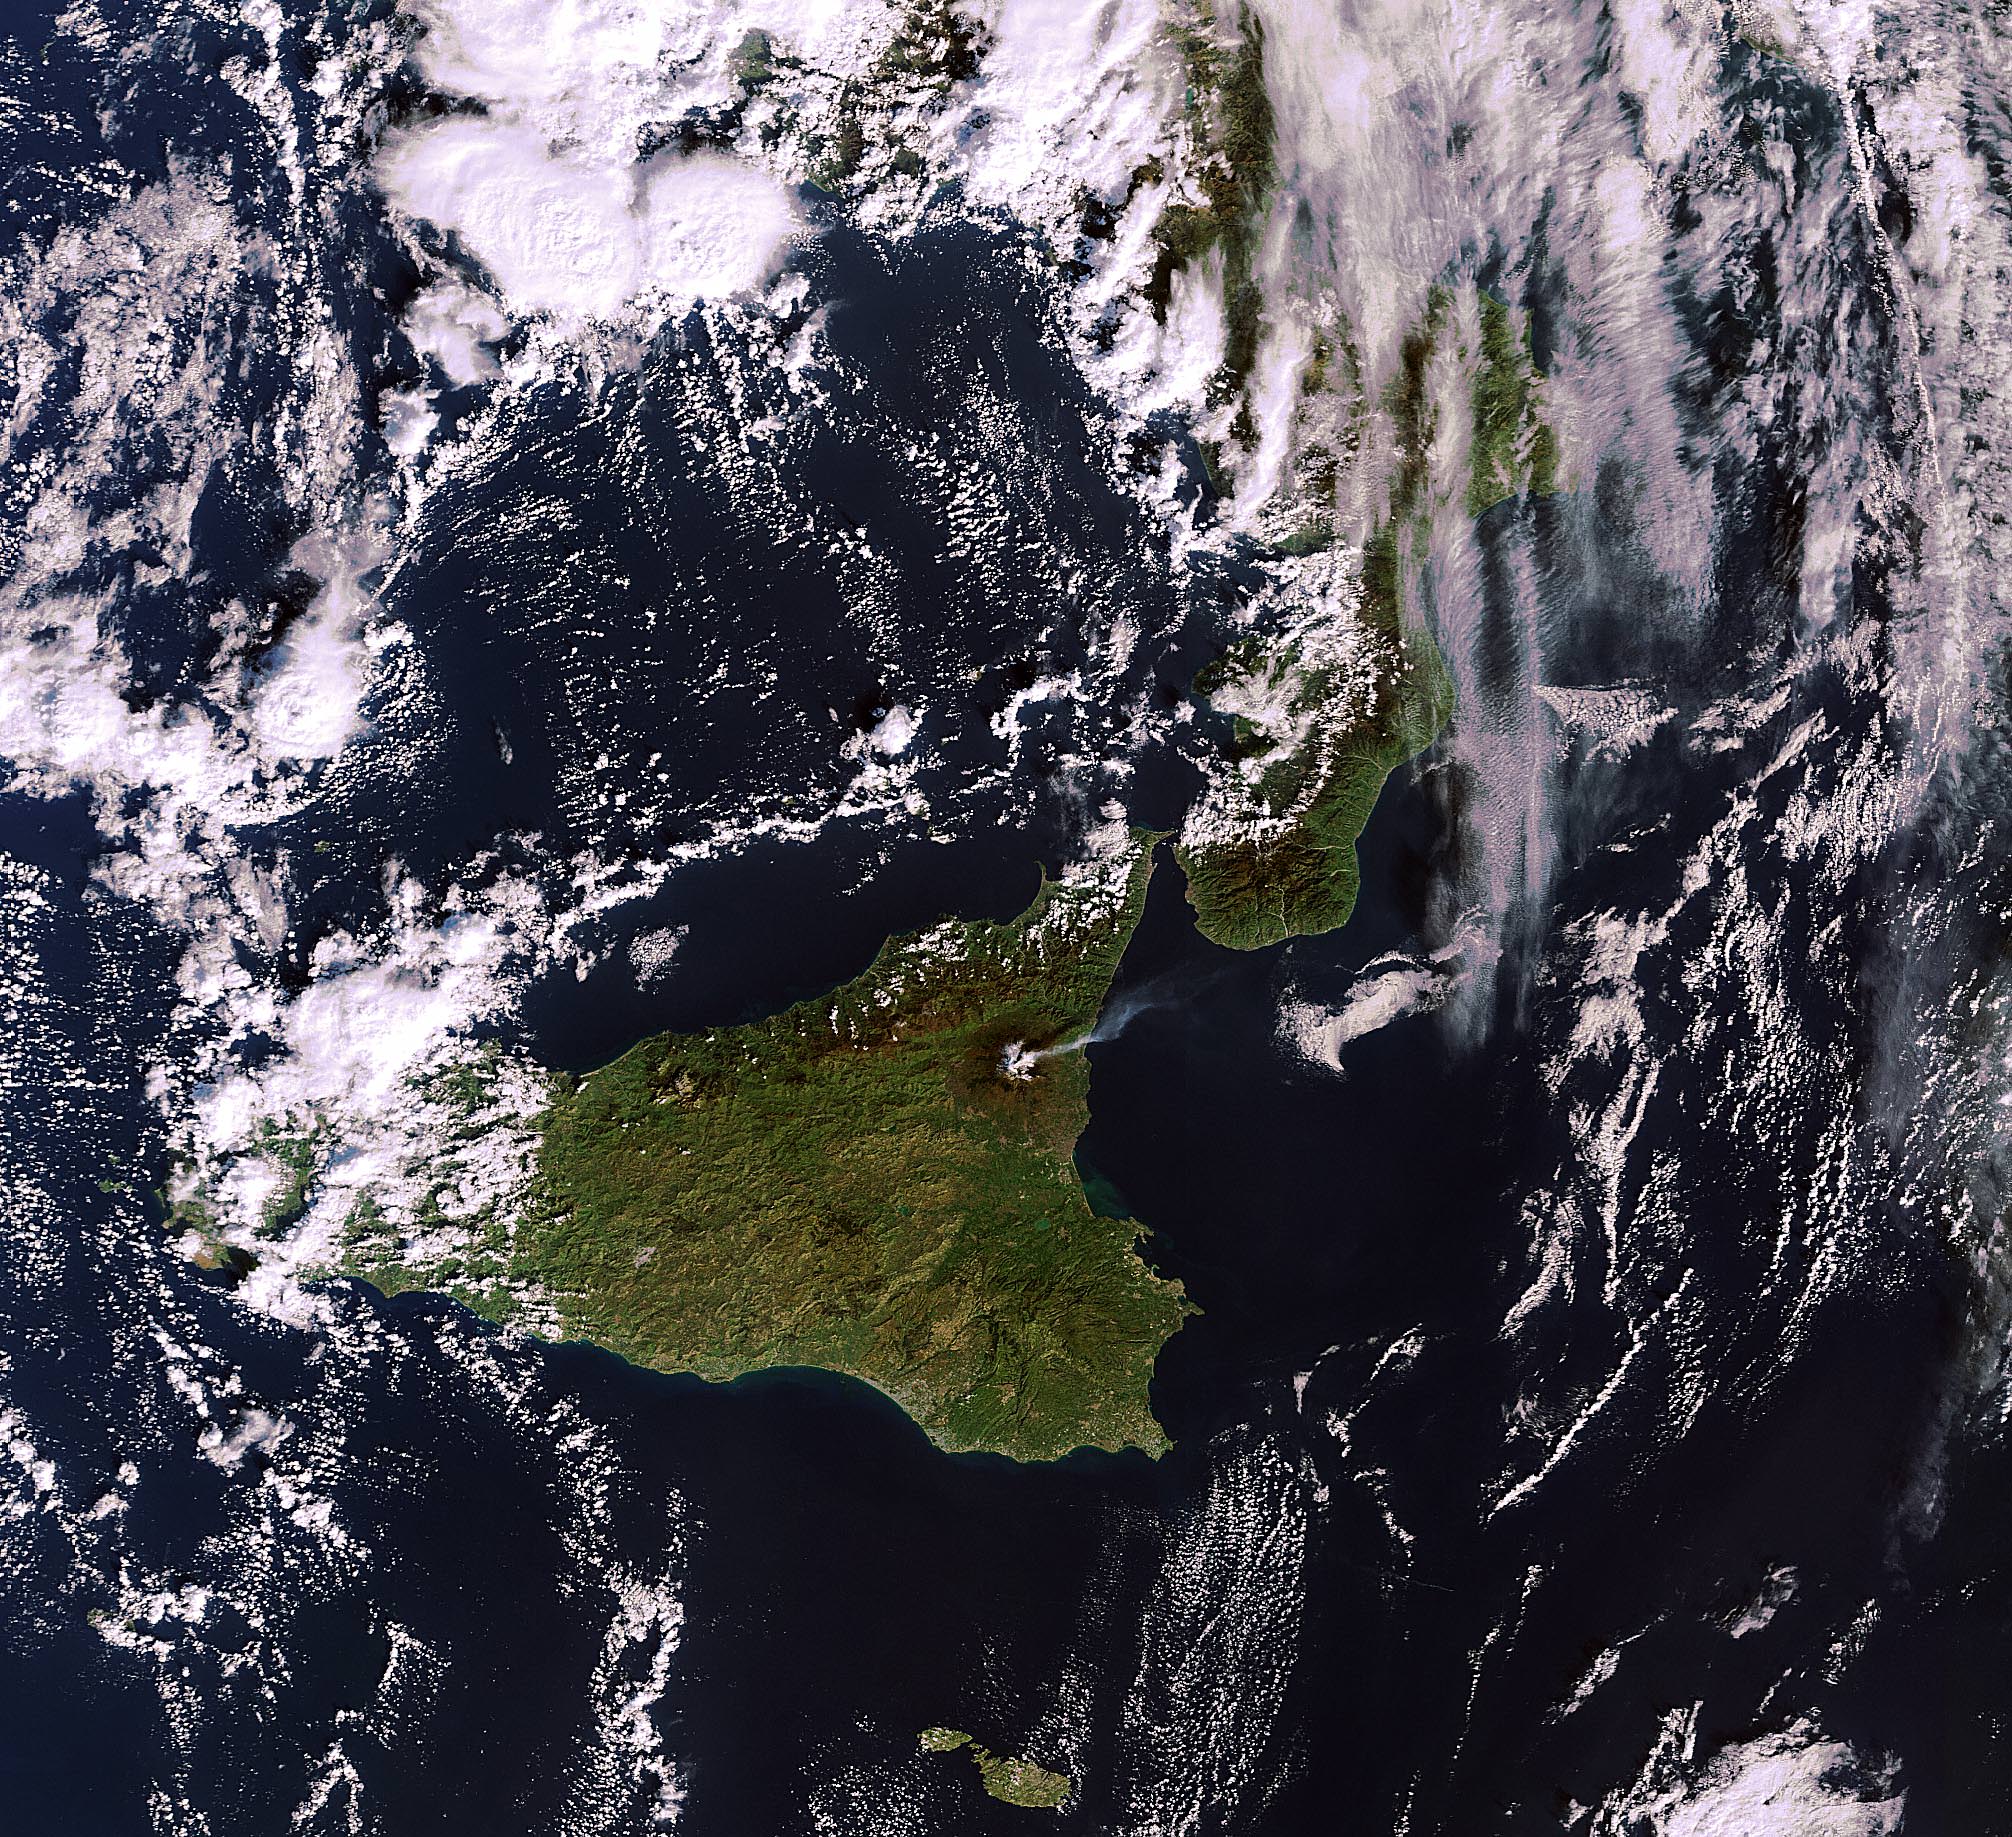
Volcanic eruptions at Mt. Etna from orbiting NASA Terra Satellite. Acquired on January 11, 2011. NASA Earth Observatory Image of the Day on January 15, 2011. Credit: NASA Terra Satellite
[/caption]
Spectacular eruptions from Mt Etna are spewing massive quantities of lava, smoke and ash many hundreds of meters high into the skies above the island of Sicily. Mt Etna is the most active volcano in Europe and one of the most active on all of Earth. The volcano rumbled to life again this week on the evening of January 12, 2011 and lit up the night sky. Mt Etna is 3350 meters high and located on the northeast coast of Sicily near the boot of Italy (see above, below).
Updated: comment or send me your Etna erupting photos/accounts to post below.
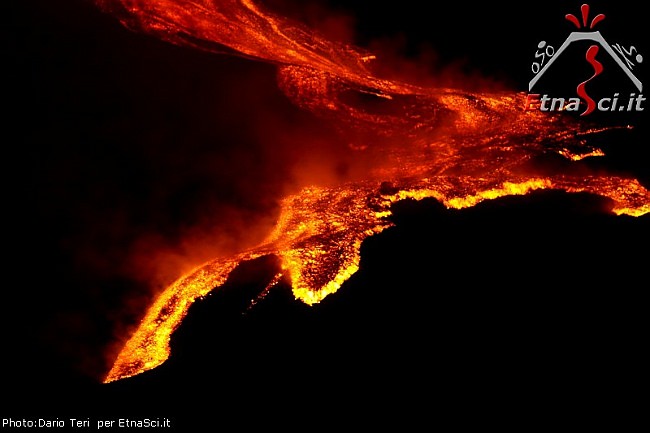
This fearsome natural wonder is providing an awe inspiring show from both Earth and Space. Local residents and lucky tourists nearby took stunning videos and photos (below) showing fountains of brilliant lava eruptions streaming mightily from the volcano.
This Envisat MERIS image, acquired on 11 January 2011, shows the plume of smoke billowing into the atmosphere from Mount Etna, Sicily, Italy. Activity gradually increased the following day, peaking in the evening. Credits: ESA
Click to Enlarge all images
Amazing photos from space were captured by Earth orbiting satellites from NASA and ESA. NASA’s Terra satellite took the above image on Jan. 11 as Mt Etna was spewing forth smoke or ash just prior to the volcanic eruptions on Jan. 12. The photo of Etna is NASA’s Earth Observatory Image of the Day, today, Jan. 15, 2011.
ESA’s Envisat likewise snapped a gorgeous view of the billowing plume of smoke rising to space (photo at left) and the international crew aboard the ISS, which currently includes Italian astronaut Paolo Nespoli. Perhaps he’ll send us a shot !
Local news and eyewitness accounts say that tremors from the volcano began increasing on Jan. 11. Emissions of volcanic gases and water vapor have been ongoing since late September 2010. The sounds of explosive tremors from deep inside were also detected months ago.
This sizzling hot video – “Etna at Maximum Activity” – is set to music and records the magnificent flowing streams of lava and the thunderous sounds of the crackling, explosive eruptions. Be sure to view at full screen, then just sit back and enjoy !
Plumes of volcanic ash from the eruptions spread across Sicily and forced the closure of the local Fontanarossa airport – nearby to the city of Catania, which is 24 kilometers away.
Rumblings of Mt Etna have been recorded in historical documents dating back to about 1500 BC.
Another short, dramatic video with the raw sounds of the eruption from a group of German tourists visiting the beautiful city of Taormina, Sicily
Eyewitness Description:
“Mount Etna erupted in the evening of January 12, 2011 for around four hours, providing an amazing scenery. We shot this unique video from Taormina on January 12, 2011 at 11.45 p.m. and uploaded it on YouTube.
On the evening of 11th January 2011 an increase in volcanic tremor was recorded at the summit of the volcano. The recorded seismic activity reached a peak at 7 a.m. on 12th January when the source moved from north of NE crater to the SE crater. The eruption started with strombolian explosive activity at SE crater at around 9.p.m. Lava overflowed the eastern rim of SE crater and fed a flow that moved toward the western wall of the Valle del Bove (Valley of the oxen), an ancient huge uninhabited depression on the NE side of the volcano.
The Sicilian communities near the volcano were not threatened by this latest fascinating eruption. Best place to watch the fascinating eruptions of Mount Etna is the town of Taormina, nestled on a hill at 220 meters / 722 feet above the sea level and at a safe linear distance of approx. 28 Km / 17,4 miles from the top craters of the Sicilian volcano.” Fearsome lava eruptions spewing from Mt Etna on Jan. 11, 2011
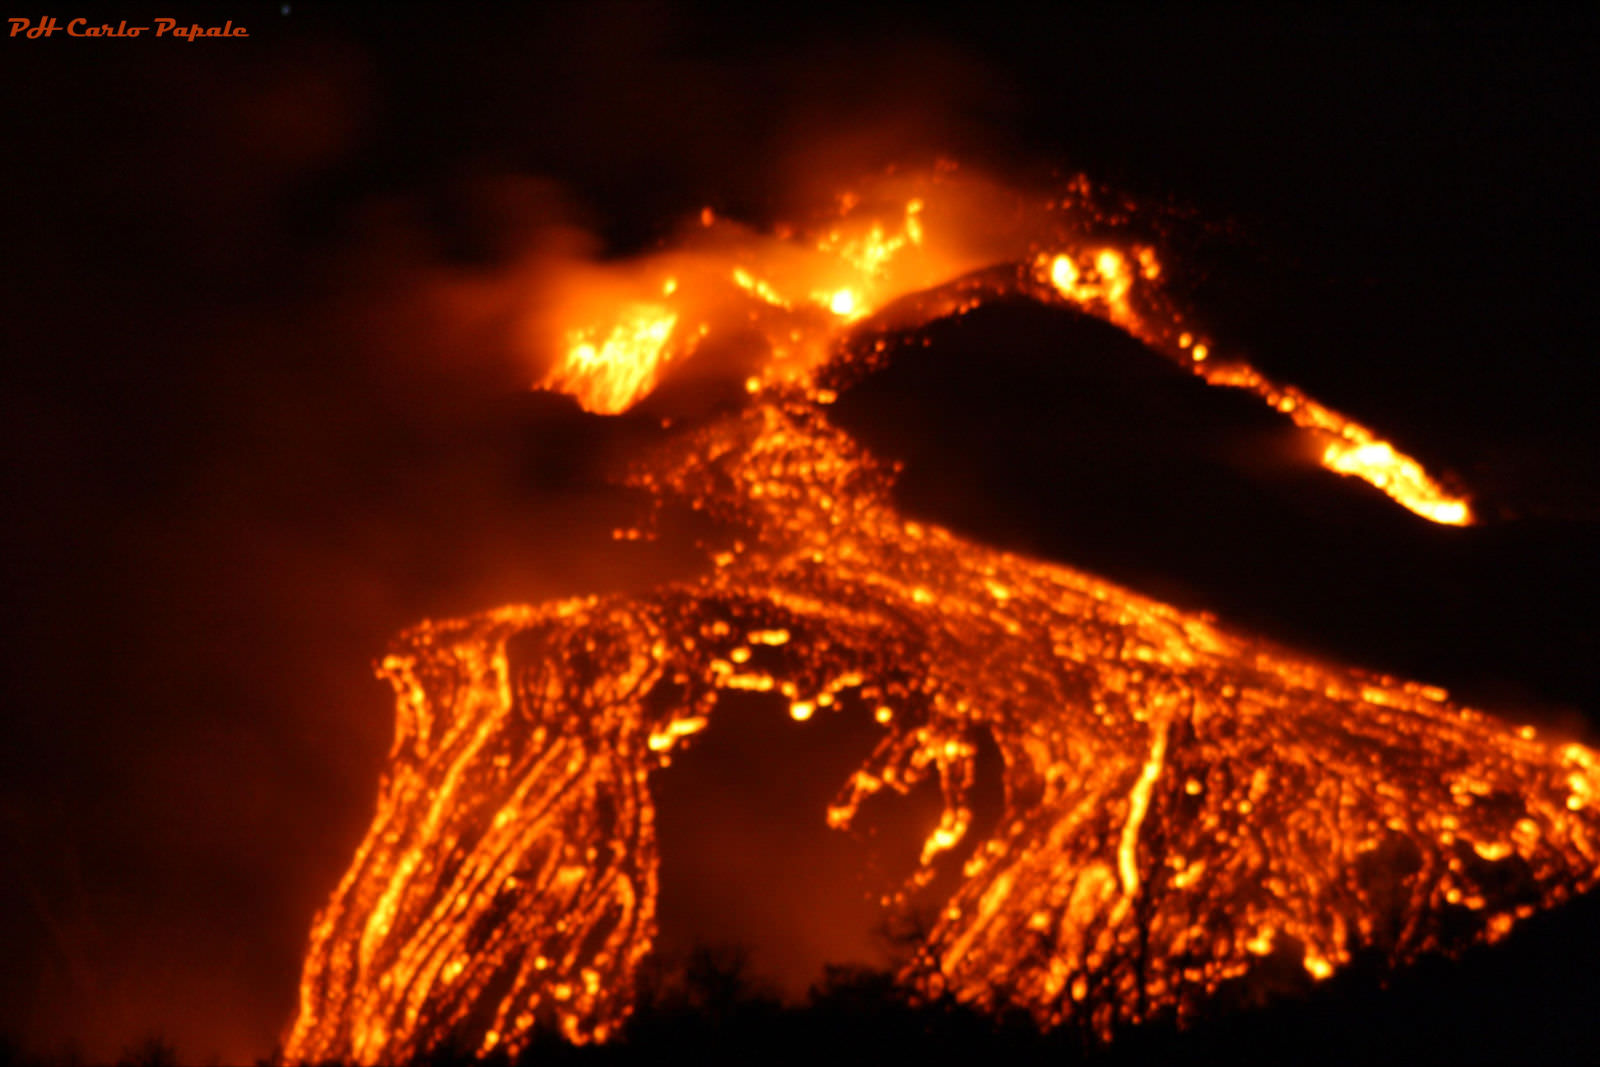
A few years back, I visited Mt Etna and was incredibly lucky to witness this spectacle of nature myself. It was an unforgettable experience to see the glowing red-orange colored lava flowing out from the bowels of the Earth. It was like a living being with circulating blood.
In the excitement, I did something that in retrospect was incredibly stupid. I stood on a ledge, perhaps 50 cm thick, right above the porthole of the scalding hot lava erupting from the earth beneath my feet. Many others did too.
Sicily is a lovely place of manmade and natural wonders. Don’t pass up an opportunity to see Etna aflame
Look at Etnaweb (in Italian, but Universal) for a fantastic collection of local photos and webcams of the eruption.
Volcanic eruptions are breathtaking events to behold. The residual plumes of smoke and ash can stay aloft for many years and can also effect how we see other astronomical events such as our view of solar and lunar eclipses.
For a more tranquil view of Earth and inspiration from Carl Sagan, click here
NASA’s Spirit robot is positioned next to an ancient and extinct volcanic feature on Mars. Learn more here
Can you envision a place hotter than Etna ? … A scorching, molten hellish world where the temperatures are unimaginably hot
Comment or send me your photos and eyewitness accounts of erupting Mt Etna
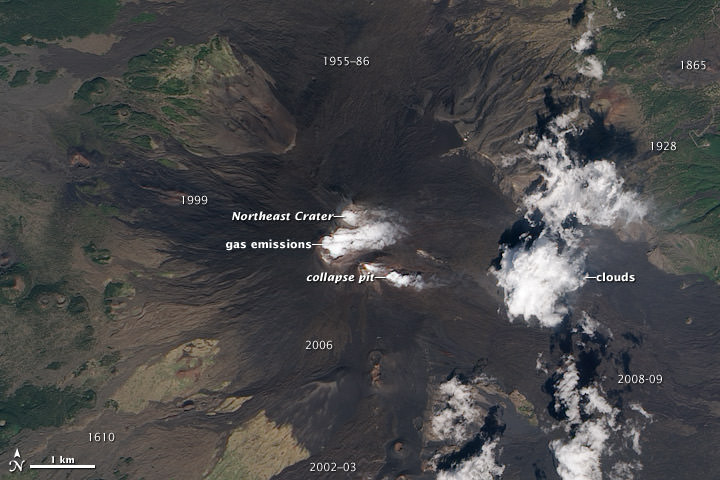
Signs of activity at the summit of Mount Etna, Europe’s most active volcano.
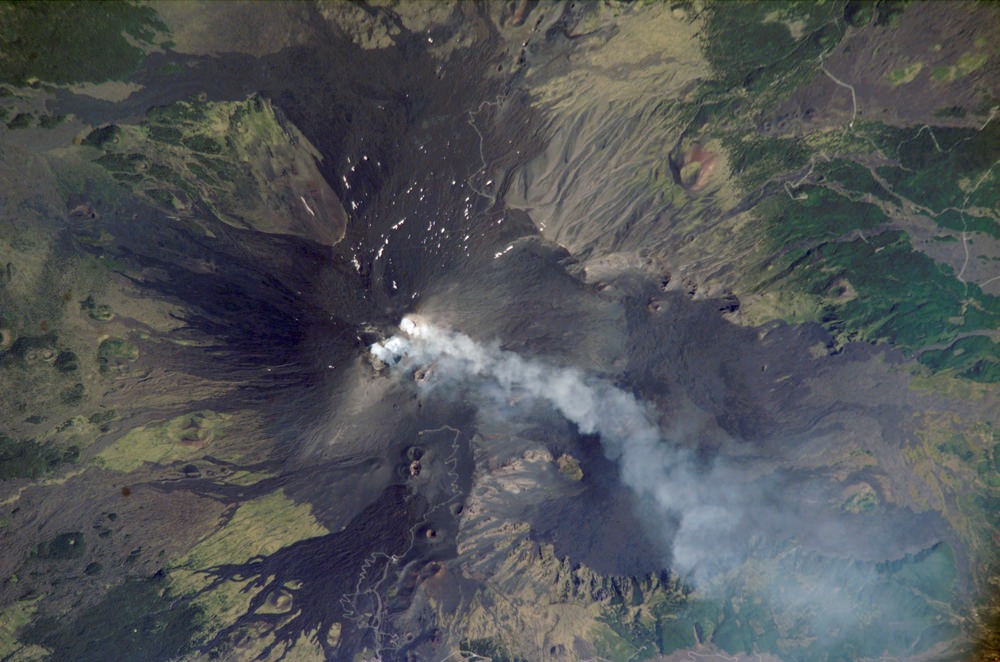
Water vapor and other volcanic gases overflow Etna’s summit craters, spilling out over the volcano’s upper slopes. A steam plume rises from a collapse pit that formed in late 2009, the newest volcanic feature on Etna. Dark lava flows from recent eruptions cover the peak, overlaying lighter, weathered flows from hundreds or thousands of years ago. (Numbers on the image indicate when a flow was erupted.) The oldest lavas are covered by green vegetation. Eruptive cones and fissures also dot the landscape. Frequent explosions deep within the Northeast Crater, which may presage an upcoming eruption, are audible at the summit. These explosions were occurring sporadically every few minutes, as recorded by nearby seismometers. This natural-color satellite image was acquired by the Advanced Land Imager (ALI) aboard (EO-1) on September 26, 2010.Mt Etna photographed by astronauts aboard the International Space Station on August, 2, 2006.
One of the most consistently active volcanoes in the world, Sicily’s Mount Etna has a historical record of eruptions dating back to 1500 BC. This astronaut photograph captures plumes of steam and possibly ash originating from summit craters on the mountain: the Northeast Crater and Central Crater, which includes two secondary craters (Voragine and Bocca Nuova). Locals heard explosions coming from the rim of the Northeast Crater on July 26, 2006, and the plumes shown in this image are likely a continuation of that activity. Credit: NASA.
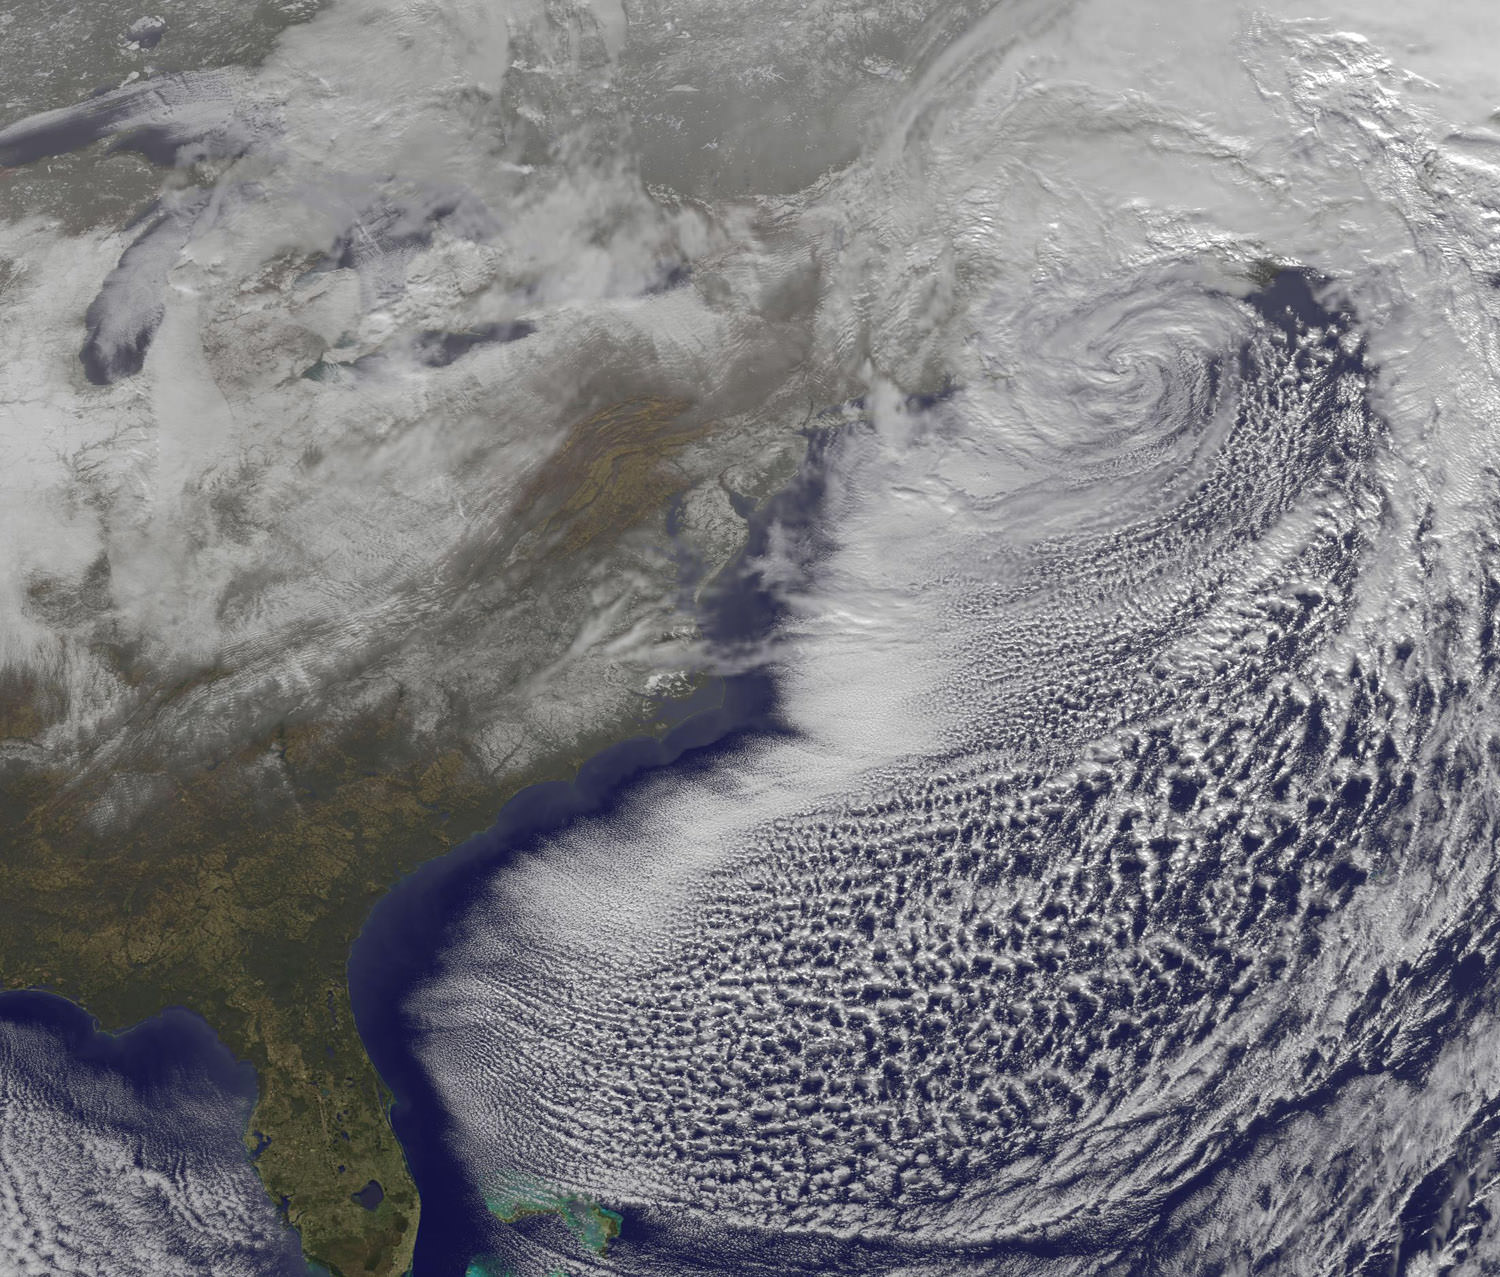
On Monday, Dec. 27 at 1731 UTC (12:31 p.m. EST) the GOES-13 satellite captured this visible image of the powerful low pressure system that brought snows from Georgia to Maine along the US east coast. Some of the snowfall can be seen over South and North Carolina, Virginia, Maryland, Delaware, eastern Pennsylvania, New Jersey and southeastern New York. The clouds of the low obscure New England in the image. Credit: NOAA/NASA GOES Project
The Christmas Blizzard of 2010 dumped up to 30 inches of snow in the northeast United States, with winds gusts up to 60 mph. An Earth-orbiting satellite, GOES-13 captured a series of visible images of the storm, showing its progression. News reports from New York City say this is the sixth largest snowstorm in the city’s history and it buried the streets in four-foot drifts, bringing transit to a halt with cars and buses stranded in the streets.
Snowfall ranged from 1.5 inches in Atlanta, Georgia to more than two feet in various areas of New Jersey, New York and the New England states.
[/caption]
Some of those snows are visible in the above GOES-13 satellite image. Snowfall on the ground can be seen in the image over South and North Carolina, Virginia, Maryland, Delaware, eastern Pennsylvania, New Jersey, and southeastern New York. The clouds of the low obscure New England in the image.
Photographer Michael Black took an amazing timelapse of the blizzard, with a Canon DLSR on tripod with remote timer taking a photo once every five minutes (approximately 20 hours in 40 seconds.) — and obviously having to go outside and readjust the clock and markers.
Merapi Volcano on November 10, 2010, when the Moderate Resolution Imaging Spectroradiometer (MODIS) on NASA’s Terra satellite. Credit: NASA
[/caption]
For about three weeks, Indonesia’s Mount Merapi has been belching out lava, as well as ash and gas, clouding the atmosphere above. This satellite image, taken by NASA’s MODIS instrument on the Terra satellite, shows the volcano now settling down and is the most cloud-free satellite view of the volcano that we’ve been able to see. Thick ash is still rising and the volcano is still considered to be erupting at dangerous levels. Merapi is one of Indonesia’s most active volcanoes, and this eruption has been the most violent since the 1870’s.
The dark brown streak down the southern face of the volcano is ash and other volcanic material deposited by a pyroclastic flow or lahar. The volcano has been blamed for 156 deaths and about 200,000 people had to evacuate. The ash also caused flights to be delayed or canceled.
See below for a thermal image of the lava flow.
The Advanced Spaceborne Thermal Emission and Reflection Radiometer (ASTER) on NASA’s Terra satellite captured the thermal signature of hot ash and rock and a glowing lava dome on Mount Merapi on Nov. 1, 2010. Credit: NASA.
As a very active volcano, Merapi poses a constant threat to thousands of people in Indonesia. The Advanced Spaceborne Thermal Emission and Reflection Radiometer (ASTER) on NASA’s Terra satellite captured the thermal signature of hot ash and rock and a glowing lava dome. The thermal data is overlaid on a three-dimensional map of the volcano to show the approximate location of the flow. The three-dimensional data is from a global topographic model created using ASTER stereo observations.
For more information see NASA’s Earth Observatory website.
Visible satellite image of the October 26, 2010 superstorm taken at 5:32pm EDT. Image credit: NASA/GSFC.
[/caption]
Yowza! – Here’s a satellite image of a storm of record-breaking proportions. On October 26, 2010, the strongest storm ever recorded in the Midwest spawned 24 tornadoes, 282 reports of damaging winds, violent thunderstorms, and torrential rains. The mega-storm reached peak intensity late yesterday afternoon over Minnesota, resulting in the lowest barometric pressure readings ever recorded in the continental United States (except for from hurricanes and nor’easters affecting the Atlantic seaboard.) The storm continues today (Oct. 27) with more tornado watches posted for Mississippi, Alabama, and Georgia, a blizzard warning for North Dakota, high wind warnings for most of the upper Midwest, and near-hurricane force winds on Lake Superior.
Read more about this super-storm on Weather Underground, but see below for what extremely low air pressure means.
Air pressure is one of the most important factors which determines what the weather is like. A mass of low pressure is an area of air that is rising. As it rises, it expands and cools. Cooler air cannot hold as much water as warmer air, so as the air rises the water will condense and form clouds. This is why an area of low pressure will often be accompanied by clouds and rain — which is what occurred on October 26 — lots of clouds and lots of rain and even snow.
But winds were even a bigger factor in this superstorm. Our atmosphere really doesn’t like big differences in air pressure, so where areas of low pressure meet up with areas of high pressure, winds blow in an attempt to combat the differences in the air pressure. The larger the difference in pressure the stronger the winds will blow. So, the extreme low pressure readings yesterday meant the winds were really howling — and they were. In my neighborhood in Illinois, we had a fairly study flagpole get bent from the winds. But that was nothing compared to the hurricane-like winds other places experienced: for example, Grand Marais, Minnesota — near the Great Lakes and near the area of the lowest air pressure readings — had sustained winds of 43 mph gusting to 59 mph, lasting for over 7 hours. Today, that region is still getting pummeled by winds and snow.
You can see the link to Weather Underground above to see what other weather extremes were experienced during this storm.
Computer generated simulation of an asteroid strike on the Earth. Credit: Don Davis/AFP/Getty Images
If we discover an asteroid heading directly towards Earth, are we ready to deal with the challenges of either deflection strategies or an evacuation prior to impact? Apollo 9 astronaut Rusty Schweickart has spent years championing the need for the human race to prepare for what will certainly happen one day: an asteroid threat to Earth. Schweickart is Chairman of the Board of the B612 Foundation, a non-profit private foundation that supports the development and testing of a spaceflight concept to protect the Earth from future asteroid impacts, and he says we have the technology today to deal with it, but nothing has been verified or tested. “We need to mobilize that technology and achieve an international consensus on what actions should be taken,” he told Universe Today.
Schweickart also co-chairs — with another former astronaut, Tom Jones — the Planetary Defense Task Force of the NASA Advisory Council. On October 6, 2010, the Task Force submitted a list of five recommendations to the Council to suggest how NASA should organize, investigate, prepare, and lead national and international efforts defending our planet from an asteroid impact.
Rusty Schweickart
“Our report and recommendations are a necessary, but not sufficient element of a sequence of actions which hopefully will lead to humanity being able to prevent future asteroid impacts with Earth,” Schweickart explained. “Assuming positive action by OSTP (Office of Science and Technology Policy) and the Congress, we’ll be well on our way to preventing future impact disasters.”
The report stresses that NASA should significantly improve the ability to discover and track potential NEO impactors to allow for early detection, develop effective impact mitigation techniques, and prepare an adequate response to the range of potential impact scenarios.
These recommendations have been approved by the Advisory Council, and the report was submitted to the NASA Administrator. Then, the Office of Science and Technology Policy (OSTP) is supposed to make a decision by tomorrow – Friday, October 15, 2010 –to make assignments in the US government as to what the breakdown of work should be to protect the Earth from an asteroid impact.
Among the recommendations in the PDTF report is developing mitigation techniques. But could NASA do this type of work within their new budget? “People intuitively think that if you’re going to be pushing asteroids around, that work will take over NASA,” said Schweickart said in a phone interview with Universe Today . “Wrong. It would be a ripple in NASA’s budget, a pimple, 1.5-2.0 percent at the most of NASA’s annual budget for 10 years then dropping back to less than 0.5%. It does not displace anything else that NASA is doing. It would be a small budgetary issue, but the importance of it is huge. This saves lives, protects the global environment, and saves future generations.”
*Update (10/16/10) Schweickart asked to add to his comments about budgetary needs, as there were some misinterpretations. “I certainly did not intend that it be interpreted as no budget increment is needed! In fact our report makes very clear that we strongly recommend that Congress increment the existing budget for this purpose and not take it out of existing programs. It is not costly, but other NASA programs should not be penalized in order to support a responsible, public safety program which would amount to only a 1.5-2.0% increment in the NASA budget.”
Artist concept of a space tug. Credit: NASA
The technology needed exists today, Schweickart said, “that is, we do not have to go into a big technology development program in order to deflect most asteroids that would pose a threat of impact. However, that technology has not been put together in a system design, and not been verified, tested or demonstrated that it could actually deflect an asteroid. So, we need to test everything – test the very sequence we would use for a deflection campaign.”
The best way to test it would be to have NASA, or perhaps a consortium of space agencies, carry out an actual mission to test the entire system.
“Not with an asteroid that threatens an impact,” said Schweickart, “but with an asteroid that is just minding its own business, and we’d have the opportunity to show we can change its orbit slightly in a controlled way.”
The crew of Apollo 9: Commander James McDivitt, Command Module Pilot Dave Scott and Lunar Module Pilot Rusty Schweickart. Credit: NASA
Schweickart said the B612 foundation, and the Association of Space Explorers (ASE; the professional organization of astronauts and cosmonauts from around the world) and every planetary defense conference held recently has discussed the need for such a capability validation.
But the recommendations made by the PDTF are, for now just suggestions, and certainly not a mandate for NASA to prepare in a meaningful way for an asteroid threat.
“There’s no official design of a deflection mission because there is no responsibility to do it,” Schweickart said. “Right now, NASA’s assignment is only to find these asteroids. Period. That’s it.”
But, with the October 15 deadline almost here, Schweickart is hopeful. “Hopefully, that will begin the process of NASA actually having this responsibility,” he said, “and that Congress will respect that and a budget be allocated in order to do the job. Then mission planners can start designing demonstration missions.”
However, if the past is any indication, any mandate wouldn’t necessarily mean a mission would happen soon.
The Pan-STARRS telescope on Haleakala, Hawaii. Photograph by Rob Ratkowski for the PS1SC
Congress directed NASA to do the “Spaceguard” survey to find all asteroids around 40 meters and larger by 2020. “To come close to achieving that, we need to have new telescopes that will have greater capabilities than what we’ve been using to date,” said Schweickart. “Right now the Pan-STARRS telescope has the equivalent of one eye squinting, and it is not exactly knocking everybody’s socks off. LSST (Large Synoptic Survey Telescope) is still hundreds of millions of dollars before being a fully funded project.”
Schweickart said the Task Force heard presentations on perhaps better ways to complete that Congressional goal and their report indicates that at least 87% of the large asteroids whose impacts could pose a global threat to our civilization have been discovered. Right now, none pose a credible threat of a collision with Earth for the foreseeable future. But the discovery rate of the much more numerous smaller NEOs, — which represent a regional or local impact hazard — “will soon confront us with objects presenting worrisome but uncertain probabilities for a future collision with Earth. Such situations will appear more frequently as the discovery rate increases, and the nation presently has no clear policy on how to address such a situation,” the report says.
“Congress’s favorite thing to do is to tell you to do something and not give you any money for it,” Schweickart said. “That is not very responsible and it doesn’t always work and it’s not the right way a government should operate, especially where public safety is at issue. Therefore it is important that the OSTP lead the way on this issue on October 15.”
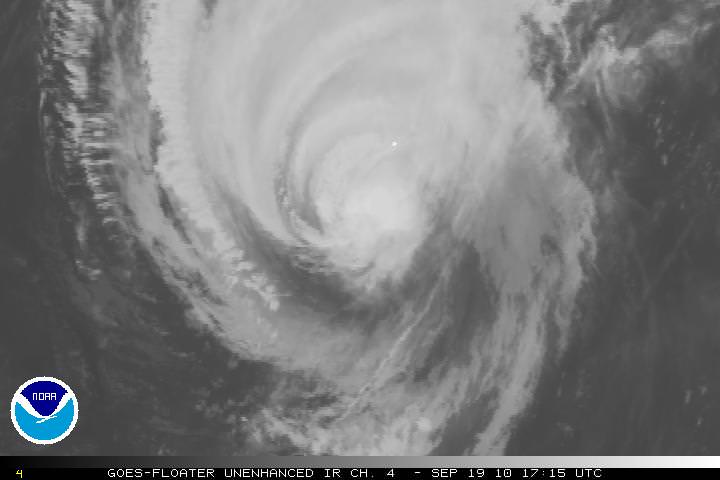
Hurrican Igor as seen by one of the GOES satellites, taken on Sept. 19, 2010 at 17:15 UTC. Credit: NOAA
[/caption]
The massive Hurricane Igor is now a Category One storm, with maximum sustained wind speeds of 140 km per hour, (85 miles per hour). As of this writing at 2:30 EDT, it looks as if it is on a direct collision course with Bermuda and is about 220 km (135 miles) southwest of Bermuda. The intensity of the storm has decreased over the past few days, but the size and rotation of the Igor means that Bermuda will be hit repeatedly as the arms of the hurricane spin over the 54 square kilometer (21 sq mi) island nation. In the satellite image above, Bermuda is the small white dot near the center of the image.
Projected track of Hurricane Igor. Credit: NOAA
Damaging sustained winds of hurricane force will reach the Bermuda late Sunday afternoon, and they will continue into early Monday morning. Wind gusts are predicted to be near or just over 160 km/hour (100 mph) as Igor makes its closest approach to Bermuda. Here’s a link to even more hurricane images.
The hurricane threatens to leave widespread tree damage and power outages in its wake. Some structures will also sustain damage; but fortunately, many buildings on Bermuda are made of stone with foundations into bedrock.
Flooding is also a serious concern across Bermuda. Igor will not only drop 4 to 8 inches of rain but will also trigger a 6- to 10-foot storm surge. Worsening the situation is the fact that waves pounding Bermuda will rise to heights in excess of 40 feet into this evening.
The massive size of Igor will cause the hurricane to keep battering the island well into Monday afternoon.
This 3-D image of Igor's cloud heights and rainfall from NASA TRMM satellite. Credit: Credit: NASA/SSAI, Hal Pierce
This 3-D image of Igor’s cloud heights and rainfall from NASA TRMM data shows a large area of heavy rainfall (falling at about 2 inches per hour) shown here in red on Sept. 15 at 0353 UTC. The yellow and green areas indicate moderate rainfall between .78 to 1.57 inches per hour. The image reveals that Igor’s eye was still very distinct but the southwestern portion of the eye wall had eroded.


 on NASA’s Terra satellite")


 on NASA’s Terra satellite captured the thermal signature of hot ash and rock and a glowing lava dome on Mount Merapi on Nov. 1, 2010. Credit: NASA.")