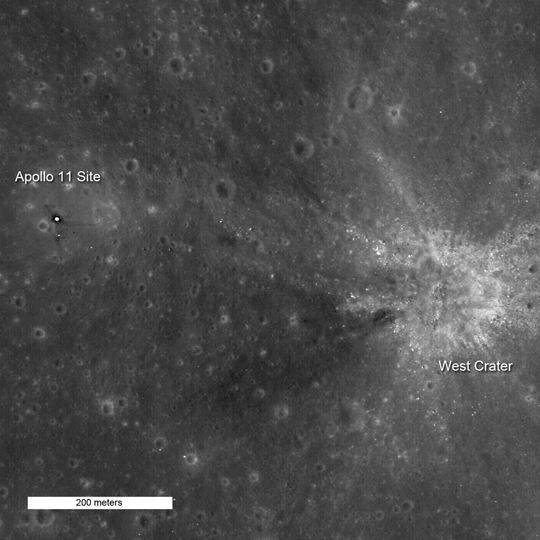
Latest look at Apollo 11 site from LRO. Credit: NASA/GSFC/Arizona State University
[/caption]
Here are the first images of the Apollo 11 landing site since the Lunar Reconnaissance Orbiter dropped into its 50 km mapping orbit. The sun is almost straight overhead on this image so there’s no real shadows visible. What’s great about this image is that we can actually see the footpads on the Lunar Module from which Armstrong made his giant leap for mankind! See the closeup below for more details. The other great thing about this top image is that we get a good look at West Crater, which is the rocky area that Neil Armstrong saw as the LM neared the surface. The computer trajectory would have taken them right in the middle of that boulder field, so Armstrong flew manually to change the flight plan to fly westward to find a safe landing spot. This image is 742 meters wide (about 0.46 miles). North is towards the top of the image.
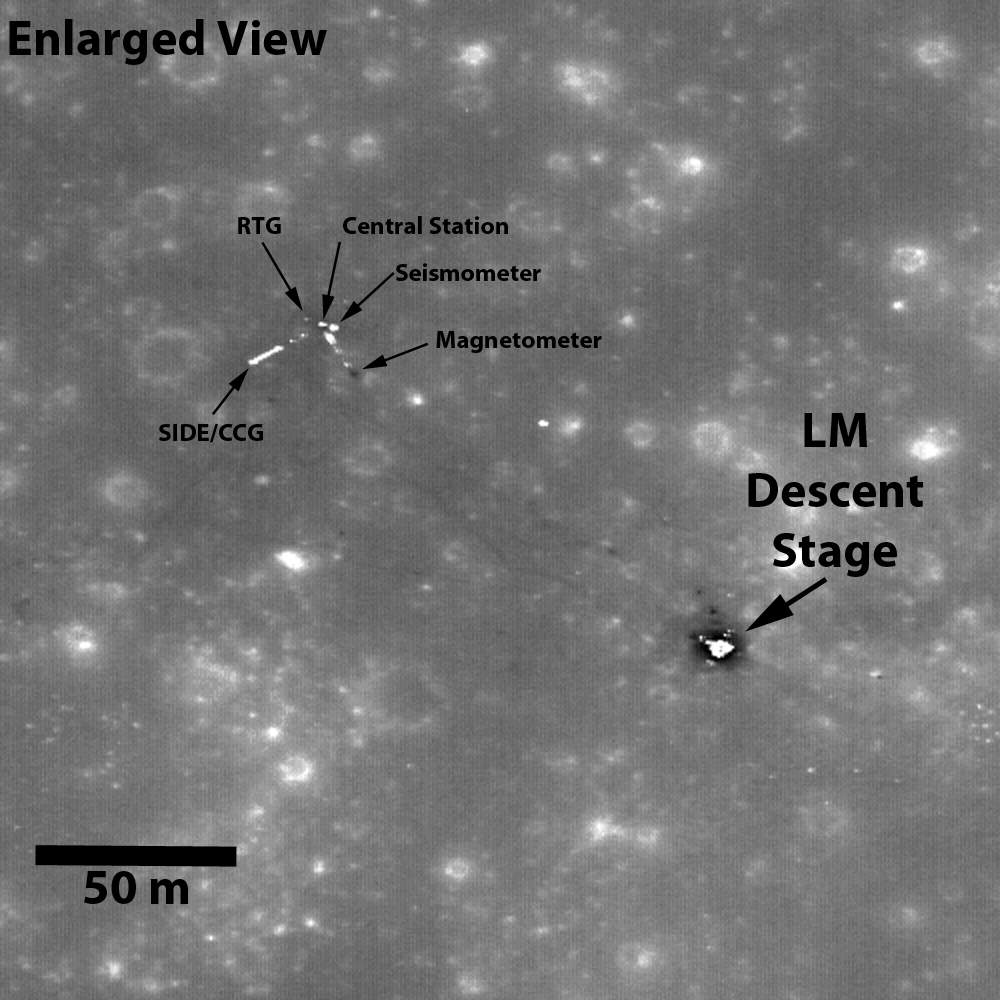
Enlargement of area surrounding Apollo 11 landing site. Credit: NASA/GSFC/Arizona State University
At this altitude, very small details of Tranquility Base can be discerned. The footpads of the LM are clearly discernible, and components of the Early Apollo Science Experiments Package (EASEP) are easily seen, as well. Very cool.
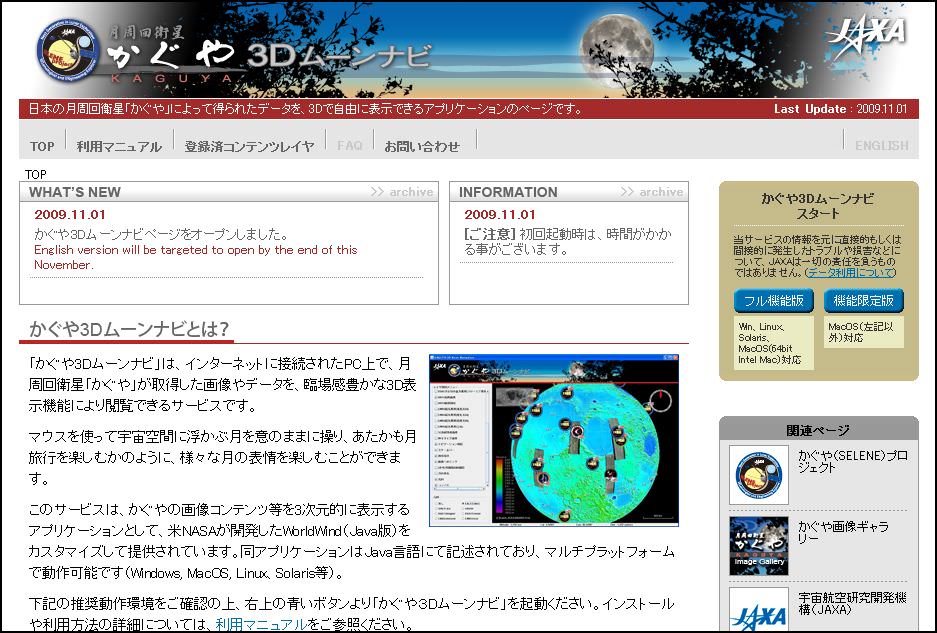
JAXA, the Japan Aerospace Exploration Agency has released all the data from the Kaguya mission to the public. One of the ways to view the data is through a very nifty 3-D virtual brower. It only is available in Japanese for now (English version by the end of November, they say) so it is a little difficult to navigate, but once you figure it out, prepare yourself for loads of fun. First, you need Java. Then…
go to this page and download the browser. (If you don’t have Java, when you try to open the download it will ask you if you want to add Java.) When you get everything downloaded and the page opens up, (screenshot of page, above) look for the blue buttons on the top right. If you have a modern PC or laptop, click on the left blue button. If you have an old pre-Intel Mac, click the right blue button. Then again, it takes a while for the data to download. On the left are different data sets you can view from the different instruments. Unless you are familiar with the different instruments, it is kind of a crap shoot as far as what each one is; so just click one and see what comes up. The top one is for Clementine data, but the rest are from the different instruments on Kaguya. The Moon globe will fill in with data, and you can spin around and check out virtually any location on the Moon. It’s pretty wild, and addictive. If you still have a hard time figuring it out, you’ll have to wait for the English version. Or you can go to this page, which is a form where you can request what data you want to see. Enjoy!
Close-up view of Apollo 12 landing site from LRO. Credit: NASA/GSFC/Arizona State University
Wow! Just look at the detail visible in this image of the Apollo 12 landing site taken by the Lunar Reconnaissance Orbiter from its lower mapping orbit of 50 km above the surface. Compared to earlier images taken in September when LRO was in a higher orbit, the Lunar Module descent stage really stands out, as well as the Apollo Lunar Surface Experiment Package (ALSEP). Also visible are the trails left by spacewalking astronauts. From this and other LROC landing site images, it is clear that astronaut activity lowers the albedo, or reflectivity of the surface. Areas of heaviest activity have the lowest albedo, especially around the LM. NASA says this effect is most likely due to compaction of a very loose surface powder by the astronauts just walking around.
The Apollo 12 landing site as seen by LRO. Credit: NASA/GSFC/Arizona State University
Here is a slightly more zoomed out version that includes the Surveyor 3 spacecraft. The Sun is very high in the sky (incidence angle 4°) for these images and shadows are minimized.
Below is an image taken by the astronauts as they set up the ALSEP instruments.
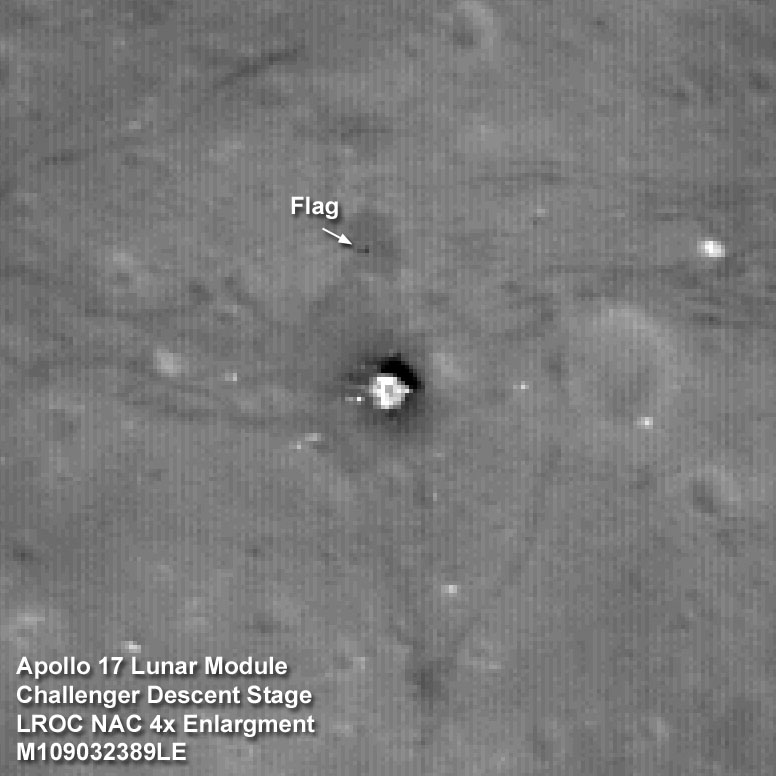
The Apollo 17 Lunar Module Challenger descent stage comes into focus from the new lower 50-km mapping orbit, image width is 102 meters [NASA/GSFC/Arizona State University].
.”]
The Lunar Reconnaissance Orbiter maneuvered into its 50-km mapping orbit on September 15, which enables it to take a closer look at the Moon than any previous orbiter. This also allows for comparing previous images taken by LRO when it was at its higher orbit. Here’s the Apollo 17 landing site: just look at what is all visible, especially in the image below! These images have more than two times better resolution than the previously acquired images.
Region of Taurus-Littrow valley around the Apollo 17 landing site. NASA/GSFC/Arizona State University.
At the time of this recent pass, the Sun was high in the sky (28° incidence angle) helping to bring out subtle differences in surface brightness. The descent stage of the lunar module Challenger is now clearly visible, at 50-cm per pixel (angular resolution) the descent stage deck is eight pixels across (four meters), and the legs are also now distinguishable. The descent stage served as the launch pad for the ascent stage as it blasted off for a rendezvous with the command module America on December 14, 1972.
Also visible is the ALSEP, the Apollo Lunar Surface Experiments, which for Apollo 17 included 1) Lunar Seismic Profiling Experiment (geophones), 2) Lunar Atmospheric Composition Experiment (LACE) to measure the composition of the Moon’s extremely tenuous surface bound exosphere, 3) Lunar Ejecta and Meteorites (LEAM) experiment, 4) central station, 5) Heat Flow Experiment, 6) all powered by a Radioisotope Thermoelectric Generator (RTG). Below is how it looked from the surface, taken by the Apollo astronauts.
View of the ALSEP looking south-southeast. Credit: NASA
Compare these most recent images to one taken previously.
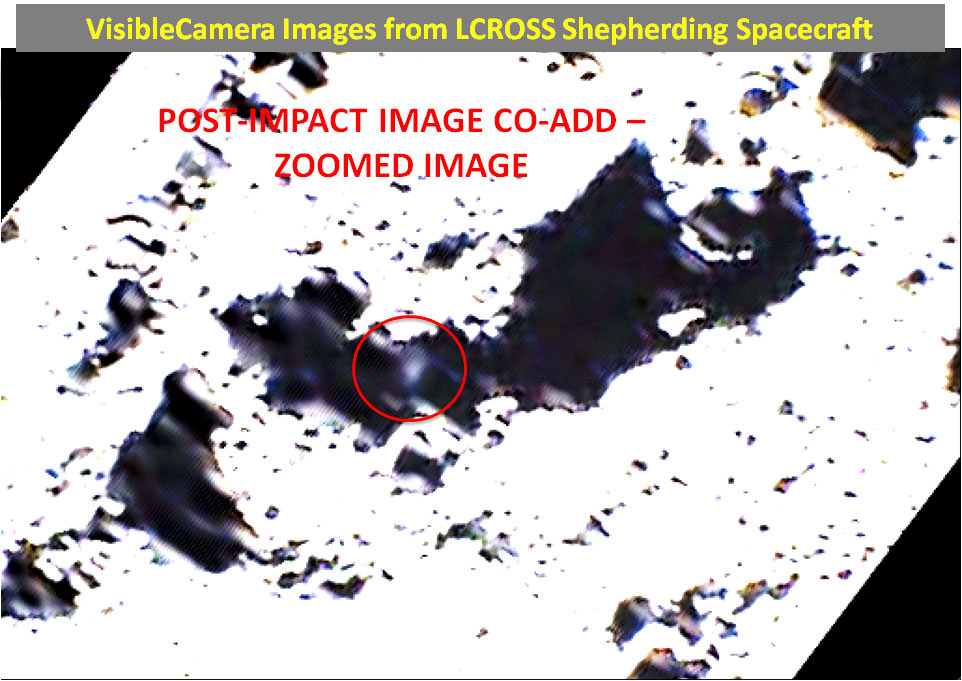
Zoomed in image of the impact plume. The extent of the plume at 15 sec is approximately 6-8 km in diameter. Credit: NASA
Nine science instruments on board the LCROSS spacecraft captured the entire crash sequence of the Centaur impactor before the spacecraft itself impacted the surface of the moon. But from Earth, any evidence of the plume was hidden by the rim of a giant impact basin, a 3 kilometer-high (2-mile) mountain directly in the way for Earth telescopes trained on the impact site, said Dr. Peter Schultz, co-investigator for LCROSS. Additionally, the crater created by the impact was only about 28 meters across (92 feet) but Schultz said the best resolution Earth telescopes can garner is about 180 meters (200 yards) across.
The science team is analyzing the data returned by LCROSS, and Anthony Colaprete, principal investigator and project scientist, said “We are blown away by the data returned. The team is working hard on the analysis and the data appear to be of very high quality.”
The team hopes to release some of their preliminary findings within the next several weeks, Schultz said at in webcast with students and teachers this week.
During the Oct. 9 crash in to the Moon’s Cabeus crater, the nine LCROSS instruments successfully captured each phase of the impact sequence: the impact flash, the ejecta plume, and the creation of the Centaur crater.
Within the ultraviolet/visible and near infra-red spectrometer and camera data was a faint, but distinct, debris plume created by the Centaur’s impact.
“There is a clear indication of a plume of vapor and fine debris,” said Colaprete. “Within the range of model predictions we made, the ejecta brightness appears to be at the low end of our predictions and this may be a clue to the properties of the material the Centaur impacted.”
The magnitude, form, and visibility of the debris plume add additional information about the concentrations and state of the material at the impact site.
From images and data, the team was able to determine the extent of the plume at 15 seconds after impact was approximately 6-8 km in diameter. Schultz said the Moon’s gravity pulled down most of ejecta within several minutes.
The LCROSS spacecraft also captured the Centaur impact flash in both mid-infrared (MIR) thermal cameras over a couple of seconds. The temperature of the flash provides valuable information about the composition of the material at the impact site. LCROSS also captured emissions and absorption spectra across the flash using an ultraviolet/visible spectrometer. Different materials release or absorb energy at specific wavelengths that are measurable by the spectrometers. the locations of the Diviner LCROSS impact swaths overlain on a grayscale daytime thermal map of the Moon’s south polar region. Diviner data were used to help select the final LCROSS impact site inside Cabeus Crater, which sampled an extremely cold region in permanent shadow that can serve as an effective cold trap for water ice and other frozen volatiles. Credit NASA/GSFC/UCLA
Additionally, the Lunar Reconnaissance Orbiter’s Diviner instrument also obtained infrared observations of the LCROSS impact. LRO flew by the LCROSS Centaur impact site 90 seconds after impact at a distance of ~80 km. Both science teams are working together to analyze the their data.
The LCROSS spacecraft captured and returned data until virtually the last second before impact, Colaprete said, and the thermal and near-infrared cameras returned excellent images of the Centaur impact crater at a resolution of less than 6.5 feet (2 m).
“The images of the floor of Cabeus are exciting,” said Colaprete. “Being able to image the Centaur crater helps us reconstruct the impact process, which in turn helps us understand the observations of the flash and ejecta plume.”
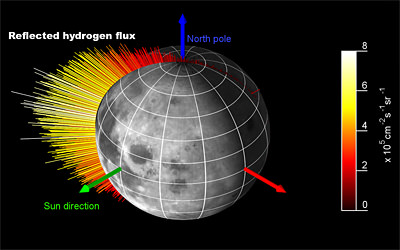
Chandrayaan-1 SARA measurements of hydrogen flux recorded on the Moon on 6 February 2009. Credits: Elsevier 2009 (Wieser et al.), ESA-ISRO SARA data
[/caption]
In late September, a team of scientists announced finding water molecule signatures across much of the Moon’s surface. Now, a second instrument on board India’s Chandrayaan-1’s lunar orbiter confirms how the water is being produced. The Sub keV Atom reflecting Analyzer (SARA) corroborates that electrically charged particles from the Sun interact with the oxygen present in some dust grains on the lunar surface to produce water. But the results bring out a new mystery of why some protons get reflected and not absorbed.
Scientists likened the Moon’s surface to a big sponge that absorbs the electrically charged particles. The lunar surface is a loose collection of irregular dust grains, or regolith, and the incoming charged particles should be trapped in the spaces between the grains and absorbed. When this happens to protons they are expected to interact with the oxygen in the lunar regolith to produce hydroxyl and water.
The SARA results confirm findings from Chandrayaan-1’s Moon Mineralogy Mapper (M3) that solar hydrogen nuclei are indeed being absorbed by the lunar regolith; however SARA data show that not every proton is absorbed. One out of every five rebounds into space. In the process, the proton joins with an electron to become an atom of hydrogen.
“We didn’t expect to see this at all,” says Stas Barabash, Swedish Institute of Space Physics, who is the European Principal Investigator for SARA. The Sub Kev Atom reflecting Analyser (SARA)on board the lunar mission Chandrayaan-1. SARA is the first-ever lunar experiment dedicated to direct studies of plasma-surface interactions in space. Credits: ISRO/ESA/Swedish Institute Of Space Physics
Although Barabash and his colleagues do not know what is causing the reflections, the discovery paves the way for a new type of image to be made. Unfortunately, since the Chandrayaan-1 orbiter is no longer functioning, new data can’t be taken. However, the team can work with data already collected to further study the process.
The hydrogen shoots off with speeds of around 200 km/s and escapes without being deflected by the Moon’s weak gravity. Hydrogen is also electrically neutral, and is not diverted by the magnetic fields in space. So the atoms fly in straight lines, just like photons of light. In principle, each atom can be traced back to its origin and an image of the surface can be made. The areas that emit most hydrogen will show up the brightest.
While the Moon does not generate a global magnetic field, some lunar rocks are magnetized. Barabash and his team are currently creating images from collected data, to look for such ‘magnetic anomalies’ in lunar rocks. These generate magnetic bubbles that deflect incoming protons away into surrounding regions making magnetic rocks appear dark in a hydrogen image.
The incoming protons are part of the solar wind, a constant stream of particles given off by the Sun. They collide with every celestial object in the Solar System but are usually stopped by the body’s atmosphere. On bodies without such a natural shield, for example asteroids or the planet Mercury, the solar wind reaches the ground. The SARA team expects that these objects too will reflect many of the incoming protons back into space as hydrogen atoms.
Scientists with the ESA’s BepiColombo mission to Mercury are hoping to study the interaction between charged particles and the surface of Mercury. The spacecraft will be carrying two similar instruments to SARA and may find that the inner-most planet is reflecting more hydrogen than the Moon because the solar wind is more concentrated closer to the Sun.
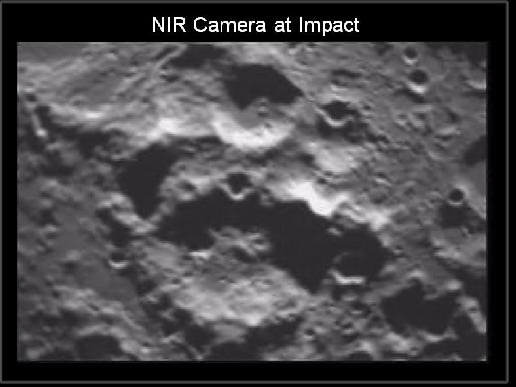
The Near Infrared camera on LCROSS captured this image of the lunar south pole on its way into impact on October 9, 2009. It watched the Centaur upper stage crash into a permanently shadowed area of the crater Cabeus.Credit: NASA / ARC
Even without big explosions or bright plumes of ejecta, for all intents and purposes it appears LCROSS’s impact on the Moon was a smashing success. While the mainstream media and the public seemed disappointed in the lack of visual data, mission managers said the mission has garnered plenty of spectroscopic data, and that’s where the real science can be found. “There was an impact and we saw the crater with spectroscopic data,” said LCROSS principal investigator Tony Colaprete. “We have the data we need to address the questions we set out to answer.” The big question is whether the impact kicked up any signatures of water ice, but it could take days, weeks or months to analyze all the data.
Initial video and images from the event – taken by LCROSS itself and a wide variety of space- and ground-based telescopes – did not show much as far as a visible impact or the anticipated ejecta plume.
Was that a surprise to the science team? “I guess I’m not necessarily surprised,” said Colaprete. “Impacting the Moon is tricky business, and you learn to expect what you’re not going to expect. I’m not convinced we haven’t seen the ejecta. I want to go back to images and look at them carefully. We’ve had just 15-20 minutes of our efforts so far with images. So stay tuned. I certainly hope we can dig something out that will be telling. Our emphasis was on the spectra, that’s where the information is.” Mid Infrared Camera flash detection of Centaur impact. Credit: NASA
Just two and a half hours after impact, mission managers spent most of Friday morning’s press conference explaining how little chance they had to look at the data – and that they wouldn’t even approach the topic of whether water had been detected yet — and how the impact doesn’t end the mission. “This is just the beginning,” said Michael Wargo, NASA’s chief lunar scientist. “We’ve got an enormous amount of data, not only from LCROSS from assets around the world. This is going to change the way we look at the Moon scientifically and change the way we do future exploration.”
High praise was given to the operations and observation campaign teams, as well as the spacecraft itself. “I’m happy to report spacecraft performed beautifully and the operations team did very well,” said Dan Andrews, LCROSS Project Manager. “It takes awhile to comb through the data to make sure we are reporting accurate and correct data, but we wanted to give you all an update on how things went.”
Here’s what they know so far:
They saw a flash at impact with the near infrared camera on LCROSS, and were able to see that an impact occurred, and even see the crater itself. “We had a very good high signal to noise data on the LCROSS spectrometer, probably the highest we could hope for,” said Colaprete. “The fact that we saw a remnant crater and that we got data as far down as we did, it’s very promising. Just on my initial eyeballing, the crater looked to be about the size we were predicting; about 18-20 feet or more. It filled a whole pixel of the camera.” A closer view of the moon as the LCROSS spacecraft approaches impact. Credit: NASA
“The cameras worked very well and we were able to track the Centaur all the way to the end of the mission” Colaprete continued, and then addressed a possible reason why the ejecta plume wasn’t more visible. “There was a flicker from the Centaur that might have been from a tumbling action. We wanted to avoid a perfectly end-on or perfectly flat impact, and it’s possible that happened. But we have the information we can go back now and look at everything.” This image was taken by the Palomar Observatory at the time of impact. Credit: Palomar Observatory
Data from several other spacecraft and telescopes were just starting to trickle in, as well.
On the Lunar Reconnaissance Orbiter, which was observing the impact event from lunar orbit, the LAMP instrument (UV spectrometer) and the Diviner instrument (imaging radiometer) confirmed detection of the ejecta plume. The LRO teams have begun analyzing their data.
The Hubble Space Telescope also observed the event, but not in visible light. “HST was highly focused on spectroscopy, which is where the science is,” Colaprete said. “HST cannot look at the moon except for the very narrow filters because it is so bright. It took long integration stares just off to the side of the Moon.”
Other assets observing the event included IKONOS, GeoEye 1, ODIN — a Swedish radio telescope – all in Earth orbit, and Keck Observatory on Mauna Kea, the Palomar Observatory and MMTO.
Jennifer Heldmann who led the LCROSS observation campaign described some of the data obtained by a all the different telescopes and spacecraft: “We have images, we have video, we have graphs with squiggly lines, which scientists love.”
One surprise is that in the initial data, sodium was seen in the spectroscopic data, and Colaprete said sodium exists in the Moon’s tenuous atmosphere called the exosphere, and perhaps something got thermalized during the impact excite the sodium atoms to where strong visible emission lines showed up in the data.
Other “blips” in the data showed up, and while Colaprete said he couldn’t say what they meant, he was just glad there were there.
“As of now, this has just been a real-time mission,” he said. “We laid it all out there by having streaming video, but here we are at 2 hours. Our primary objective was finding out about the hydrogen that’s been observed at the lunar poles, and honestly, our initial visual images didn’t answer that question. But the answers are in the spectra and we’ve got something there. It could be days, weeks, or months until we can give you an answer. We’ll look at data, scratch our heads, fight over who gets to look at which data, and hopefully from that we can make a public announcement of what we’ve found.”
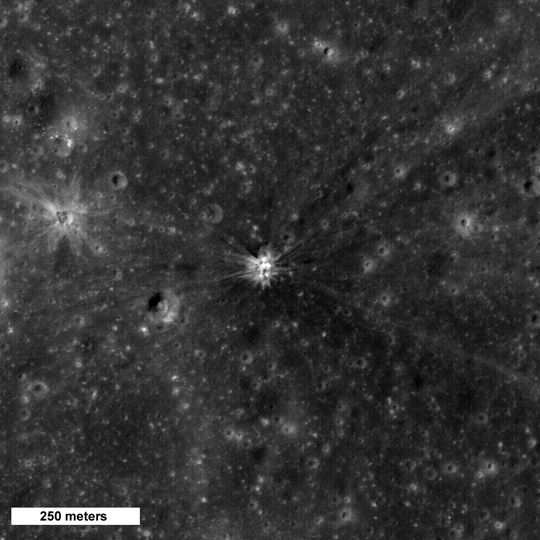
Apollo 14 booster impact site on the Moon. Credit: NASA/Goddard Space Flight Center/Arizona State University
[/caption]
Speaking of lunar impacts: While we await the science data from the LCROSS mission impact earlier this morning, the Lunar Reconnaissance Orbiter team has released this image of another impact on the Moon 38 years ago . The crater in the center of this image was formed by Apollo 14’s Saturn IVB booster. The booster was intentionally impacted into the lunar surface on Feb. 4, 1971. The impact caused a minor “moonquake” that scientists used to learn about the moon’s interior structure. Seismometers placed on the surface by the Apollo 12 astronauts returned data on the tremor.
The crater is about 35 meters (115 feet). The interior of the crater has bright mounds, and a bright ejecta blanket surrounds the exterior of the crater. Bright rays are observed to extend across the surface for more than 1.5 km (0.9 miles) from the impact. This LROC image was taken when the sun was relatively high in the sky, bringing out subtle differences in reflectivity or brightness. This site has been observed before, and scientists noted the unusual occurrence of dark and bright rays when the Apollo 16 spacecraft observed the site.
Comparing the Apollo booster impact to LCROSS, the Apollo impact velocity was at 9,144 kph (5,682 mph.) The booster component weighed 14,000 kg (30,835 lbs) at the time of impact, and the impact energy was equivalent to just over 10 tons of TNT. A seismometer placed in 1969 by Apollo 12 astronauts recorded the vibrations, which lasted for about three hours. The LCROSS impactor (the upper stage of a Centaur rocket) is much smaller than the S-IVB and thus will make a smaller crater. The Centaur weighs about 2000 kg (4,409 lbs) and will hit with a velocity of about 9,000 kph (5,592 mph.)
So anyone worried about the LCROSS impact; don’t worry, the Moon has seen much worse from earlier impacts — both intentional by humans and the unintentional consequences of being in a space-dust and -debris filled region of space.
UPDATE: The MMTO Telescope on Mount Hopkins in Arizona has video from their observations that, while fuzzy, possibly show a bright plume emerging from the crater. (Further analysis says probably not). The video is here,,
In a bit of an anti-climax, the Centaur second stage, and later the LCROSS spacecraft impacted Cabeus Crater but produced no visible plume. Analysis of navigation telemetry indicated the trajectory was spot on, and the Centaur should have hit the surface to within about 64 meters (210 feet) of the planned target. The video above is from NASA TV, and below if video from the Lick Observatory, whose 36-inch telescope was trained on the Moon’s south pole. They didn’t see anything, as reports from telescopes at Palomar, Arizona, and Mauna Kea also confirmed. But a dim impact would mean regolith ejecta, which scientists say is good because that means it hit more dirt than rocks. Another thing to remember is that science is not always “seen” in visible light. The LCROSS sensors and instruments will provide the best data.
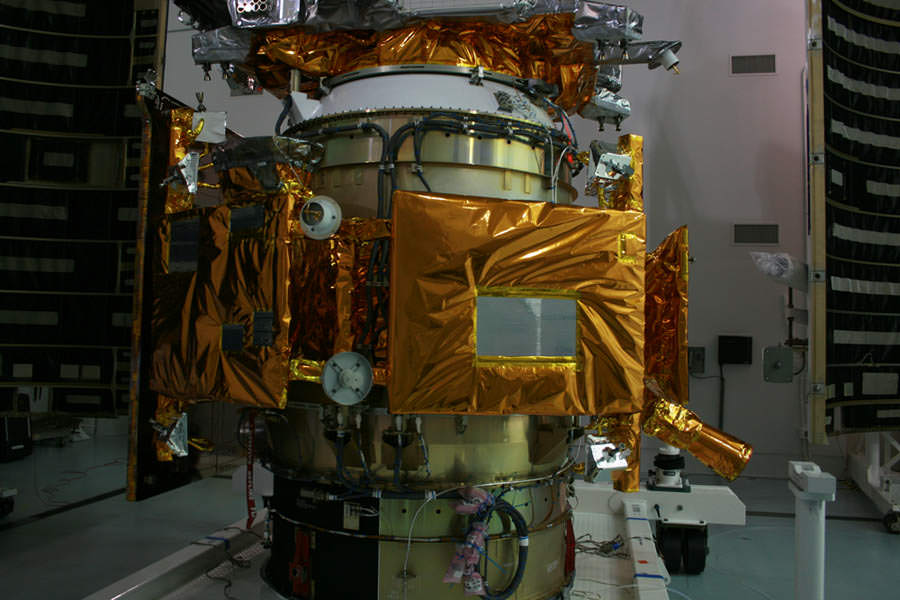
LCROSS Close Up Side view of LCROSS wrapped in gold colored multi layer thermal insulation. Note solar array at left. Science instrument, avionics, navigation, communication and thruster equipment panels encircle and are attached to the central payload adapter ring. Star tracker at right. Payload fairing halves sit at either side. Credit: Ken Kremer and the Planetary Society. Used by permission.
[/caption]
The LCROSS spacecraft will be giving it all up for science Friday morning when it and the second stage of the Centaur rocket impact Cabeus crater on the Moon’s south pole, searching for possible water ice hidden inside the perpetually dark portions of the crater. Since we’ll never see LCROSS again, its only fitting to take a good long, last look at her. Solar System Ambassador and Planetary Society volunteer Ken Kremer had the wonderful opportunity to see both LCROSS and her sister ship the Lunar Reconnaissance Orbiter (LRO) in the Astrotech Space Operations Facility clean room in Titusville, FL earlier this year before the dynamic duo launched together on June 18. Ken has graciously given permission to allow us to publish these images (which were previously posted on the Planetary Society website) so we can all remember what she looked like. Above is a side view of LCROSS wrapped in gold multi-layer thermal insulation. The solar array is on the left side. Science instrument, avionics, navigation, communication and thruster equipment panels encircle and are attached to the central payload adapter ring. The star tracker is on the right side, and the payload fairing halves sit at either side.
More images below.
LRO, LCROSS and Ken Kremer. Credit: Ken Kremer and the Planetary Society.
Here’s a picture of Ken with the two spacecraft. Visible are the solar arrays for LRO (top, left) and LCROSS (bottom, left). Visible is the LCROSS panel with the 9 science instruments (gold color) which run on just 100 watts of power. Above Ken’s head is the visible light camera.
LRO (gray) and LCROSS (yellow) lunar spacecraft stacked adjacent to Atlas V payload fairing at Astrotech Payload Facility on May 15, 2009. Credit: Ken Kremer and the Planetary Society.
This image really provides a reference to how big these two spacecraft actually are. Note the person in the bunny (clean) suit standing next to LRO (gray) and LCROSS (yellow) lunar spacecraft stacked adjacent to Atlas V payload fairing.
And since we’ve now seen LCROSS up close, here’s a few new close-up images just released by NASA of Cabeus crater. A birds-eye view of Cabeus crater, LCROSS' target. Credit: NASA/Goddard Space Flight Center Scientific Visualization Studio
This visualization image gives a bird’s-eye view of Cabeus crater and the target zone for the crash site. A 3.5-kilometer-wide “flagpole” marks the targeted location within the crater. Colored stripes on the pole indicate one kilometer steps in elevation above the crater floor, black stripes indicate 5 kilometer steps. The pole stands 25 kilometers tall, and the blue rings mark heights of 50 and 100 kilometers above the impact site. Key landmarks to locate Cabeus Crater. Credit: NASA/Goddard Space Flight Center Scientific Visualization Studio
This image shows key lunar landmarks used to locate Cabeus crater. The yellow scale shows angular distances in the plane of the impact site; blue arcs show heights 50, 100 and 200 kilometers above it.
And click here for a link to a video visualization that zooms into Zoom into the Moon as it might look shortly after the LCROSS impact. Blue arcs represent 50, 100 and 200 kilometer heights above the crash site.
Hopefully the telescopes trained on this region of the Moon will give us the real images of this event!
Lead image caption: LCROSS Close Up. Side view of LCROSS wrapped in gold colored multi layer thermal insulation. Note solar array at left. Science instrument, avionics, navigation, communication and thruster equipment panels encircle and are attached to the central payload adapter ring. Star tracker at right. Payload fairing halves sit at either side.
Credit: Ken Kremer


on board the lunar mission Chandrayaan-1. SARA is the first-ever lunar experiment dedicated to direct studies of plasma-surface interactions in space. Credits: ISRO/ESA/Swedish Institute Of Space Physics")


 and LCROSS (yellow) lunar spacecraft stacked adjacent to Atlas V payload fairing at Astrotech Payload Facility on May 15, 2009")

