Envisat Sees the Earth Changing in Real Time

Originally developed to pinpoint attacking aircraft during World War Two, today’s advanced radar technology can detect a very different moving target: shifts of the Earth’s crust that occur as slowly as the growth of your fingernails.

Radar data from satellites such as ESA’s Envisat are used to construct ‘interferograms’ that show millimetre-scale land movements. These rainbow-hued images provide scientists with new insights into tectonic motion, and an enhanced ability to calculate hazards arising when this slow motion speeds up, in the form of earthquakes or volcanic activity.

The ten-instrument payload on Envisat includes an Advanced Synthetic Aperture Radar (ASAR) instrument designed to acquire radar images of the Earth’s surface. Part of Envisat’s assigned ‘background mission’ as it orbits the world every 100 minutes is to prioritise ASAR acquisitions over the seismic belts that cover 15% of the land surface.

“By the time Envisat completes its nominal five-year mission we should have a satisfactory amount of images across all the seismic belts,” said Professor Barry Parsons of the Centre for the Observation and Modelling of Earthquakes and Tectonics at Oxford University.

“To detect the fine ground deformation we are interested in, we require repeated radar images of each site. We then combine pairs of images together using a technique called SAR interferometry, or InSAR for short, to show up any change between acquisitions.” (For more information see link: How does interferometry work?)

To accurately measure the slow build up of strain as tectonic plates move against each other along Earth’s seismic belts, multiple interferograms are combined, requiring many individual SAR images.

“The reason for this is to minimise any atmospheric interference, relative to the small crustal deformation signal we are interested in,” added Parsons. “Using data from Envisat’s predecessor ERS, our group has recently measured tectonic movement across western Tibet with an accuracy of a few millimetres per year. The results show that slip rates across the major faults in the region are much smaller than had been previously thought and that the Tibetan plateau deforms like a fluid.”

InSAR can also be used to analyse much more abrupt ground motion: researchers have recently been employing Envisat data to chart ground deformation associated with the extremely active Piton de la Fournaise volcano on R?union Island in the Indian Ocean, and to identify the fault that caused Iran’s Bam earthquake in December 2003.

Finding fault after the Bam disaster
More than 26000 people were killed on 26 December 2003, when a 6.3 Richter scale earthquake devastated the Iranian oasis town of Bam. Its ancient citadel ? designated a World Heritage site ? collapsed into rubble. The Charter on Space and Major Disasters was activated so that spacecraft including Envisat acquired imagery to support international relief efforts.

Following Envisat’s background mission, a pre-earthquake image had been acquired of the Bam vicinity on 3 December 2003, and this was combined with a post-quake image acquired 7 January 2004 ? the earliest re-acquisition date possible due to Envisat’s 35-day global coverage ? to perform InSAR.

“This is the first time that Envisat data has been used to produce an interferogram following a major earthquake,” said Parsons, part of an international team studying the Bam quake including participants from the Geological Survey of Iran and the US Jet Propulsion Laboratory.

The results were surprising, establishing that while Bam lies in a seismic belt, this particular quake had come from a point no one had expected. Iran is like the filling in a geological sandwich as the Arabian plate advances into Eurasia, and so many seismic faults occur within its territory. Most notably, the Gowk fault located west of Bam has had several large quakes take place on it during the last two decades.

However the Envisat interferogram showed the Bam quake had resulted from the rupture of a previously undetected fault that extends under the southern part of town, its existence missed by ground surveys. The fault showed up as a distinct band of discontinuity in the interferogram, with motion either side of it ranging from around five up to as high as 30 centimetres.

As well as highlighting such surface changes, InSAR results can be used to indirectly peer beneath the ground, with software models calculating what geological occurrences fit the surface events. With Bam they found a slip exceeding two metres had taken place at a mean depth of 5.5 kilometres, along a distinct type of fault.

Coming around again
The more precisely a spacecraft’s position can be controlled, the smaller the InSAR image baseline – the spatial distance between initial and follow-up image acquisitions – and the better the quality of the final interferogram. During Envisat’s initial Bam revisit the baseline was large enough that ERS digital elevation data was needed to subtract topographic effects caused by a shifted view angle.

However for its subsequent revisit, 35 days later, the steering of the spacecraft was so precise that no topographic compensation was required, representing a formidable operational achievement for Envisat.

“Our Flight Dynamics team have computed an accuracy of 93 cm using precise orbit determination results from DORIS (Doppler Orbitography and Radiopositioning Integrated by Satellite) and laser ranging observations,” stated Envisat Spacecraft Manager Andreas Rudolph.

“Special orbit manoeuvres were required to achieve this accuracy, along with hard work from teams at the European Space Operations Centre (ESOC) here in Germany and the European Space Research Institute (ESRIN) in Italy ? not to mention a bit of luck!”

Surveying an active volcano
Radar interferometry is used to study earthquakes as well as volcanoes – Envisat has been gathering data on one extremely lively example of the latter.

Standing 2631 metres above the Indian Ocean, the Piton de la Fournaise volcano is not situated along seismic belts or the associated ‘Ring of Fire’ but ? like Hawaii on the other side of the planet ? it is sited above a magma ‘hotspot’ in the Earth’s mantle.

The Institut de Physique du Globe de Paris (IPGP) operates an in-situ Volcano Observatory to monitor eruptions and associated activity.

“We have been observing this basaltic volcano for the last 25 years ? it is one of the most active volcanoes in the world,” commented Pierre Briole of IPGP. “In the last six years there have been 13 eruptions, with an average duration of one month. Between 1992 and 1998 was a quiet time, while eight eruptions occurred between 1984 and 1992.”

Deep subterranean processes drive surface volcanic activity ? lava fissures and eruptions occur because of lava channels or ‘dikes’ that extend up from high pressure magma chambers. Ground deformation either up or down in the vicinity of a volcano provides insights into what is taking place underground, but until recently the amount of ground points that could be measured was very limited.

“Back in the time of ground-based geodetic instruments it took several weeks to measure the coordinates of perhaps 20 points, to an accuracy of about one centimetre,” remembered Briole. “Then in the early 1990s came the Global Positioning System (GPS). Using GPS we could increase the number of points measured tenfold during a weeklong campaign, down to half-centimetre accuracy. But the ground deformation caused by an eruption is typically extremely localised in space, and these 200 points are spread out across the volcano’s area.”

It took another space-based technology to improve on GPS: interferograms of Piton de la Fournaise, based on more than 60 Envisat images acquired during the last year. IPGP is part of a team making use of the data that also includes participants from Blaise Pascal (Clermont-Ferrand II) and R?union Universities.

“We are lucky with Piton de la Fournaise, because its remote location in the middle of the ocean means there are no clashes with other potential Envisat targets, and so we get more acquisitions than most of the other users of ASAR imagery,” Briole added. “InSAR from Envisat has proved an extremely powerful tool for us, because it provides a very high density of information across the entire volcano.

“With new eruptions taking place so often our ground campaigns could not keep pace but interferometry gives us data on each eruption. And while the volcano is very difficult place to operate in ? often with poor visibility from the weather and a very steep eastern flank ? all parts of the volcano down to vegetation line are accessible with InSAR.”

InSAR reveals a pattern of ground inflation in the months preceding a new eruption, as pressure in the magma chamber increases. Following an eruption the pressure abates and deflation occurs.

Also revealed are localised deformations that occur as magma dikes propagate and reach the surface. The extent of the deformation associated with a new fissure indicates the depth at which it originates ? the wider the inflation, the deeper down the dike has come from.

InSAR volcanic monitoring was first established using ERS data, producing interferograms showing Italy’s highly-active Mount Etna appearing to ‘breathe’ between eruptions. And interferogram surveys of apparently extinct volcanoes along remote parts of the Andes have shown ground motion indicating some are in fact still active.

“There are plenty of interesting lines of enquiry using this technique, including the question of whether it is possible to predict when a volcano is going to erupt, and – with seismic faults often occurring near volcanoes – the question of whether seismic activity and volcanic eruptions are linked,” Briole added.

“For now our team are interested in characterising Piton de la Fournaise as accurately as we can, to perfect techniques we can later apply to volcanoes elsewhere and if possible to increase the number of acquisitions so as to demonstrate that InSAR monitoring of volcanoes has operational potential, providing early warning for civil protection authorities.”

Original Source: ESA News Release

A View of Hurricane Alex

NASA’s Terra satellite captured this true-color image of Hurricane Alex, the first Atlantic hurricane of the season, at noon EDT on Tuesday, August 3. Around that time, the Category 2 storm was pounding North Carolina’s Outer Banks with winds of up to 100 miles an hour. It’s expected to eventually turn east and head out to sea.

The resolution on this photo, from Terra’s Moderate Resolution Imaging Spectroradiometer (MODIS), is 2 kilometers per pixel.

Original Source: NASA News Release

SMART-1’s View of the Middle East

Now more than 100 000 kilometres away from Earth, ESA’s Moon-bound spacecraft SMART-1 looked back at Earth and returned this planetary perspective of the Middle East and Mediterranean Sea.

‘Smart’ usage of the solar-electric propulsion system (the ion engine) has saved a lot of fuel and the spacecraft will get to the Moon earlier than expected.

Almost 20 kilograms of the xenon fuel could be saved out of the original 84 kilograms, which could then be used to get closer to the Moon than planned, to within distances of between 300 and 3000 kilometres. This will give a coverage of the lunar surface at higher resolution and sensitivity.

Original Source: ESA News Release

Satellites Spot Giant Rogue Waves

Once dismissed as a nautical myth, freakish ocean waves that rise as tall as ten-storey apartment blocks have been accepted as a leading cause of large ship sinkings. Results from ESA’s ERS satellites helped establish the widespread existence of these ‘rogue’ waves and are now being used to study their origins.

Severe weather has sunk more than 200 supertankers and container ships exceeding 200 metres in length during the last two decades. Rogue waves are believed to be the major cause in many such cases.

Mariners who survived similar encounters have had remarkable stories to tell. In February 1995 the cruiser liner Queen Elizabeth II met a 29-metre high rogue wave during a hurricane in the North Atlantic that Captain Ronald Warwick described as “a great wall of water? it looked as if we were going into the White Cliffs of Dover.”

And within the week between February and March 2001 two hardened tourist cruisers ? the Bremen and the Caledonian Star ? had their bridge windows smashed by 30-metre rogue waves in the South Atlantic, the former ship left drifting without navigation or propulsion for a period of two hours.

“The incidents occurred less than a thousand kilometres apart from each other,” said Wolfgang Rosenthal – Senior Scientist with the GKSS Forschungszentrum GmbH research centre, located in Geesthacht in Germany – who has studied rogue waves for years. “All the electronics were switched off on the Bremen as they drifted parallel to the waves, and until they were turned on again the crew were thinking it could have been their last day alive.

“The same phenomenon could have sunk many less lucky vessels: two large ships sink every week on average, but the cause is never studied to the same detail as an air crash. It simply gets put down to ‘bad weather’.”

Offshore platforms have also been struck: on 1 January 1995 the Draupner oil rig in the North Sea was hit by a wave whose height was measured by an onboard laser device at 26 metres, with the highest waves around it reaching 12 metres.

Objective radar evidence from this and other platforms ? radar data from the North Sea’s Goma oilfield recorded 466 rogue wave encounters in 12 years – helped convert previously sceptical scientists, whose statistics showed such large deviations from the surrounding sea state should occur only once every 10000 years.

The fact that rogue waves actually take place relatively frequently had major safety and economic implications, since current ships and offshore platforms are built to withstand maximum wave heights of only 15 metres.

In December 2000 the European Union initiated a scientific project called MaxWave to confirm the widespread occurrence of rogue waves, model how they occur and consider their implications for ship and offshore structure design criteria. And as part of MaxWave, data from ESA’s ERS radar satellites were first used to carry out a global rogue wave census.

“Without aerial coverage from radar sensors we had no chance of finding anything,” added Rosenthal, who headed the three-year MaxWave project. “All we had to go on was radar data collected from oil platforms. So we were interested in using ERS from the start.”

ESA’s twin spacecraft ERS-1 and 2 ? launched in July 1991 and April 1995 respectively ? both have a Synthetic Aperture Radar (SAR) as their main instrument.

The SAR works in several different modes; while over the ocean it works in wave mode, acquiring 10 by 5 km ‘imagettes’ of the sea surface every 200 km.

These small imagettes are then mathematically transformed into averaged-out breakdowns of wave energy and direction, called ocean-wave spectra. ESA makes these spectra publicly available; they are useful for weather centres to improve the accuracy of their sea forecast models.

“The raw imagettes are not made available, but with their resolution of ten metres we believed they contained a wealth of useful information by themselves,” said Rosenthal. “Ocean wave spectra provide mean sea state data but imagettes depict the individual wave heights including the extremes we were interested in.

“ESA provided us with three weeks’ worth of data ? around 30,000 separate imagettes ? selected around the time that the Bremen and Caledonian Star were struck. The images were processed and automatically searched for extreme waves at the German Aerospace Centre (DLR).”

Despite the relatively brief length of time the data covered, the MaxWave team identified more than ten individual giant waves around the globe above 25 metres in height.

“Having proved they existed, in higher numbers than anyone expected, the next step is to analyse if they can be forecasted,” Rosenthal added. “MaxWave formally concluded at the end of last year although two lines of work are carrying on from it ? one is to improve ship design by learning how ships are sunk, and the other is to examine more satellite data with a view to analysing if forecasting is possible.”

A new research project called WaveAtlas will use two years worth of ERS imagettes to create a worldwide atlas of rogue wave events and carry out statistical analyses. The Principal Investigator is Susanne Lehner, Associate Professor in the Division of Applied Marine Physics at the University of Miami, who also worked on MaxWave while at DLR, with Rosental a co-investigator on the project.

“Looking through the imagettes ends up feeling like flying, because you can follow the sea state along the track of the satellite,” Lehner said. “Other features like ice floes, oil slicks and ships are also visible on them, and so there’s interest in using them for additional fields of study.

“Only radar satellites can provide the truly global data sampling needed for statistical analysis of the oceans, because they can see through clouds and darkness, unlike their optical counterparts. In stormy weather, radar images are thus the only relevant information available.”

So far some patterns have already been found. Rogue waves are often associated with sites where ordinary waves encounter ocean currents and eddies. The strength of the current concentrates the wave energy, forming larger waves ? Lehner compares it to an optical lens, concentrating energy in a small area.

This is especially true in the case of the notoriously dangerous Agulhas current off the east coast of South Africa, but rogue wave associations are also found with other currents such as the Gulf Stream in the North Atlantic, interacting with waves coming down from the Labrador Sea.

However the data show rogue waves also occur well away from currents, often occurring in the vicinity of weather fronts and lows. Sustained winds from long-lived storms exceeding 12 hours may enlarge waves moving at an optimum speed in sync with the wind ? too quickly and they’d move ahead of the storm and dissipate, too slowly and they would fall behind.

“We know some of the reasons for the rogue waves, but we do not know them all,” Rosenthal concluded. The WaveAtlas project is scheduled to continue until the first quarter of 2005.

Original Source: ESA News Release

Aura Finally Launches

Aura, a mission dedicated to the health of the Earth’s atmosphere, successfully launched today at 6:01:59 a.m. EDT (3:01:59 a.m. PDT) from Vandenberg Air Force Base, Calif., aboard a Boeing Delta II rocket. Spacecraft separation occurred at 7:06 a.m. EDT (4:06 a.m. PDT), inserting Aura into a 438-mile (705-kilometer) orbit.

NASA’s latest Earth-observing satellite, Aura will help us understand and protect the air we breathe.

“This moment marks a tremendous achievement for the NASA family and our international partners. We look forward to the Aura satellite offering us historic insight into the tough issues of global air quality, ozone recovery and climate change,” said NASA Associate Administrator for Earth Science Dr. Ghassem Asrar. “This mission advances NASA’s exploration of Earth and will also better our understanding of our neighbors in the planetary system. Aura joins its siblings, Terra, Aqua and 10 more research satellites developed and launched by NASA during the past decade, to study our home planet,” he added.

Aura will help answer three key scientific questions: Is the Earth’s protective ozone layer recovering? What are the processes controlling air quality? How is the Earth’s climate changing? NASA expects early scientific data from Aura within 30-90 days.

Aura also will help scientists understand how the composition of the atmosphere affects and responds to Earth’s changing climate. The results from this mission will help scientists better understand the processes that connect local and global air quality.

Each of Aura’s four instruments is designed to survey different aspects of Earth’s atmosphere. Aura will survey the atmosphere from the troposphere, where mankind lives, through the stratosphere, where the ozone layer resides and protects life on Earth.

With the launch of Aura, the first series of NASA’s Earth Observing System satellites is complete. The other satellites are Terra, which monitors land, and Aqua, which observes Earth’s water cycle.

Aura’s four instruments are: the High Resolution Dynamics Limb Sounder (HIRDLS); the Microwave Limb Sounder (MLS); the Ozone Monitoring Instrument (OMI); and the Tropospheric Emission Spectrometer (TES). HIRDLS was built by the United Kingdom and the United States. OMI was built by the Netherlands and Finland in collaboration with NASA. NASA’s Jet Propulsion Laboratory in Pasadena, Calif., constructed TES and MLS. NASA’s Goddard Space Flight Center, Greenbelt, Md., manages the Aura mission.

“Many people have worked very hard to reach this point and the entire team is very excited,” said Aura Project Manager Rick Pickering of Goddard.

NASA’s Earth Science Enterprise is dedicated to understanding the Earth as an integrated system and applying Earth System Science to improve prediction of climate, weather and natural hazards using the unique vantage point of space.

For Aura information and images on the Internet, visit:

http://www.gsfc.nasa.gov/topstory/2004/0517aura.html

and

http://www.nasa.gov/aura

Original Source: NASA News Release

Two Ecosystems in Antarctica’s Vostok?

Scientists from the Lamont-Doherty Earth Observatory (LDEO) at Columbia University and Rensselaer Polytechnic Institute in New York State have developed the first-ever map of water depth in Lake Vostok, which lies between 3,700 and 4,300 meters (more than 2 miles) below the continental Antarctic ice sheet. The new comprehensive measurements of the lake?roughly the size of North America’s Lake Ontario?indicate it is divided into two distinct basins that may have different water chemistry and other characteristics. The findings have important implications for the diversity of microbial life in Lake Vostok and provide a strategy for how scientists study the lake?s different ecosystems should international scientific consensus approve exploration of the pristine and ancient environment.

Michael Studinger, of the Lamont-Doherty Earth Observatory (LDEO) at Columbia University, said that the existence of two distinct regions with the lake would have significant implications for what sorts of ecosystems scientists should expect to find in the lake and how they should go about exploring them.

“The ridge between the two basins will limit water exchange between the two systems,” he said. “Consequently, the chemical and biological composition of these two ecosystems is likely to be different.”

The National Science Foundation (NSF), an independent federal agency that supports fundamental research and education across all fields of science and engineering, supported the work. NSF manages the U.S. Antarctic Program, which coordinates almost all U.S. science on the southernmost continent.

The new measurements are significant because they provide a comprehensive picture of the entire lakebed and indicate that the bottom of the lake contains a previously unknown, northern sub-basin separated from the southern lakebed by a prominent ridge.

Using laser altimeter, ice-penetrating radar and gravity measurements collected by aircraft, Studinger and Robin Bell, of LDEO, and Anahita Tikku, formerly of the University of Tokyo and now at Rensselaer Polytechnic Institute, estimate that Lake Vostok contains roughly 5400 cubic kilometers (1300 cubic miles) of water. Their measurements also indicate that the top of the ridge dividing the two basins is only 200 meters (650 feet) below the bottom of the icesheet. Elsewhere, the water ranges from roughly 400 meters (1,300 feet) deep in the northern basin to 800 meters (2,600 feet) deep in its southern counterpart.

Water that passes through the lake starts on one end as melted ice from the very bottom of the ice sheet, which refreezes at the other end. According to the new measurements, the base of the ice sheet melts predominantly over the smaller northern basin, while the water in the lake refreezes over the larger southern basin. The researchers assert that water takes between 55,000 and 110,000 years to cycle through the lake.

The arrangement of the two basins, their separation and the characteristics of the meltwater may, the scientists conclude, all have implications for the circulation of water within the lake. It is possible, for example, that if the water in the lake were fresh, meltwater in the northern basin would sink to the bottom of that basin, limiting the exchange of waters between the two basins. The meltwater in the adjacent basin likely would be different.

The two lake basins, they argue, could therefore have very different bottoms.

The scientists also point out that the waters of the two basins may, as a result of the separation, have a very different chemical and even biological composition. Indeed, Lake Vostok, is also of interest to those who search for microbial life elsewhere in the solar system. The lake is thought to be a very good terrestrial analog of the conditions on Europa, a frozen moon of Jupiter. If life can exist in Vostok, scientists have argued, then microbes also might thrive on Europa.

The new measurements also indicate that different strategies may be needed to target sampling of specific types of lake sediments. Those released from the ice sheet represent the rocks over which the ice traveled, for example, and would be more prominent in the northern basin. Material in the southern basin would be more likely to represent the environmental conditions before the ice sheet sealed off the lake.

Scientists deciding whether and how to proceed with an exploration of Lake Vostok say a great deal of technological development would likely be needed before a device could be deployed to conduct contamination-free sampling. Currently, no scientific sampling of the lake is being carried out.

The ultimate goal of any sampling would be to obtain water and sediment samples from the lake bottom.

The team published the new maps in the June 19 edition of Geophysical Research Letters, a publication of the American Geophysical Union.

Original Source: NSF News Release

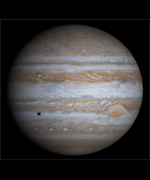
Earth’s Oceans are Banded Like Jupiter’s Clouds

Image credit: NASA/JPL
In a study published in Geophysical Research Letters (Vol. 31, No.13), University of South Florida College of Marine Science professor Boris Galperin explained a link between the movement and appearance of ocean currents on Earth and the bands that characterize the surface of Jupiter and some other giant planets.

“The banded structure of Jupiter has long been a subject of fascination and intensive research,”said Galperin, a physical oceanographer who analyzes turbulence theory and applies theory and numerical modeling to analyze planetary processes. “The visible bands on Jupiter are formed by clouds moving along a stable set of alternating flows.”

Galperin and colleagues have discovered that the oceans on Earth also harbor stable alternating bands of current that, when modeled, reveal a striking similarity to the bands on Jupiter due to the same kinds of “jets.”

“We think this resemblance is more than just visual,” he said. “The energy spectrum of the oceanic jets obeys a power law that fits the spectra of zonal flows on the outer planets.”

The observation begs the question of whether the similar phenomena are rooted in similar physical forces.

“To answer this question,” said Galperin, “one needs to determine what physical processes govern the large-scale dynamics in both systems.”

According to Galperin, there is a similarity in the forcing agents for planetary and oceanic circulations. The study maintains that both sets of zonal jets – the ocean’s bands of currents and the bands of Jupiter’s clouds – are the result of an underlying turbulent flow regime common in nature.

Comparing the energy spectra on giant planets and in the Earth’s oceans can yield valuable information about the transport properties of the oceans, said Galperin, especially about the strongest currents in the mid-depth ocean.

“The implications of these findings for climate research on Earth and the designs of future outer space observational studies are important,” he explained.

Galperin (http://www.marine.usf.edu/phy/galperin.html) and colleagues Hideyuki Nakano, Meteorological Research Institute, Ibaraki, Japan; Huei-Ping Huang, Lamont-Dougherty Earth Observatory of Columbia University, Palisades, New York; and Semion Sukoriansky, Center for Aeronautical Engineering Studies, Ben Gurion University of the Negev, Beer-Sheva, Israel, reported their research at the 25th Conference of the International Union of Geodesy and Geophysics’s Committee on Mathematical Geophysics, held June 16-18 at Columbia University.

Funding for the study came from the Army Research Office and the Israel Science Foundation.

Original Source: USF News Release

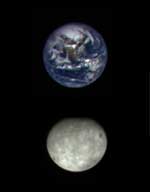
Japanese Spacecraft Images Earth and Moon on Flyby

Image credit: JAXA
The Space Engineering Spacecraft “Hayabusa” (MUSES-C) launched on May 9, 2003, by the Japan Aerospace Exploration Agency (JAXA) has been flying smoothly in a heliocentric orbit for about a year using its ion engines.
On May 19, Hayabusa came close to the Earth, and successfully carried out an earth swing-by to place it in a new elliptical orbit toward the asteroid “ITOKAWA”.

The earth swing-by is a technique to significantly change direction of an orbit and/or speed by using the Earth’s gravity without consuming onboard propellant. Hayabusa came closest to the Earth at 3:22 p.m. on May 19 (Japan Standard Time) at an altitude of approximately 3700 km.

The combination of acceleration by the ion engines and the earth swing-by performed this time was the first technological verification in the world, both in the sense of plot and implementation.
After its precise orbit is determined in a week, Hayabusa will restart its ion engines to fly toward “ITOKAWA”.
Hayabusa acquired earth images using its onboard optical navigation camera (which is for detecting a relative position to an asteroid and for scientific observations) as it neared the Earth. You can find these images at the following websites:

Institute of Space and Astronautical Science (ISAS)
http://www.isas.jaxa.jp/e/index.shtml

Original Source: JAXA News Release

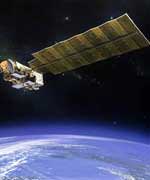
New Satellite to Assess the Health of the Earth’s Atmosphere

Image credit: NASA/JPL
On June 19, NASA will launch Aura, a next generation Earth- observing satellite. Aura will supply the best information yet about the health of Earth’s atmosphere.

Aura will help scientists understand how atmospheric composition affects and responds to Earth’s changing climate. The satellite will help reveal the processes that connect local and global air quality. It will also track the extent to which Earth’s protective ozone layer is recovering.

Aura will carry four instruments designed to survey different aspects of Earth’s atmosphere. The instruments will provide an unprecedented and complete picture of the composition of the atmosphere. Aura will survey the atmosphere from the troposphere, where mankind lives, through the stratosphere, where the ozone layer resides and protects life on Earth.

Aura’s space-based view of the atmosphere and its chemistry will complete the first series of NASA’s Earth Observing System satellites. The other satellites are Terra, which monitors land; and Aqua, which observes Earth’s water cycle.

“Gaining this global view of Earth will certainly reap new scientific discoveries that will serve as essential stepping stones to our further exploration of the Moon, Mars and beyond, the basis of the Vision for Space Exploration,” NASA Administrator Sean O’Keefe said.

Aura will help answer key scientific questions, including whether the ozone layer is recovering. Aura data may prove useful in determining the effectiveness of international agreements that banned ozone-depleting chemicals like chlorofluorocarbons (CFCs).

Aura will accurately detect global levels of CFCs and their byproducts, chlorine and bromine, which destroy ozone. Aura will also track the sources and processes controlling global and regional air quality. It will help distinguish between natural and human-caused sources of these gases. When ozone exists in the troposphere, it acts as an air pollutant. Tropospheric ozone is linked to high levels of precursors such as nitrogen dioxide, carbon monoxide and volatile hydrocarbons. Aura will help scientists follow the sources of tropospheric ozone and its precursors.

“Aura, the first comprehensive laboratory in space to help us better understand the chemistry and composition of the Earth’s atmosphere, is fundamentally a mission to understand and protect the very air we breathe, ” said NASA Associate Administrator for Earth Science Dr. Ghassem Asrar. “It is also a perfect complement to our other Earth Observing System satellites that, together, will aid our nation and our neighbors by determining the extent, causes, and regional consequences of global change.”

As the composition of Earth’s atmosphere changes, so does its ability to absorb, reflect and retain solar energy. Greenhouse gases, including water vapor, trap heat in the atmosphere. Airborne aerosols from human and natural sources absorb or reflect solar energy based on color, shape, size and substance. The impact of aerosols, tropospheric ozone and upper tropospheric water vapor on Earth’s climate remains largely unquantified. Aura’s ability to monitor these agents will help unravel some of their mystery.

Aura’s four instruments, the High Resolution Dynamics Limb Sounder; the Microwave Limb Sounder; the Ozone Monitoring Instrument; and the Tropospheric Emission Spectrometer will work together to provide measurements in the troposphere and stratosphere to help answer important climate questions.

The High Resolution Dynamics Limb Sounder was built by the United Kingdom and the United States. The Ozone Monitoring Instrument was built by the Netherlands and Finland in collaboration with NASA. NASA’s Jet Propulsion Laboratory, Pasadena, Calif., constructed the Tropospheric Emission Spectromer and Microwave Limb Sounder. NASA’s Goddard Space Flight Center, Greenbelt, Md., manages the Aura mission.

NASA’s Earth Science Enterprise is dedicated to understanding the Earth as an integrated system and applying Earth System Science to improve prediction of climate, weather, and natural hazards using the unique vantage point of space.

Original Source: NASA News Release

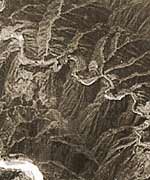
Great Wall From Space

Image credit: ESA
ESA’s Proba satellite here shows a winding segment of the 7240-km long Great Wall of China situated just northeast of Beijing. The Great Wall’s relative visibility or otherwise from orbit has inspired much recent debate.

The 21 hours spent in space last October by Yang Liwei – China’s first ever space traveller – were a proud achievement for his nation. The only disappointment came as Liwei informed his countrymen he had not spotted their single greatest national symbol from orbit.

“The Earth looked very beautiful from space, but I did not see our Great Wall,” Liwei told reporters after his return.

China has cherished for decades the idea that the Wall was just about the only manmade object visible to astronauts from space, and the news disappointed many. A suggestion was made that the Wall be lit up at night so it can definitely be seen in future, while others called for school textbooks to be revised to take account of Liwei’s finding.

However such revisions may be unnecessary, according to American astronaut Eugene Cernan, speaking during a visit to Singapore: “In Earth’s orbit at a height of 160 to 320 kilometres, the Great Wall of China is indeed visible to the naked eye.”

Liwei may well have been unlucky with the weather and local atmospheric or light conditions ? with sufficiently low-angled sunlight the Wall’s shadow if not the Wall itself could indeed be visible from orbit.

What is for sure is that what the human eye may not be able to see, satellites certainly can. Proba’s High Resolution Camera (HRC) acquired this image of the Wall from 600 km away in space. The HRC is a black and white camera that incorporates a miniature Cassegrain telescope, giving it far superior spatial resolution to the human eye.

So while the HRC resolves mad-made objects down to five square metres, astronauts in low Earth orbit looking with the naked eye can only just make out such large-scale artificial features as field boundaries between different types of crops or the grid shape formed by city streets. They require binoculars or a zoom lens to make out individual roads or large buildings.

China’s Great Wall
Proba (Project for On Board Autonomy) is an ESA micro-satellite built by an industrial consortium led by the Belgian company Verhaert, launched in October 2001 and operated from ESA’s Redu Ground Station (Belgium).

Orbiting 600 km above the Earth?s surface, Proba was designed to be a one-year technology demonstration mission of the Agency but has since had its lifetime extended as an Earth Observation mission. It now routinely provides scientists with detailed environmental images thanks to CHRIS – a Compact High Resolution Imaging Spectrometer developed by UK-based Sira Electro-Optics Ltd – one of the main payloads on the 100 kg spacecraft.

Also aboard is the HRC, a small-scale monochromatic camera made up of a miniature Cassegrain telescope and a 1024 x 1024 pixel Charge-Coupled Device (CCD), as used in ordinary digital cameras, taking 25-km square images to a resolution of five metres. Proba boasts an ‘intelligent’ payload and has the ability to observe the same spot on Earth from a number of different angles and different combinations of optical and infra-red spectral bands. A follow-on mission, Proba-2, is due to be deployed by ESA around 2005.

Original Source: ESA News Release