Mystery of Saturn’s Wonky B Ring: Solved

Vertical structures, among the tallest seen in Saturn's main rings, rise abruptly from the edge of Saturn's B ring to cast long shadows on the ring in this image taken by NASA's Cassini spacecraft in 2009.

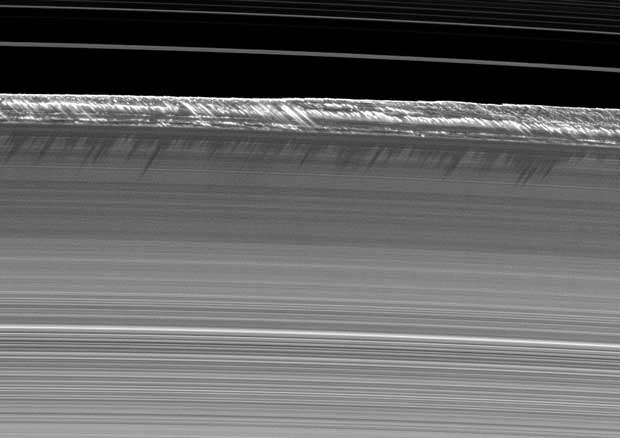
It has long been known that Saturn’s rings are not the perfect hoops they appear as in small amateur telescopes, and when the Cassini spacecraft entered orbit around Saturn, the wonky disorder of the massive B ring became even more apparent. Scientists were stunned by towering vertical structures, scalloped edges on the rings, and odd propeller-like features. But scientists have now found the cause of these strange features: The region is acting just like a spiral galaxy, said Carolyn Porco, team lead of the Cassini imaging team.

“We have found what we hoped we’d find when we set out on this journey with Cassini nearly 13 years ago,” said Porco, “(and have gotten) visibility into the mechanisms that have sculpted not only Saturn’s rings, but celestial disks of a far grander scale, from solar systems, like our own, all the way to the giant spiral galaxies.”

The B ring is one of the most dynamic areas in Saturn’s rings, and surprisingly, scientists say, the rings are behaving like a miniature version of our own Milky Way galaxy.

When the the Voyager spacecraft flew by Saturn in 1980 and 1981, scientists saw that the outer edge of the planet’s B ring was shaped like a rotating, flattened football by the gravitational perturbations of Mimas. But it was clear, even in Voyager’s findings, that the outer B ring’s behavior was far more complex than anything Mimas alone might do.

Vertical Structures Tower over Saturn's B-Ring. This image was rendered using Autodesk Maya and Adobe Photoshop. Credit: Kevin Gill.
Vertical Structures Tower over Saturn’s B-Ring. This image was rendered using Autodesk Maya and Adobe Photoshop. Credit: Kevin Gill.

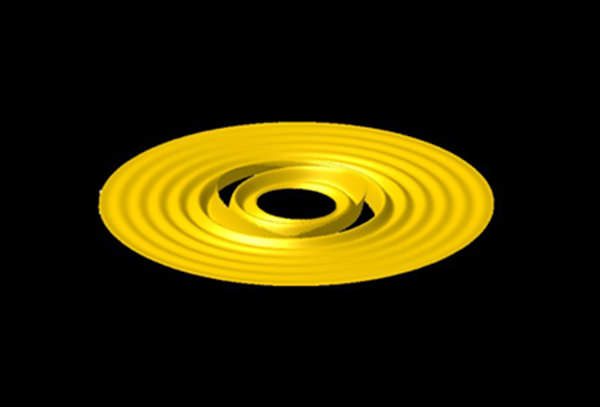
Through the analysis of thousands of Cassini images of the B ring taken over a four-year period, Porco and her team have found the source of most of the complexity: at least three additional, independently rotating wave patterns, or oscillations, that distort the B ring’s edge.

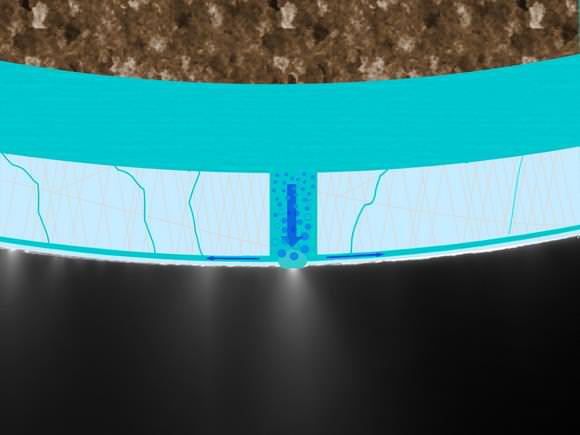
The oscillations travel around the ring with differing speeds and the small, random motions of the ring particles feed energy into a wave that propagates outward across the ring from an inner boundary, reflects off the outer edge of the B ring (which becomes distorted as a result), and then travels inward until it reflects off the inner boundary. This continuous back-and-forth reflection is necessary for these wave patterns to grow and become visible as distortions in the outer edge of the B ring.

Watch a video of the oscillations.

And see more “movies” at the CICLOPS website.

These oscillations, with one, two or three lobes, are not created by any moons. They have instead spontaneously arisen, in part because the ring is dense enough, and the B ring edge is sharp enough, for waves to grow on their own and then reflect at the edge.

The ring particles’ small, random motions feed energy into a wave and cause it to grow. The new results confirm a Voyager-era predication that this same process can explain all the puzzling chaotic waveforms found in Saturn’s densest rings, from tens of meters up to hundreds of kilometers wide.

“This process has already been verified to produce wave features in Saturn’s dense rings that are of small scale…about 150 meters or so,” Porco wrote in her “Captain’s Log” feature on the CICLOPS (Cassini imaging)website. “That it now also appears to produce waves of large, hundreds-of-kilometers scale in the outer B ring suggests that it can operate in dense rings on all spatial scales.”

“These oscillations exist for the same reason that guitar strings have natural modes of oscillation, which can be excited when plucked or otherwise disturbed,” said Joseph Spitale, Cassini imaging team associate and lead author of a new article in the Astronomical Journal, published today. “The ring, too, has its own natural oscillation frequencies, and that’s what we’re observing.”

Astronomers believe such “self-excited” oscillations exist in other disk systems, like spiral disk galaxies and proto-planetary disks found around nearby stars, but they have not been able to directly confirm their existence. The new observations confirm the first large-scale wave oscillations of this type in a broad disk of material anywhere in nature.

Self-excited waves on small, 100-meter (300-foot) scales have been previously observed by Cassini instruments in a few dense ring regions and have been attributed to a process called “viscous overstability.”

Oscillations in Saturn's B ring. Credit: Space Science Institute

“Normally viscosity, or resistance to flow, damps waves — the way sound waves traveling through the air would die out,” said Peter Goldreich, a planetary ring theorist at the California Institute of Technology. “But the new findings show that, in the densest parts of Saturn’s rings, viscosity actually amplifies waves, explaining mysterious grooves first seen in images taken by the Voyager spacecraft.”

“How satisfying it is to find at last one explanation for most, if not all, of the chaotic looking structure we first saw in Saturn’s dense ring regions long ago with Voyager,” said Porco, “and have since seen in exquisite detail with Cassini.”

Source: JPL, CICLOPS

Warm ‘Perrier’ Ocean Could be Powering Enceladus’ Geysers

Proposed 'Perrier' Ocean for Enceladus. Credit: NASA/JPL/Space Science Institute

[/caption]

Bottled water companies take note: an exotic form of warm, bubbly mineral water could be what feeds the mysterious jets spraying from the south polar region of Saturn’s moon Enceladus. A new model of the sub-surface ocean explains how the small moon could be so cryo-volcanically active. The Cassini spacecraft has detected sodium and potassium salts, as well as carbonates in the water vapor plumes spewing from the moon, which indicates a liquid, bubbly subsurface ocean. “There is a plume chamber, where some of the bubbles can pop the cap of the thin ice crust, and through that process is how the plumes get sprayed out,” said Dennis Matson, a NASA planetary scientist from JPL, speaking at a press briefing at the American Astronomical Society’s Division for Planetary Sciences meeting in Pasadena, California.

The schematic image (top) is laid on top of a picture of the Enceladus jets taken by Cassini’s imaging cameras in November 2009. It shows bubbles in subsurface seawater traveling through a passage in the ice crust to feed a geyser. The water flows back down to the subsurface ocean through cracks in the ice.

Matson explained the process:

“What we think is going on is that Enceladus has a subsurface ocean where water, heat and chemicals are stored before they erupt,” he said. There is an ice crust, many tens of kilometers thick. The ocean is gas rich, — and previous researchers dubbed such an ocean as a ‘Perrier’ ocean -– which basically “pops the cap” of the ice crust.

“What is happening is that water comes up and pressure is released,” said Matson. “Gases and water come out and the bubbles come near the surface and supply materials to the plumes. Water also transfers laterally, to a great extent, from the point of the plumes. This transfers heat to the surface, by analogy, like the radiator on your car. You have water coming out, which transfers heat to the thin ice layer, and then the heat is radiated to space. Cooled water goes down through cracks in the ice where it gets ready for another trip to the surface. “

This image compares heat flow at Earth and Saturn’s moon Enceladus. Credit: NASA/JPL

Cassini also found an impressive amount of heat flow over a small area coming from Enceladus’ interior. About four years ago, Cassini’s composite infrared spectrometer instrument detected a heat flow in the south polar region of at least 6 gigawatts, the equivalent of at least a dozen electric power plants. This is at least three times as much heat as an average region of Earth of similar area would produce, despite Enceladus’ small size.

“To put the heat flow in perspective,” said Matson, “the heat flow for the Earth has 87 of these units, but on the south pole of Enceladus, 250 units. At Yellowstone, there are 2500 units, but at one of the tiger stripe hots spots on Enceladus, we find heat flow as big as 13,000 units.”

The heat is, of course, relative to the surrounding environment. The subsurface bubbly water is probably just below freezing, which is 273 degrees Kelvin or 32 degrees Farenheit, whereas the surface is a frigid 80 degrees Kelvin or -316 degrees Farenheit. However, Matson said they have also seen surface temperatures as high as 180 K, when only 70 K was expected at the south pole.

Cassini imaging scientists used views like this one to help them identify the source locations for individual jets spurting ice particles, water vapor and trace organic compounds from the surface of Saturn's moon Enceladus. Credit: NASA

Finding the sodium in the icy grains in the plume is huge piece of evidence pointing to a subsurface ocean. Previously, Earth-based observations did not detect salts in the plume, and so scientists didn’t think a liquid ocean was possible. But infrared observations with an instrument on Cassini found the particles in the plumes include water ice, and substantial amounts of sodium and potassium salts and carbonates, as well as organics.

“The sodium was hiding in the little grains,” Matson said. “In the case of Enceladus, sodium isn’t in the vapor, it’s in the solid particles. This was something entirely new that had not been seen elsewhere.”

Also new is that the heat from Enceladus appears to be originating in the ocean, and also the realization there is a circulation system inside the moon, where there is process of pumping the water to the surface.

“This process we’ve outlined, where getting the water up to the surface, you have the heat, the water, and sodium and potassium all from one source that brings that up to the surface. So you have one process that delivers all those things, whereas before we had separate processes to try and explain each of them.”

Source: DPS press briefing

Titan-ic Tsunami Causing Crack in Saturn’s C Ring

This graphic shows an angled view of a newly discovered “crack” in one of Saturn’s rings, known as the C ring. This view shows the 3-D quality of the puzzling crack associated with a wave-like feature that was discovered earlier by NASA’s Voyager 1 spacecraft. Image credit: NASA/JPL/Cornell

[/caption]

Saturn’s rings have several gaps, most of which are caused by small moons shepherding ring debris into breaks in the rocky rings. But one gap may be caused by gravitational perturbations from Saturn’s largest moon, Titan, sending tsunami-like waves up to 3 kilometers (2 miles) high in the C ring. This causes one region of the ring to spin like a warped, uneven vinyl record on a turntable. A new model of this action explains why the gap was narrower than expected and also why is seems to disappear from time to time. “What looked like a 15-kilometer-wide gap actually was this gap with a vertical displacement of about 3 kilometers projected and seen almost edge on,” said Phillip Nicholson from Cornell University, speaking at a press briefing at the American Astronomical Society’s Division for Planetary Sciences meeting in Pasadena, California. “It’s a little like a tsunami propagating away from an earthquake fault.”

The Cassini spacecraft looks close at Saturn to frame a view encompassing the entire C ring. Image credit: NASA/JPL/SSI

The gap in the middle of the C ring has been known since Voyager 1 flew by Saturn in the 1980, and it appeared there was a 15 km-wide gap. But when Cassini arrived in 2004 and began observations, the gap was only 2 km (1.5 miles) and sometimes it wasn’t there at all.

Nicholson said only when they began to think in three dimensions were they able to solve the mystery of this gap. While most of Saturn’s rings are flat, in 2009, the angle of sunlight during Saturn’s spring equinox revealed there were lumps and bumps in the rings are as high as the Rocky Mountains.

The model Nicholson and colleagues created suggests the actual gap in the ring is about a half a kilometer wide, but part of the ring rises 3 km (2 miles) in the air up. The different angles the two spacecraft observed from made the gap look wider to Voyager than to Cassini.

“The whole pattern rotates around at the same rate as the satellite Titan orbits Saturn, once every 16 days,” said Nicholson said. Sometimes, the tsunami-like wave couldn’t be seen by the spacecraft, which accounts for how the gap seems to appear and disappear.

Nicholson said this model explains the C ring gap, “better than you have any right to expect,” but there could be three or four dynamical processes going on that explains the other gaps.

Nicholson and Cassini Deputy Project Scientist Linda Spilker said the same types of processes seen in Saturn’s rings could also explain what is seen in disks of debris around other stars, with the theory that there are gaps forming in the disks associated with the formation of planets.

New insights into the nature of Saturn’s rings are revealed in this panoramic mosaic of 15 images taken during the planet’s August 2009 equinox. Image credit: NASA/JPL/SSI

“Saturn provides a wonderful natural laboratory of how protoplanetary nebula may evolve,” said Spilker.

The Cassini scientists also noted how the Cassini mission has now moved past the “Equinox” mission and is now in another extension of the mission called the Solstice mission, which will keep the spacecraft going until 2017.

Spilker shared how as the end of the mission approaches, they might try some riskier moves, such as try flying between Saturn’s D ring or heading into Saturn’s into upper atmosphere to “study new things about planet itself, for the end of the mission.”

Source: DPS meeting webcast

Simply Astonishing: Enceladus, the Jet-Powered Moon

The plumes of Enceladus are highlighted in this Cassini image. Credit: NASA/JPL/Space Science Institute

[/caption]

What an astonishing view of Saturn’s moon Enceladus, as seen by Cassini! At least four different plumes of water ice are spewing out from the south polar region, highlighted because of the black space behind the Moon. On Twitter, Carolyn Porco said that we see four jets because we’re looking down the four tiger stripe fractures crossing the south pole. “How lovely it is to know!” she added.

Cassini was about 617,000 kilometers (383,000 miles) away from Enceladus when it captured this image.

More info: Cassini website

Largest Clouds Ever Seen on Titan

Clouds on Titan seen by the Cassini spacecraft on Sept. 27. 2010. Credit: NASA/JPL/Space Science Institute

[/caption]

The Cassini spacecraft recently swooped by Saturn’s largest moon Titan and captured images of large patches of clouds. “These are some of the largest clouds our cameras on Cassini have yet seen on Titan!” said Carolyn Porco, Cassini imaging team lead, in an email announcing the image. “And the fact that we see them in the equatorial region is big news and may signify seasonal change is underway!”

The image was taken on September 27, 2010 and received on Earth September 28, 2010 at a distance of approximately 1,282,259 kilometers away. The spacecraft was actually at its closest approach on Sept. 24, and took a long, sustained look at the hazy moon, coming within 8,175 kilometers (5,080 miles) above the hazy moon’s surface.

Cassini’s visual and infrared mapping spectrometer also took a look at these clouds, so look for more information soon about this large region of clouds.

Cassini also used its composite infrared spectrometer instrument to take a look at Titan’s stratosphere to learn more about its vertical structure as the seasons change.

This flyby is the first in a series of high-altitude Titan flybys for Cassini over the next year and a half.

See a larger version of the image at the CICLOPS website.

Conjoined Moons

Saturn's moons Dione and Rhea appear conjoined in this optical illusion-like image taken by the Cassini spacecraft. Credit: NASA/JPL/Space Science Institute

[/caption]

This latest image from the Cassini spacecraft will make you do a double-take! It is an optical illusion, but the two moons appear like conjoined, identical twins! The two moons are fairly close in size, but Dione, the smaller of the two at the top in the image, is actually closer to the spacecraft, making the two look almost identical. And because of the similar albedo, or reflectivity, of the two moons and because of the location of a particularly large crater near the south polar region of Dione, the moon appears blended seamlessly with Rhea. Double your pleasure!

Dione is 1123 kilometers (698 miles) across and Rhea is 1528 kilometers (949 miles) across.

The image was taken in visible light with the Cassini spacecraft narrow-angle camera on July 27, 2010.

See more about the image at the CICLOPS website.

Cassini Flies Through Saturn’s Aurora

Cassini crossed the radio aurora of Saturn on 17 October 2008, at a distance of 4 Saturn's radii above the atmosphere. These radio emissions, generated by fast electrons, are strongly beamed. They were characterised by simultaneous observations of three different experiments. Credit: NASA/JPL/University of Iowa/CNES/Observatoire de Paris

Saturn’s mysterious aurora has fascinated astronomers and space enthusiasts since it was first observed back in 1979. Now, the Cassini spacecraft has made the first observations from within the giant radio aurora of Saturn. The spacecraft flew through an active auroral region in 2008, and scientists say there are both similarities and contrasts between the radio auroral emissions generated at Saturn and those at Earth. Additionally, Cassini’s visual and infrared mapping spectrometer instrument (VIMS) took data to create a new movie (above) showing Saturn’s shimmering aurora over a two-day period. All this new data are helping scientists understand what drives some of the solar system’s most impressive light shows.

[/caption]

“So far, this is a unique event,” said Dr. Laurent Lamy at the European Planetary Science Congress in Rome this week. “Whereas the source region of Earth’s radio aurora has been studied by many missions, this is our first opportunity to observe the equivalent region at Saturn from the inside. From this single encounter, we have been able to build up a detailed snapshot of auroral activity using three of Cassini’s instruments. This gives us a fascinating insight into the processes that are generating Saturn’s radio aurora.”

See an animation created from the radio instrument on Cassini at this link. On the left hand side are the radio sources as seen from Cassini. The right hand side shows the projection of the radio sources down onto the southern pole of the planet. Credit: NASA/JPL/University of Iowa/CNES/Observatoire de Paris

Separately, Tom Stallard, lead scientist on a joint VIMS and Cassini magnetometer collaboration, presented the VIMS movie at the conference.

Source: European Planetary Science Congress

In the movie, the aurora phenomenon clearly varies significantly over the course of a Saturnian day, which lasts around 10 hours 47 minutes. On the noon and midnight sides (left and right sides of the images, respectively), the aurora can be seen to brighten significantly for periods of several hours, suggesting the brightening is connected with the angle of the sun. Other features can be seen to rotate with the planet, reappearing at the same time and the same place on the second day, suggesting that these are directly controlled by the orientation of Saturn’s magnetic field.

Image of Saturn’s aurora seen at ultraviolet wavelengths. The spiral shape seen here is similar to the distorted radio aurora visualised by the team and also indicates enhanced auroral activity. Credit: ESA/NASA/Hubble

“Saturn’s auroras are very complex and we are only just beginning to understand all the factors involved,” Stallard said. “This study will provide a broader view of the wide variety of different auroral features that can be seen, and will allow us to better understand what controls these changes in appearance.”
Auroras on Saturn occur in a process similar to Earth’s northern and southern lights. Particles from the solar wind are channeled by Saturn’s magnetic field toward the planet’s poles, where they interact with electrically charged gas (plasma) in the upper atmosphere and emit light. At Saturn, however, auroral features can also be caused by electromagnetic waves generated when the planet’s moons move through the plasma that fills Saturn’s magnetosphere.

This false-color composite image shows Saturn’s rings and southern hemisphere. The composite image was made from 65 individual observations by Cassini’s visual and infrared mapping spectrometer in the near-infrared portion of the light spectrum on Nov. 1, 2008. Credit: NASA/JPL/University of Arizona

Titan Weather Report for Spring: Still Cold, but Clearing Skies

Left: T43 flyby of Titan - 12 May 2008 – VIMS images a large cloud that caps the north pole of Titan (yellowish tones). Right: T63 flyby of Titan - 12 December 2009 – VIMS still observes a huge cloud system at 40°S (yellowish tones) and the north pole of Titan free of clouds, a few months after the equinox. Credit: NASA/JPL/University of Arizona/University of Nantes/ University of Paris Diderot

[/caption]

The beauty of an extended space mission is that scientists can make long term observations and find out things we’ve never known before. The Cassini spacecraft’s Visual and Infrared Mapping Spectrometer (VIMS) instrument has been monitoring clouds on Titan continuously since the spacecraft went into orbit around Saturn in 2004, and a team led by Sébastien Rodriguez (AIM laboratory – Université Paris Diderot) has used more than 2,000 VIMS images to create the first long-term study of Titan’s weather. Are they ready to make a weather forecast? They say Titan’s northern hemisphere is set for mainly fine spring weather, with polar skies clearing since the equinox in August last year.

Together with Saturn in its 30-years orbit around the Sun, Titan has seasons that last for 7 terrestrial years. The team has observed significant atmospheric changes between July 2004 (early summer in the southern hemisphere) and April 2010, the very start of northern spring. The images showed that cloud activity has recently decreased near both of Titan’s poles. These regions had been heavily overcast during the late southern summer until 2008, a few months before the equinox.

“Over the past six years, we’ve found that clouds appear clustered in three distinct latitude regions of Titan: large clouds at the north pole, patchy cloud at the south pole and a narrow belt around 40 degrees south. However, we are now seeing evidence of a seasonal circulation turnover on Titan – the clouds at the south pole completely disappeared just before the equinox and the clouds in the north are thinning out. This agrees with predictions from models and we are expecting to see cloud activity reverse from one hemisphere to another in the coming decade as southern winter approaches,” said Dr Rodriguez.

Fractional cloud coverage in Titan’s atmosphere integrated between July 2004 and April 2010. Black areas are cloud free and yellow are fully covered. Credit: NASA/JPL/University of Arizona/University of Nantes/ University of Paris Diderot

The team has used results from the Global Climate Models (GCMs) developed by Pascal Rannou (Institut Pierre Simon Laplace) to interpret the evolution of the observed cloud patterns over time. Northern polar clouds of ethane form in the Titan’s troposphere during the winter at altitudes of 30-50 km by a constant influx of ethane and aerosols from the stratosphere. In the other hemisphere, mid- and high-latitudes clouds are produced by the upwelling from the surface of air enriched in methane. Observations of the location and activity of Titan’s clouds over long periods are vital in developing a global understanding of Titan’s climate and meteorological cycle.

In Feburary 2010, the Cassini mission was extended to a few months past Saturn’s northern summer solstice in May 2017. This means that Rodriguez and his team will be able to observe the seasonal changes right the way through from mid-winter to mid-summer in the northern hemisphere.

“We have learned a lot about Titan’s climate since Cassini arrived in at Saturn but there is still a great deal to learn. With the new mission extension, we will have the opportunity to answer some of the key questions about the meteorology of this fascinating moon,” said Rodriguez.

Rodriguez presented the results at the European Planetary Science Congress 2010 in Rome.

Source: European Planetary Science Conference

Stunning Flyover Videos of Saturn’s Moons

Saturn’s moons as you’ve never seen them before! By day, Dr. Paul Schenk works at the Lunar and Planetary Institute mapping the topography and geology of the moons of Saturn and Jupiter, as well as the icy bodies of the outer solar system. But because “it’s just plain cool,” he has created some flyover videos of Saturn’s satellites, using data from the Cassini spacecraft. Very cool, indeed! Above is a close-up, 3-D look at the walnut-shaped moon Iapetus. Scientists don’t know why there is a ridge along the moon’s equator, but in 2007, Cassini acquired a strip of color and stereo images along the ridge, and Schenk has created a flyover which shows the contrast in color and topography. There are “sharp peaks 15 to 20 kilometers above the surrounding dark cratered plains,” Schenk writes. “These are among the highest peaks in the Solar System. Patches of bright pure water ice can be seen flanking these dark peaks, which have the brightness of soot.”

And there’s more! Below is one of my favorites from Schenk’s collection of flyover videos, 3-D views of Inktomi, a very young crater on the moon Rhea.

Continue reading “Stunning Flyover Videos of Saturn’s Moons”

Amazing New Close-up Images of Enceladus

Caption: Looking down at a plume on Enceladus. Credit: NASA/Space Science Science Institute.

[/caption]

Oh, wow! This is one of the best images yet from the Cassini spacecraft of the “tiger stripes” in the south polar region of Saturn’s moon Enceladus. Over the weekend, Cassini flew by Enceladus, and has sent back some incredible new images, such as the one above. The tiger stripes are actually giant fissures that spew jets of water vapor and organic particles hundreds of kilometers, or miles, out into space, and here, Cassini is staring right down into one of the fissures. See more great images of Enceladus below, plus images of the moons Dione and Tethys.


Close-up of the cracked, crevassed surface of Enceladus. Credit: NASA/Space Science Institute.

While the winter is darkening the moon’s southern hemisphere, Cassini has its own version of “night vision goggles” — the composite infrared spectrometer instrument – to track heat even when visible light is low. It will take time for scientists to assemble the data into temperature maps of the fissures.

Enceladus against Saturn's limb. Credit: NASA/Space Science Institute.
More plumes on Enceladus. Credit: NASA/Space Science Institute.
Close-up of Tethys. Credit: NASA/Space Science Institute

Dione from 115,370 kilometers away. Credit: NASA/Space Science Institute

See more amazing images from Cassini’s latest at the CICLOPS website.

Emily Lakdawalla at the Planetary Blog also has created some very cool movies from the flyby images.


Hat tip to Stu Atkinson