Astro Apocalypse Won’t Happen Here

The afterglow of GRB 030329 (white dot in center of image). Image credit: ESA/NASA. Click to enlarge
Since gamma ray bursts release a torrent of radiation visible across the Universe, it goes without saying that we wouldn’t one to blow up near us. Well, don’t worry. According to researchers at Ohio State University, our Milky Way is the just wrong type of galaxy for potential bursts – they almost always happen within small, misshapen galaxies that lack heavy chemical elements. That’s good news, since a burst within 3,000 light years of the Earth would give us a lethal dose of radiation.

Are you losing sleep at night because you’re afraid that all life on Earth will suddenly be annihilated by a massive dose of gamma radiation from the cosmos?

Well, now you can rest easy.

Some scientists have wondered whether a deadly astronomical event called a gamma ray burst could happen in a galaxy like ours, but a group of astronomers at Ohio State University and their colleagues have determined that such an event would be nearly impossible.

Gamma ray bursts (GRBs) are high-energy beams of radiation that shoot out from the north and south magnetic poles of a particular kind of star during a supernova explosion, explained Krzysztof Stanek, associate professor of astronomy at Ohio State. Scientists suspect that if a GRB were to occur near our solar system, and one of the beams were to hit Earth, it could cause mass extinctions all over the planet.

The GRB would have to be less than 3,000 light years away to pose a danger, Stanek said. One light year is approximately 6 trillion miles, and our galaxy measures 100,000 light years across. So the event would not only have to occur in our galaxy, but relatively close by, as well.

In the new study, which Stanek and his coauthors submitted to the Astrophysical Journal, they found that GRBs tend to occur in small, misshapen galaxies that lack heavy chemical elements (astronomers often refer to all elements other than the very lightest ones — hydrogen, helium, and lithium — as metals). Even among metal-poor galaxies, the events are rare — astronomers only detect a GRB once every few years.

But the Milky Way is different from these GRB galaxies on all counts — it’s a large spiral galaxy with lots of heavy elements.

The astronomers did a statistical analysis of four GRBs that happened in nearby galaxies, explained Oleg Gnedin, a postdoctoral researcher at Ohio State. They compared the mass of the four host galaxies, the rate at which new stars were forming in them, and their metal content to other galaxies catalogued in the Sloan Digital Sky Survey.

Though four may sound like a small sample compared to the number of galaxies in the universe, these four were the best choice for the study because astronomers had data on their composition, Stanek said. All four were small galaxies with high rates of star formation and low metal content.

Of the four galaxies, the one with the most metals — the one most similar to ours — hosted the weakest GRB. The astronomers determined that the odds of a GRB occurring in a galaxy like that one to be approximately 0.15 percent.

And the Milky Way’s metal content is twice as high as that galaxy, so our odds of ever having a GRB would be even lower than 0.15 percent.

“We didn’t bother to compute the odds for our galaxy, because 0.15 percent seemed low enough,” Stanek said.

He figures that most people weren’t losing sleep over the possibility of an Earth-annihilating GRB. “I wouldn’t expect the stock market to go up as a result of this news, either,” he said. “But there are a lot of people who have wondered whether GRBs could be blamed for mass extinctions early in Earth’s history, and our work suggests that this is not the case.”

Astronomers have studied GRBs for more than 40 years, and only recently determined where they come from. In fact, Stanek led the team that tied GRBs to supernovae in 2003.

He and Gnedin explained that when a very massive, rapidly rotating star explodes in a supernova, its magnetic field directs gamma radiation to flow only out of the star’s north and south magnetic poles, forming high-intensity jets.

Scientists have measured the energies of these events and assumed — rightly so, Stanek said — that such high-intensity radiation could destroy life on a planet. That’s why some scientists have proposed that a GRB could have been responsible for a mass extinction that occurred on Earth 450 million years ago.

Now it seems that gamma ray bursts may not pose as much a danger to Earth or any other potential life in the universe, either, since they are unlikely to occur where life would develop.

Planets need metals to form, Stanek said, so a low-metal galaxy would probably have fewer planets, and fewer chances for life.

He added that he didn’t originally intend to address the question of mass extinctions. The study grew out of a group discussion during the Ohio State Department of Astronomy’s “morning coffee” — a daily half-hour where faculty and students review new astronomy journal articles that have been posted to Internet preprint servers overnight. In February, Stanek published a paper on a GRB he had observed, and during coffee someone asked whether he thought it was just a coincidence that these events seem to happen in small, metal-poor galaxies.

“My initial reaction was that it’s not a coincidence, and everyone just knows that GRBs happen in metal-poor galaxies. But then people asked, ‘Is it really that well known? Has anybody actually proven it to be true?’ And we realized that nobody had.”

As a result, the list of coauthors on the paper includes astronomers across a broad range of expertise, which Stanek said is somewhat unusual in these days of specialized research. The coauthors were among faculty gathered for coffee that day, plus a few friends they recruited to help them: Stanek and Gnedin; John Beacom, assistant professor of physics and astronomy; Jennifer Johnson, assistant professor of astronomy; Juna Kollmeier, a graduate student; Andrew Gould, Marc Pinsonneault, Richard Pogge, and David Weinberg, all professors of astronomy at Ohio State; and Maryam Modjaz, a graduate student at the Harvard-Smithsonian Center for Astrophysics.

This work was sponsored by the National Science Foundation.

Original Source: Ohio State University

Tumbling Neutron Star

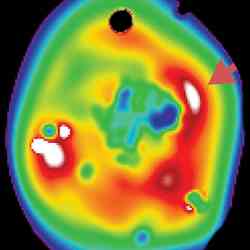
Pulsar RX J0720.4-3125 captured by XMM-Newton. Image credit: ESA/MPE. Click to enlarge
ESA’s orbiting X-ray telescope, the XMM-Newton space observatory, has located a neutron star that’s out of control. Researchers found that its temperature rose steadily for more than four years, but now it’s starting to decrease again. The object’s overall temperature isn’t changing, it’s just tumbling, and slowly displaying different areas to observers here on Earth – like a wobbling top. These observations will help astronomers understand some of the internal processes that govern these kinds of objects.

Using data from ESA’s XMM-Newton X-ray observatory, an international group of astrophysicists discovered that one spinning neutron star doesn’t appear to be the stable rotator scientists would expect. These X-ray observations promise to give new insights into the thermal evolution and finally the interior structure of neutron stars.

Spinning neutron stars, also known as pulsars, are generally known to be highly stable rotators. Thanks to their periodic signals, emitted either in the radio or in the X-ray wavelength, they can serve as very accurate astronomical ‘clocks’.

The scientists found that over the past four and a half years the temperature of one enigmatic object, named RX J0720.4-3125, kept rising. However, very recent observations have shown that this trend reversed and the temperature is now decreasing.

According to the scientists this effect is not due to a real variation in temperature, but instead to a changing viewing geometry. RX J0720.4-3125 is most probably ‘precessing’, that is it is slowly tumbling and therefore, over time, it exposes to the observers different areas of the surface.

Neutron stars are one of the endpoints of stellar evolution. With a mass comparable to that of our Sun confined into a sphere of 20-40 km diameter, their density is even somewhat higher than that of an atomic nucleus – a billion tonnes per cubic centimetre. Soon after their birth in a supernova explosion their temperature is of the order of 1 000 000 degrees celsius and the bulk of their thermal emission falls in the X-ray band of the electromagnetic spectrum. Young isolated neutron stars are slowly cooling down and it takes a million years before they become too cold to be observable in X-rays.

Neutron stars are known to possess very strong magnetic fields, typically several trillion times stronger than that of the Earth. The magnetic field can be so strong that it influences the heat transport from the stellar interior through the crust leading to hot spots around the magnetic poles on the star surface.

It is the emission from these hotter polar caps which dominates the X-ray spectrum. There are only a few isolated neutron stars known from which we can directly observe the thermal emission from the surface of the star. One of them is RX J0720.4-3125, rotating with a period of about eight and a half seconds. “Given the long cooling time scale it was therefore highly unexpected to see its X-ray spectrum changing over a couple of years,” said Frank Haberl from the Max-Planck-Institute for Extraterrestrial Physics in Garching (Germany), who led the research group.

“It is very unlikely that the global temperature of the neutron star changes that quickly. We are rather seeing different areas of the stellar surface at different times. This is also observed during the rotation period of the neutron star when the hot spots are moving in and out of our line of sight, and so their contribution to the total emission changes,” Haberl continued.

A similar effect on a much longer time scale can be observed when the neutron star precesses (similarly to a spinning top). In that case the rotation axis itself moves around a cone leading to a slow change of the viewing geometry over the years. Free precession can be caused by a slight deformation of the star from a perfect sphere, which may have its origin in the very strong magnetic field.

During the first XMM-Newton observation of RX J0720.4-3125 in May 2000, the observed temperature was at minimum and the cooler, larger spot was predominantly visible. On the other hand, four years later (May 2004) the precession brought into view mostly the second, hotter and smaller spot, that made the observed temperature increase. This likely explains the observed variation in temperature and emitting areas, and their anti-correlation.

In their work Haberl and colleagues developed a model for RX J0720.4-3125 which can explain many of the peculiar characteristics which have been a challenge to explain so far. In this model the long-term change in temperature is produced by the different fractions of the two hot polar caps which enter into view as the star precesses with a period of about seven to eight years.

In order for such a model to work, the two emitting polar regions need to have different temperatures and sizes, as it has been recently proposed in the case of another member of the same class of isolated neutron stars.

According to the team, RX J0720.4-3125 is probably the best case to study precession of a neutron star via its X-ray emission directly visible from the stellar surface. Precession may be a powerful tool to probe the neutron star interior and learn about the state of matter under conditions which we can not produce in the laboratory.

Additional XMM-Newton observations are planned to further monitor this intriguing object. “We are continuing the theoretical modelling from which we hope to learn more about the thermal evolution, the magnetic field geometry of this particular star and the interior structure of neutron stars in general,” Haberl concluded.

Original Source: ESA Portal

The Hunt for Gravity Waves


As part of his general theory of relativity, Einstein predicted that mass should emit gravity waves. They’ll be weak, though, so it would take very massive objects to produce waves detectable here on Earth. One experiment working towards their detection is the Laser Interferometer Gravitational-Wave Observatory (or LIGO). It should be able to detect the most powerful gravity waves as they pass through the Earth. And a space-based observatory planned for launch in 2015 called LISA should be stronger still.

Scientists are close to actually see gravitational waves. Image credit: NASA
Gravity is a familiar force. It’s the reason for fear of heights. It holds the moon to the Earth, the Earth to the sun. It keeps beer from floating out of our glasses.

But how? Is the Earth sending secret messages to the moon?

Well, yes — sort of.

Eanna Flanagan, Cornell associate professor of physics and astronomy, has devoted his life to understanding gravity since he was a student at University College Dublin in his native Ireland. Now, nearly two decades after leaving Ireland to study for his doctorate under the famous relativist Kip Thorne at the California Institute of Technology, his work focuses on predicting the size and shape of gravitational waves — an elusive phenomenon forecast by Einstein’s 1916 Theory of General Relativity but which have never been directly detected.

In 1974, Princeton University astronomers Russell Hulse and Joseph H. Taylor Jr. indirectly measured the influence of gravity waves on co-orbiting neutron stars, a discovery that earned them the 1993 Nobel Prize in physics. Thanks to the recent work of Flanagan and his colleagues, scientists are now on the verge of seeing the first gravity waves directly.

Sound cannot exist in a vacuum. It requires a medium, such as air or water, through which to deliver its message. Similarly, gravity cannot exist in nothingness. It, too, needs a medium through which to deliver its message. Einstein theorized that that medium is space and time, or the “spacetime fabric.”

Changes in pressure — a thump on a drum, a vibrating vocal cord — produce sound waves, ripples in air. According to Einstein’s theory, changes in mass — the collision of two stars, dust landing on a bookshelf — produce gravity waves, ripples in spacetime.

Because most everyday objects have mass, gravity waves should be all around us. So why can’t we find any?

“The strongest gravity waves will cause measurable disturbances on Earth 1,000 times smaller than an atomic nucleus,” explained Flanagan. “Detecting them is a huge technical challenge.”

The response to that challenge is LIGO, the Laser Interferometer Gravitational-Wave Observatory, a colossal experiment involving a collaboration of more than 300 scientists.

LIGO consists of two installations nearly 2,000 miles apart — one in Hanford, Wash., and one in Livingston, La. Each facility is shaped like a giant “L,” with two 2.5-mile-long arms made of 4-foot-diameter vacuum pipes encased in concrete. Ultra-stable laser beams traverse the pipes, bouncing between mirrors at the end of each arm. Scientists expect a passing gravity wave to stretch one arm and squeeze the other, causing the two lasers to travel slightly different distances.

The difference can then be measured by “interfering” the lasers where the arms intersect. It is comparable to two cars speeding perpendicularly toward a crossroads. If they travel the same speed and distance, they will always crash. But if the distances are different, they might miss. Flanagan and his colleagues are hoping for a miss.

Furthermore, exactly how much the lasers hit or miss will provide information about the characteristics and origin of the gravitational wave. Flanagan’s role is to predict these characteristics so that his colleagues at LIGO know what to look for.

Due to technological limits, LIGO is only capable of sensing gravitational waves of certain frequencies from powerful sources, including supernova explosions in the Milky Way and rapidly spinning or co-orbiting neutron stars in either the Milky Way or distant galaxies.

To expand potential sources, NASA and the European Space Agency are already planning LIGO’s successor, LISA, the Laser Interferometer Space Antenna. LISA is similar in concept to LIGO, except the lasers will bounce among three satellites 3 million miles apart trailing the Earth in orbit around the sun. As a result, LISA will be able to detect waves at lower frequencies than LIGO, such as those produced by the collision of a neutron star with a black hole or the collision of two black holes. LISA is scheduled for launch in 2015.

Flanagan and collaborators at the Massachusetts Institute of Technology recently deciphered the gravitational wave signature that results when a supermassive black hole swallows a sun-sized neutron star. It is a signature that will be important for LISA to recognize.

“When LISA flies we should see hundreds of these things,” noted Flanagan. “We will be able to measure how space and time are warped, and how space is supposed to be twisted around by a black hole. We see electromagnetic radiation, and we think it’s probably a black hole — but that’s about as far as we’ve got. It will be very exciting to finally see that relativity actually works.”

But, he warned, “It may not work. Astronomers observe that the expansion of the universe is accelerating. One explanation is that general relativity needs to be modified: Einstein was mostly right, but in some regimes things could work differently.”

Thomas Oberst is a science writer intern at the Cornell News Service.

Original Source: Cornell University

Twin Open Clusters by Hubble

Star clusters in small magellanic cloud. Image credit: ESA/NASA. Click to enlarge
The Hubble Space Telescope has captured these stunning images of open star clusters NGC 265 and NGC 290 in the Small Magellanic Cloud. The two clusters are about 200,000 light years away, and are roughly 65 light-years across. Clusters like this contain young stars roughly the same age, and born from the same cloud of interstellar gas. These clusters will eventually be broken apart by the gravity of other stars, gas clouds and clusters.

NASA’s Hubble Space Telescope has captured the most detailed images to date of the open star clusters NGC 265 and NGC 290 in the Small Magellanic Cloud – two sparkling sets of gemstones in the southern sky.

These images, taken with Hubble’s Advanced Camera for Surveys, show a myriad of stars in crystal clear detail. The brilliant open star clusters are located about 200,000 light-years away and are roughly 65 light-years across.

Star clusters can be held together tightly by gravity, as is the case with densely packed crowds of hundreds of thousands of stars, called globular clusters. Or, they can be more loosely bound, irregularly shaped groupings of up to several thousands of stars, like the open clusters shown in this image.

The stars in these open clusters are all relatively young and were born from the same cloud of interstellar gas. Just as old school-friends drift apart after graduation, the stars in an open cluster will only remain together for a limited time and gradually disperse into space, pulled away by the gravitational tugs of other passing clusters and clouds of gas. Most open clusters dissolve within a few hundred million years, whereas the more tightly bound globular clusters can exist for many billions of years.

Open star clusters make excellent astronomical laboratories. The stars may have different masses, but all are at about the same distance, move in the same general direction, and have approximately the same age and chemical composition. They can be studied and compared to find out more about stellar evolution, the ages of such clusters, and much more.

The Small Magellanic Cloud, which hosts the two star clusters, is one of the small satellite galaxies of the Milky Way. It can be seen with the unaided eye as a hazy patch in the constellation Tucana (the Toucan) in the Southern Hemisphere. The Small Magellanic Cloud is rich in gas nebulae and star clusters. It is most likely that this irregular galaxy has been disrupted through repeated interactions with the Milky Way, resulting in the vigorous star-forming activity seen throughout the cloud. NGC 265 and NGC 290 may very well owe their existence to these close encounters with the Milky Way.

The images were taken in October and November 2004 through F435W, F555W, and F814W filters (shown in blue, green, and red, respectively).

Original Source: HubbleSite News Release

The Strange Nebula Around Eta Carinae

One of the five PHOENIX spectrograph of Eta Carinae. Image credit: Gemini Observatory/AURA. Click to enlarge
Eta Carinae is an unusual variable star just 8,000 light years away from Earth. It’s about 100 times more massive than our Sun – one of the most massive known – and it shines about 5 million times brighter than the Sun. It’s surrounded by an unusual cloud of material known as the Homunculus Nebula, which astronomers believe was created by successive explosions on the star’s surface. The Gemini Observatory has revealed a shockwave of expanding material moving through space at 500 km/second (310 miles/s).

Although the Homunculus Nebula around the massive star Eta Carinae has been the subject of intense study for many years, it has always been reluctant to divulge its innermost secrets. However, an important chapter in the recent evolution of this unique star was revealed when Nathan Smith (University of Colorado) used the high-resolution infrared spectrograph PHOENIX on the Gemini South telescope to observe the bipolar nebula surrounding Eta Carinae.

Multi-slit spectroscopy allowed Smith to reconstruct both the geometry and the velocity structure of the expanding gas in the nebula based on the behavior of the molecular line of hydrogen H2 at 2.1218 microns and the atomic line of ionized iron [Fe II] at 1.6435 microns.

Analysis of the PHOENIX spectrum shows a very well-defined shell structure expanding ballistically at about 500 kilometers per second. A “thick,” warm inner dust shell traced by [Fe II] emission is surrounded by a cooler and denser outer shell that is traced by strong H2 emission. Even though the outer H2 skin is remarkably thin and uniform it contains about 11 solar masses of gas and dust ejected over a period of less than five years. The Gemini spectra show that the density in the outer shell may reach 107 particles per cm3.

The spatio-kinematic structure of H2 emission at the pinched waist of the nebula helps explain the unusual and complex structures seen in other high-resolution images. The current shape of the Homunculus nebula is of two well-defined polar lobes outlined by an outer massive shell of gas and dust. Smith states that these Gemini/PHOENIX data indicate that most of the mass lost during the Great Eruption of the mid-nineteenth century was limited to the high latitudes of the star, with almost all of the mechanical energy escaping between 45 degrees and the pole.

“The mass distribution in the nebula indicates that its shape is a direct result of an aspherical explosion from the star itself, instead of being pinched at the waist by the surrounding circumstellar material,” said Smith.

For more details read “The Structure of the Homunculus: I. Shape and Latitutude Dependence from H2 and [Fe II] velocity Maps of Eta Carinae,” by Nathan Smith, The Astrophysical Journal, in press or at astro-ph/0602464.

Original Source: Gemini Observatory

Star Explodes Inside Another Star

Artist’s impression of the explosion of RS Ophiuchi. Image credit: David A. Hardy. Click to enlarge
Astronomers recently noticed that the normally dim star RS Ophiuchi had brightened enough to be visible without a telescope. This white dwarf star has brightened like this 5 times in the last 100 years, and astronomers believe it’s about to collapse into a neutron star. RS Ophiuchi is in a binary system with a much larger red giant star. The two stars are so close that the white dwarf is actually inside the envelope of the red giant, and explodes from within it every 20 years or so.

On 12 February 2006, amateur astronomers reported that a faint star in the constellation of Ophiuchus had suddenly become clearly visible in the night sky without the aid of a telescope. Records show that this so-called recurrent nova, RS Ophiuchi (RS Oph), has previously reached this level of brightness five times in the last 108 years, most recently in 1985. The latest explosion has been observed in unprecedented detail by an armada of space- and ground-based telescopes.

Speaking today (Friday) at the RAS National Astronomy Meeting at Leicester, Professor Mike Bode of Liverpool John Moores University and Dr Tim O’Brien of Jodrell Bank Observatory will present the latest results which are shedding new light on what happens when stars explode.

RS Oph is just over 5,000 light years away from Earth. It consists of a white dwarf star (the super-dense core of a star, about the size of the Earth, that has reached the end of its main hydrogen-burning phase of evolution and shed its outer layers) in close orbit with a much larger red giant star.

The two stars are so close together that hydrogen-rich gas from the outer layers of the red giant is continuously pulled onto the dwarf by its high gravity. After around 20 years, enough gas has been accreted that a runaway thermonuclear explosion occurs on the white dwarf’s surface. In less than a day, its energy output increases to over 100,000 times that of the Sun, and the accreted gas (several times the mass of the Earth) is ejected into space at speeds of several thousand km per second.

Five explosions such as this per century can only be explained if the white dwarf is near the maximum mass it could have without collapsing to become an even denser neutron star.

What is also very unusual in RS Oph is that the red giant is losing enormous amounts of gas in a wind that envelops the whole system. As a result, the explosion on the white dwarf occurs “inside” its companion’s extended atmosphere and the ejected gas then slams into it at very high speed.

Within hours of notification of the latest outburst of RS Oph being relayed to the international astronomical community, telescopes both on the ground and in space swung into action. Among these is NASA’s Swift satellite which, as its name suggests, can be used to react rapidly to things that change in the sky. Included in its armoury of instruments is an X-ray Telescope (XRT), designed and built by the University of Leicester.

“We realised from the few X-ray measurements taken late in the 1985 outburst that this was an important part of the spectrum in which to observe RS Oph as soon as possible,” said Professor Mike Bode of Liverpool John Moores University, who led the observing campaign for the 1985 outburst and now heads the Swift follow-up team on the current explosion.

“The expectation was that shocks would be set up both in the ejected material and in the red giant’s wind, with temperatures initially of up to around 100 million degrees Celsius – nearly 10 times that in the core of the Sun. We have not been disappointed!”

The first observations by Swift, only three days after the outburst began, revealed a very bright X-ray source. Over the initial few weeks, it became even brighter and then began to fade, with the spectrum suggesting that the gas was cooling down, although still at a temperature of tens of millions of degrees. This was exactly what was expected as the shock pushed into the red giant’s wind and slowed down. Then something remarkable and unexpected happened to the X-ray emission.

“About a month after the outburst, the X-ray brightness of RS Oph increased very dramatically,” explained Dr. Julian Osborne of the University of Leicester. “This was presumably because the hot white dwarf, which is still burning nuclear fuel, then became visible through the red giant’s wind.

“This new X-ray flux was extremely variable, and we were able to see pulsations which repeat every 35 seconds or so. Although it is very early days, and data are still being taken, one possibility for the variability is that this is due to instability in the nuclear burning rate on the white dwarf.”

Meanwhile, observatories working at other wavelengths changed their programmes to observe the event. Dr. Tim O’Brien of Jodrell Bank Observatory, who did his PhD thesis work on the 1985 explosion, and Dr. Stewart Eyres of the University of Central Lancashire, lead the team that is securing the most detailed radio observations to date of such an event.

“In 1985, we were not able to begin observing RS Oph until nearly three weeks after the outburst, and then with facilities that were far less capable than those available to us today,” said Dr. O’Brien.

“Both the radio and X-ray observations from the last outburst gave us tantalising glimpses of what was happening as the outburst evolved. In addition, this time, we have developed very much more advanced computer models. The combination of the two now will undoubtedly lead to a greater understanding of the circumstances and consequences of the explosion.

“In 2006, our first observations with the UK’s MERLIN system were made only four days after the outburst and showed the radio emission to be much brighter than expected,” added Dr. Eyres. “Since then it has brightened, faded, then brightened again. With radio telescopes in Europe, North America and Asia now monitoring the event very closely, this is our best chance yet of understanding what is truly going on.”

Optical observations are also being obtained by many observatories around the globe, including the robotic Liverpool Telescope on La Palma. Observations are also being conducted at the longer wavelengths of the infrared part of the spectrum.

“For the first time we are able to see the effects of the explosion and its aftermath at infrared wavelengths from space, with NASA’s Spitzer Space Telescope,” said Professor Nye Evans of Keele University, who heads the infrared follow-up team.

“Meanwhile, the observations we have already obtained from the ground, from the United Kingdom Infrared Telescope on the summit of Mauna Kea in Hawaii, already far surpass the data we had during the 1985 eruption.

“The shocked red giant wind and the material ejected in the explosion give rise to emission not only at X-ray, optical and radio wavelengths, but also in the infrared, via coronal lines (so-called because they are prominent in the Sun’s very hot corona). These will be crucial in determining the abundances of the elements in the material ejected in the explosion and in confirming the temperature of the hot gas.”

26 February 2006 was a highlight of the observational campaign. In what must surely be a unique event, four space satellites, plus radio observatories around the globe, observed RS Oph on the same day.

“This star could not have exploded at a better time for international ground and space based studies of an event which has been changing every time we look at it,” said Professor Sumner Starrfield of Arizona State University, who heads the U.S. side of the collaboration. “We are all very excited and exchanging many emails every day trying to understand what is happening on that day and then predict the behaviour on the next.”

What is apparent is that RS Oph is behaving like a “Type II” supernova remnant. Type II supernovae represent the catastrophic death of a star at least 8 times the mass of the Sun. They also eject very high velocity material which interacts with their surroundings. However, the full evolution of a supernova remnant takes tens of thousands of years. In RS Oph, this evolution is literally occurring before our eyes, around 100,000 times faster.

“In the 2006 outburst of RS Oph, we have a unique opportunity of understanding much more fully such things as runaway thermonuclear explosions and the end-points of the evolution of stars,” said Professor Bode.

“With the observational tools now at our disposal, our efforts 21 years ago look rather primitive by comparison.”

Original Source: RAS News Release

Pulsars Form Planets Too

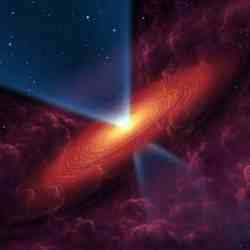
Artist illustration of a planetary disk forming around a pulsar. Image credit: NASA/JPL. Click to enlarge.
Think planets can only form around stars? Well, think again. NASA’s Spitzer Space Telescope has uncovered evidence for a potential planet-forming disk around a pulsar. In a former life, the pulsar would have been a large star 10-20 times bigger than the Sun that eventually consumed its fuel and exploded as a supernova. The remaining debris has started to collect again, and could eventually turn into new planets. This helps explain how planets were discovered around another pulsar in 1992, including one that’s Earth-sized.

NASA’s Spitzer Space Telescope has uncovered new evidence that planets might rise up out of a dead star’s ashes.

The infrared telescope surveyed the scene around a pulsar, the remnant of an exploded star, and found a surrounding disk made up of debris shot out during the star’s death throes. The dusty rubble in this disk might ultimately stick together to form planets.

This is the first time scientists have detected planet-building materials around a star that died in a fiery blast.

“We’re amazed that the planet-formation process seems to be so universal,” said Dr. Deepto Chakrabarty of the Massachusetts Institute of Technology in Cambridge, principal investigator of the new research. “Pulsars emit a tremendous amount of high energy radiation, yet within this harsh environment we have a disk that looks a lot like those around young stars where planets are formed.”

A paper on the Spitzer finding appears in the April 6 issue of Nature. Other authors of the paper are lead author Zhongxiang Wang and co-author David Kaplan, both of the Massachusetts Institute of Technology.

The finding also represents the missing piece in a puzzle that arose in 1992, when Dr. Aleksander Wolszczan of Pennsylvania State University found three planets circling a pulsar called PSR B1257+12. Those pulsar planets, two the size of Earth, were the first planets of any type ever discovered outside our solar system. Astronomers have since found indirect evidence the pulsar planets were born out of a dusty debris disk, but nobody had directly detected this kind of disk until now.

The pulsar observed by Spitzer, named 4U 0142+61, is 13,000 light-years away in the Cassiopeia constellation. It was once a large, bright star with a mass between 10 and 20 times that of our sun. The star probably survived for about 10 million years, until it collapsed under its own weight about 100,000 years ago and blasted apart in a supernova explosion.

Some of the debris, or “fallback,” from that explosion eventually settled into a disk orbiting the shrunken remains of the star, or pulsar. Spitzer was able to spot the warm glow of the dusty disk with its heat-seeking infrared eyes. The disk orbits at a distance of about 1 million miles and probably contains about 10 Earth-masses of material.

Pulsars are a class of supernova remnants, called neutron stars, which are incredibly dense. They have masses about 1.4 times that of the sun squeezed into bodies only 10 miles wide. One teaspoon of a neutron star would weigh about 2 billion tons. Pulsar 4U 0142+61 is an X-ray pulsar, meaning that it spins and pulses with X-ray radiation.

Any planets around the stars that gave rise to pulsars would have been incinerated when the stars blew up. The pulsar disk discovered by Spitzer might represent the first step in the formation of a new, more exotic type of planetary system, similar to the one found by Wolszczan in 1992.

“I find it very exciting to see direct evidence that the debris around a pulsar is capable of forming itself into a disk. This might be the beginning of a second generation of planets,” Wolszczan said.

Pulsar planets would be bathed in intense radiation and would be quite different from those in our solar system. “These planets must be among the least hospitable places in the galaxy for the formation of life,” said Dr. Charles Beichman, an astronomer at NASA’s Jet Propulsion Laboratory and the California Institute of Technology, both in Pasadena, Calif.

The Jet Propulsion Laboratory manages the Spitzer Space Telescope mission for NASA’s Science Mission Directorate, Washington. Science operations are conducted at the Spitzer Science Center at Caltech. JPL is a division of Caltech. Spitzer’s infrared array camera, which made the pulsar observations, was built by NASA’s Goddard Space Flight Center, Greenbelt, Md. The instrument’s principal investigator is Dr. Giovanni Fazio of the Harvard-Smithsonian Center for Astrophysics.

For more information about Spitzer, visit:

http://www.spitzer.caltech.edu/spitzer/

Original Source: NASA/JPL News Release

A Super Mercury was Smashed up 4.5 Billion Years Ago

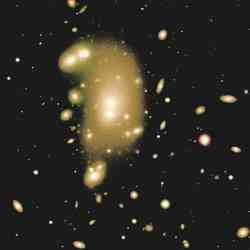
Evolution of the impact three hours from the time of collision. Image credit: Horner et Al. Click to enlarge
According to current models of planetary formation, Mercury has too much mass. A new explanation proposes that Mercury was created from a much larger parent planet that collided with a giant asteroid 4.5 billion years ago. Astronomers from the University of Bern ran various scenarios modeling early versions of Mercury. This scenario of an early cataclysm best matched the current mass and composition of Mercury. Some of the ejected material would have made it all the way to Venus and even to the Earth.

A New computer simulations of Mercury’s formation show the fate of material blasted out into space when a large proto-planet collided with a giant asteroid 4.5 billion years ago. The simulations, which track the material over several million years, shed light on why Mercury is denser than expected and show that some of the ejected material would have found its way to the Earth and Venus.

“Mercury is an unusually dense planet, which suggests that it contains far more metal than would be expected for a planet of its size. We think that Mercury was created from a larger parent body that was involved in a catastrophic collision, but until these simulations we were not sure why so little of the planet’s outer layers were reaccreted following the impact,” said Dr Jonti Horner, who is presenting results at the Royal Astronomical Society’s National Astronomy Meeting on 5th April.

To solve this problem, Dr Horner and his colleagues from the University of Bern ran two sets of large-scale computer simulations. The first examined the behaviour of the material in both the proto-planet and the incoming projectile; these simulations were among the most detailed to date, following a huge number of particles and realistically modelling the behaviour of different materials inside the two bodies. At the end of the first simulations, a dense Mercury-like body remained along with a large swathe of rapidly escaping debris. The trajectories of the ejected particles were then fed in to a second set of simulations that followed the motion of the debris for several million years. Ejected particles were tracked until either they landed on a planet, were thrown into interstellar space, or fell into the Sun. The results allowed the group to work out how much material would have fallen back onto Mercury and investigate other ways in which debris is cleared up in the Solar System.

The group found that the fate of the debris depended on whereabouts Mercury was hit, both in terms of its orbital position and in terms of the angle of the collision.

Whilst purely gravitational theory suggested that a large fraction of the debris would eventually fall back onto Mercury, the simulations showed that it would take up to 4 million years for 50% of the particles to land back on the planet and in this time many would be carried away by solar radiation. This explains why Mercury retained a much smaller proportion than expected of the material in its outer layers.

The simulations also showed that some of the ejected material made its way to Venus and the Earth. While this is only a small fraction, it illustrates that material can be transferred between the inner planets relatively easily. Given the amount of material that would have been ejected in such a catastrophe, it is likely that there is a reasonable amount (possibly as much as 16 million billion tonnes [1.65×10^19 kg]) of proto-Mercury in the Earth.

Original Source: RAS News Release

Deep Space Alcohol

The cloud, where OH maser filament are red and extended methanol filaments are green. Image credit: JIVE Click to enlarge
Astronomers have located a gigantic cloud of methyl alcohol surrounding a stellar nursery. The cloud measures half a trillion km across (300 billion miles), and could help astronomers understand how some of the most massive stars in the Universe are formed. It’s methanol, not ethanol, so you wouldn’t want to drink it if you could reach it.

Astronomers based at Jodrell Bank Observatory have discovered a giant bridge of methyl alcohol, spanning approximately 288 billion miles, wrapped around a stellar nursery. The gas cloud could help our understanding of how the most massive stars in our galaxy are formed.

The new observations were taken with the UK’s MERLIN radio telescopes, which have recently been upgraded. The team studied an area called W3(OH), a region in our galaxy where stars are being formed by the gravitational collapse of a cloud of gas and dust. The observations have revealed giant filaments of gas that are emitting as ‘masers’ (molecules in the gas are amplifying and emitting beams of microwave radiation in much the same way as a laser emits beams of light).

The filaments of masing gas form giant bridges between maser ‘spots’ in W3(OH) that had been observed previously. The largest of these maser filaments is 288 billion miles (463 billion km) long. Observations show that the entire gas cloud appears to be rotating as a disc around a central star, in a similar manner to the accretion discs in which planets form around young stars. The maser filaments occur at shock boundaries where large regions of gas are colliding.

“Our discovery is very interesting because it challenges some long-accepted views held in astronomical maser research. Until we found these filaments, we thought of masers as point-like objects or very small bright hotspots surrounded by halos of fainter emission,” said Dr Lisa Harvey-Smith, who is the Principal Investigator for the study and is presenting results at the Royal Astronomical Society’s National Astronomy Meeting on 4th April.

Since the upgrade of the UK’s MERLIN telescope network, astronomers have been able to image methanol masers with a much higher sensitivity and, for the first time, get a complete picture of all the radiation surrounding maser sources. In the new study, the Jodrell Bank team looked at the motion of the W3(OH) star forming region in 3-dimensions and also measured physical properties of the gas such as temperature, pressure and the strength and direction of the magnetic fields. This information is vital when testing theories about how stars are born from the primordial gas in stellar nurseries.

Dr Harvey-Smith said, “There are still many unanswered questions about the birth of massive stars because the formation centres are shrouded by dust. The only radiation that can escape is at radio wavelengths and the upgraded MERLIN network is now giving us the first opportunity to look deep into these star forming regions and see what’s really going on.”

The many different types of interactions between molecules in star forming regions lead to emissions in many different wavelengths. Future observations of masers at other frequencies are planned to complete the complex jigsaw puzzle that has now been revealed.

Dr Harvey-Smith adds, “Although it is exciting to discover a cloud of alcohol almost 300 billion miles across, unfortunately methanol, unlike its chemical cousin ethanol, is not suitable for human consumption!”

Original Source: RAS News Release

Galaxies Trapped in the Universe’s Web

Galaxies are not randomly distributed. Image credit: IAC Click to enlarge
Although the galaxies we see in the night sky seem randomly strewn across the heavens, they’re actually organized into large scale structures that look like cosmic filaments. These filaments and walls surround huge bubble-like voids that lack any large structures at all. European astronomers measured the orientation of thousands of galaxies, and found that many are oriented in the direction of these linear filaments.

Astronomers from the University of Nottingham, UK, and the Instituto de Astrofisica de Canarias (Spain), have found the first observational evidence that galaxies are not randomly oriented.

Instead, they are aligned following a characteristic pattern dictated by the large-scale structure of the invisible dark matter that surrounds them.

This discovery confirms one of the fundamental aspects of galaxy formation theory and implies a direct link between the global properties of the Universe and the individual properties of galaxies.

Galaxy formation theories predicted such an effect, but its empirical verification has remained elusive until now. The results of this work were published the 1 April issue of Astrophysical Journal Letters.

Nowadays, matter is not distributed uniformly throughout space but is instead arranged in an intricate “cosmic web” of filaments and walls surrounding bubble-like voids. Regions with high galaxy concentrations are known as galaxy clusters whereas low density regions are termed voids.

This inhomogeneous distribution of matter is called the “Large-scale distribution of the Universe.” When the Universe is considered as whole, this distribution has a similar appearance to a spider’s web or the neural network of the brain. But it was not always like this.

After the Big Bang, when the Universe was much younger, matter was distributed homogeneously. As the Universe was evolving, gravitational pulls began to compress the matter in certain regions of space, forming the large-scale structure that we currently observe.

According to these models and theories a direct consequence of this process is that galaxies should be preferentially oriented perpendicularly to the direction of the linear filaments.

Several observational studies have looked for a preferential spatial orientation (or alignment) of galaxy rotation axes with respect to their surrounding large-scale structures. However, none of them have been successful, due to the difficulties associated with trying to characterise the filaments.

The research conducted by the astrophysical group formed by Ignacio Trujillo (University of Nottingham, UK), Conrado Carretero and Santiago G. Patiri, (both from the Instituto de Astrofisica de Canarias, Spain) has been able to measure this effect, confirming theoretical predictions.

To achieve this goal, they used a new technique based on the analysis of the huge voids that are found in the large-scale structure of the Universe. These voids have been detected by searching for large regions of space depleted of bright galaxies.

In addition, they took advantage of information provided by the two largest sky surveys yet undertaken: the Sloan Digital Sky Survey and the Two Degree Field Survey. These surveys contain positional information for more than half a million galaxies located within a distance of one billion light-years of the Earth.

Other parameters provided by the surveys, such as the position angle and the ellipticity of the objects, were used to estimate the orientation of the disk galaxies.

“We found that there is an excess of disk galaxies that are highly inclined relative to the plane defined by the large-scale structure surrounding them,” explained Dr. Trujillo. “Their rotation axes are mainly oriented in the direction of the filaments.

“Our work provides important confirmation of the tidal torque theory which explains how galaxies have acquired their current spin,” said Trujillo.

“The spin of the galaxies is believed to be intrinsically linked to their morphological shapes. So, this work is a step forward on our understanding of how galaxies have reached their current shapes.”

Dr. Ignacio Trujillo has a research assistant position, funded by PPARC, in the School of Physics and Astronomy at the University of Nottingham.

An abstract of the paper is available on the web at:
http://xxx.lanl.gov/abs/astro-ph/0511680

Original Source: RAS News Release