Supernova Simulations Point to White Dwarf Mergers

Type Ia supernovae, some of the most violent and luminous explosions in the Universe, have become a handy tool for astronomers to measure the size and expansion of the Universe itself. Because they explode with a rather specific peak luminosity, they can be used as “standard candles” to measure distances. New research presented at the American Astronomical Society meeting this week points to the increased likelihood that the mergers of the stars that create these explosions, white dwarfs, is more likely than previously thought, and could explain the properties of some Type Ia supernovae that are curiously less luminous than expected.

Research presented by Rüdiger Pakmor et al. from the Max-Planck Institute for Astrophysics in Garching, Germany simulated the merger of two white dwarfs in a binary system, and showed that these simulations match previously observed supernovae with odd characteristics, specifically that of 1991bg. That supernova, and others observed since, was curiously less luminous than should have been expected if it were a Type Ia supernovae.

Type Ia supernovae occur when there are two stars orbiting each other in a binary system. In one scenario, one of the stars becomes a white dwarf, a small but very, very dense star, and steals matter from the other, pushing itself over the Chandrasekhar limit – 1.4 times the mass of the Sun – and undergoing a thermonuclear explosion.

Another cause for these types of supernovae could be the merger of both the stars in the system. In the scenario analyzed by these researchers, both stars were white dwarfs of masses just under that of the Sun: .83-0.9 solar masses.

The researchers showed that as the system loses energy due to the emission of gravitational waves, the two white dwarfs approach each other. As they merge, part of the material in one of the stars crashes into the other and heats up the carbon and oxygen, creating a thermonuclear explosion seen in Type Ia supernovae.

You can watch an animation of the simulated merger courtesy of the Max-Planck Institute’s Supernova Research Group right here.

Observations of supernovae like 1991bg show them to burn a smaller amount of nickel 56, about 0.1 solar masses, than regular Type Ia supernovae, which typically burn 0.4-0.9 solar masses of nickel. This makes them less luminous, because the radiative decay of the nickel is one of the phenomenon that gives the luminous display of Type Ia supernovae its punch.

“With our detailed explosion simulations, we could predict observables that indeed closely match actual observations of Type Ia supernovae,” said Friedrich Röpke, a co-author of the paper.

Their simulations show that when the two white dwarfs merge, the density of the system is less than in typical Type Ia supernovae, and thus less nickel is produced. The researchers note in their paper that these types of white dwarf mergers could comprise between 2-11 percent of the Type Ia supernovae observed.

Understanding the mechanisms that create these fantastic explosions is a necessary step in getting a handle on both the extent of our Universe and its expansion, as well as the diversity of Type Ia supernovae themselves.

If you would like to learn more about their research and the details of their computer modeling, the paper is available on Arxiv here. Their results will also be published in the January 7, 2010 edition of Nature.

Source: AAS press release, Arxiv paper

Messier 104


Object Name: Messier 104
Alternative Designations: M104, NGC 4594, The Sombrero Galaxy
Object Type: Type Sa Spiral Galaxy
Constellation: Virgo
Right Ascension: 12 : 40.0 (h:m)
Declination: -11 : 37 (deg:m)
Distance: 50000 (kly)
Visual Brightness: 8.0 (mag)
Apparent Dimension: 9×4 (arc min)


Locating Messier 104: M104 is easily found exactly 11 degrees – about a fistwidth – due west of Alpha Virginis (Spica). With excellent conditions from a dark sky site, it can be spotted in binoculars as a small, eye-shaped patch of nebulosity. With telescopes as small as 3″ in aperture, it takes on a galactic signature and reveals its dark dustlane beginning at about 4.5″ in aperture. The more light gathering ability, the more the beautiful Sombrero Galaxy reveals! As always, galaxies prefer dark sky sites and good seeing conditions.

What You Are Looking At: The Sombrero, also known as M104, is one of the largest galaxies in the nearby Virgo cluster, about 28 million light years from Earth. This Great Observatories view of the famous Sombrero galaxy was made using NASA’s Chandra X-ray Observatory, Hubble Space Telescope and Spitzer Space Telescope. The main figure shows the combined image from the three telescopes, while the three inset images show the separate observatory views. The Chandra X-ray image (in blue) shows hot gas in the galaxy and point sources that are a mixture of objects within the Sombrero as well as quasars in the background. The Chandra observations show that diffuse X-ray emission extends over 60,000 light years from the center of the Sombrero. (The galaxy itself spans 50,000 light years across.) Scientists think this extended X-ray glow may be the result of a wind from the galaxy, primarily being driven by supernovas that have exploded within its bulge and disk. The Hubble optical image (green) shows a bulge of starlight partially blocked by a rim of dust, as this spiral galaxy is being observed edge on. That same rim of dust appears bright in Spitzer’s infrared image, which also reveals that Sombrero’s central bulge of stars.

Like “Diamonds on the Hat”, globular clusters are all parcel and part of M104’s makeup. “Images from the Hubble Space Telescope Advanced Camera for surveys are used to carry out a new photometric study of the globular clusters (GCs) in M104, the Sombrero galaxy. The primary focus of our study is the characteristic distribution function of linear sizes [size distribution function (SDF)] of the GCs. We measure the effective radii for 652 clusters with point spread function-convolved King and Wilson dynamical model fits. The SDF is remarkably similar to those measured for other large galaxies of all types, adding strong support to the view that it is a ‘universal’ feature of GC systems. We use the Sombrero and Milky Way data and the formation models of Baumgardt & Kroupa (2007) to develop a more general interpretation of the SDF for GCs. We propose that the shape of the SDF that we see today for GCs is strongly influenced by the early rapid mass loss during their star-forming stage, coupled with stochastic differences from cluster to cluster in the star formation efficiency (SFE) and their initial sizes. We find that the observed SDF shape can be accurately predicted by a simple model in which the protocluster clouds had characteristic sizes of 0.9 ± 0.1 pc and SFEs of 0.3 ± 0.07 .” says Wlliam E. Harris (et al).

“The colours and luminosities of the M104 clusters show the clearly defined classic bimodal form. The blue sequence exhibits a mass/metallicity relation, following a scaling of heavy-element abundance with luminosity of Z?L0.3 very similar to what has been found in most giant elliptical galaxies. A quantitative self-enrichment model provides a good first-order match to the data for the same initial SFE and protocluster size that were required to explain the SDF. We also discuss various forms of the GC Fundamental Plane of structural parameters and show that useful tests of it can be extended to galaxies beyond the Local Group. The M104 clusters strongly resemble those of the Milky Way and other nearby systems in terms of such test quantities as integrated surface density and binding energy.”

But, just like our own galaxy, globular clusters aren’t all that’s hiding inside that awesome halo. “We used the CTIO 4m telescope to make a complete and kinematically unbiased survey of M104 (NGC 4594; the Sombrero galaxy) for planetary nebulae (i.e., stars) out to 16 kpc. We present the positions and monochromatic [O III] lambda 5007 magnitudes of 294 planetaries, and use the observed planetary nebula luminosity function (PNLF) to measure a distance of 8.9+/-0.6Mpc to the galaxy. The luminosity-specific PN number lambda 2.5 in the halo of M104 is approximately 21.7×10^-9^L_{sun}_, which for its color (B-V)=0.95, is comparable to the values in other galaxies.” says H.C. Ford (et al).

“We use the PNLF distance to M104 to compare its luminosity to the luminosities of the brightest galaxies in the Virgo Cluster, finding that if M104 were in the Virgo Cluster, it would be the third brightest galaxy. We combined the PNLF distance and the observed velocity corrected for Virgo infall to calculate a Hubble constant H_0_=91+/-8km/s/Mpc. We also used the PNLF distances to the NGC 1023 group, the Leo group, the Virgo Cluster, and the Fornax Cluster to derive Hubble constants corrected for Virgo infall. The values of H_0_ for M104, the NGC 1023 group, the Virgo Cluster, and the Fornax Cluster are in excellent agreement, suggesting that the PNLF distances and Schechter’s linear infall model provide a self-consistent representation of the Hubble expansion and Virgo infall within most regions of the local supercluster.”

History: Messier 104 was not included in Messier’s originally published catalog. However, Charles Messier added it by hand to his personal copy on May 11, 1781, and described it as a “very faint nebula.” It was Camille Flammarion who found that its position coincided with Herschel’s H I.43, which is the Sombrero Galaxy (NGC 4594), and added it to the official Messier list in 1921. This object is also mentioned by Pierre Mechain as his discovery: “On May 11, 1781, I discovered a nebula above the Raven [Corvus] which did not appear to me to contain any single star. It is of a faint light and difficult to find if the micrometer wires are illuminated. I have compared it [its position] on this day and the following with Spica in the Virgin and from this derived its right ascension 187d 9′ 42″ and its southern declination 10d 24′ 49″ [the same position as in Messier’s handwritten note]. It does not appear in the Connoissance des Temps.”

William Herschel found this object independently on May 9, 1784, but it would be his son John who would first notice there was something a bit different about it: “There is a faint diffused oval light all about it, and I am almost positive that there is a dark interval or stratum separating the nucleus and general mass of the nebula from the light above (s of) it. Surely no illusion. There is a faint diffused oval light all about it, and I am almost positive that there is a dark interval or stratum separating the nucleus and general mass of the nebula from the light above (south of) it.”

Enjoy your observations of this great galaxy!

Top M104 image credit, Palomar Observatory courtesy of Caltech, M104 Composite – Spitzer, Chandra and Hubble, M104 Hubble Remix, M104 Hubble Details, M104 Spitzer Image and M104 image courtesy of Todd Boroson/NOAO/AURA/NSF.

Messier 103


Object Name: Messier 103
Alternative Designations: M103, NGC 581
Object Type: Type D Open Cluster
Constellation: Cassiopeia
Right Ascension: 01 : 33.2 (h:m)
Declination: +60 : 42 (deg:m)
Distance: 8.5 (kly)
Visual Brightness: 7.4 (mag)
Apparent Dimension: 6.0 (arc min)


Locating Messier 103: Locating M103 is fairly easy even under moderately light polluted conditions. Simply identify Delta Cassiopeiae (Ruchbah), a bright, blue-white star that marks one of the lower positions of Cassiopeia’s class “W” asterism. Simply center it in the finderscope and look about 1/2 a degree north and 1 degree east in the direction of Epsilon. In binoculars and a finderscope it will appear as a diamond shape patch of nebulosity which tries to resolve and will reveal its individual stars to even a small telescope. Loosely constructed, M103 makes a wonderful target for urban skies and less than perfect sky conditions.

What You Are Looking At: Located some 8,500 light years away and spanning over an area about 15 light years wide, this 25 million year old star cluster can sometimes be a little hard to pick out of the surrounding star field because of its wide open profile. Notable non-member binary Struve 131 dominates the scene, and only through radial velocity studies has genuine cluster members been identified. “The cluster has been assigned a class III2p by Ruprecht {1966). Oja (1966) determined the membership of the stars for the cluster on the basis of a proper motion study and reported 73 stars to be its possible members. Out of these, UBV photoelectric magnitudes and colors are presently known for only twenty stars.” says Ram Saga arid U.C. Joshi.

But look for M103’s prominent red giant! Is there a special reason? Yes. “A statistical research on evolved stars beyond hydrogen exhaustion is performed by comparing the H-R diagrams of about 60 open clusters with a set of isochronous curves without mass loss derived from Iben’s evolutionary tracks and time scales for Population I stars.” says G. Barbaro (et al). “Although evidence concerning mass loss from stars of different types and especially red giants and supergiants is gradually increasing, still not much is known about the real causes and the quantitative aspects of this phenomena, so that up to know little can be foretold concerning its bearing on stellar evolution.”

History: This sparkling open cluster was discovered by Pierre Mechain in either March or April of 1781and added by Charles Messier to his catalog before he had a chance to observe it. From Mechain’s notes: “Cluster of stars between Epsilon and Delta of the leg of Cassiopeia.”

Sir William Herschel would capture it again on August 8, 1783 when he describes: “14 or 16 pL. [pretty large (bright)] stars with a great many eS. [extremely small (faint)] ones. Two of the large [bright] ones are double, one of the 1st the other of the 2nd class. (*) The compound eye glass shews a few more that may be taken into the cluster so as to make them about 20. I exclude a good many straggling ones, otherwise there would be no knowing where to stop.”

But observing M103, didn’t stop and it would be Admiral Smyth who would be the first to see red. “”A neat double star in a cluster, on Cassiopeia’s knee, about a degree to nf of Delta. A 7 [th mag], straw coloured; B 9, dusky blue. This is a fan-shaped group, diverging from a sharp star in the nf quadrant. The cluster is brilliant from the splash of a score of its largest members, the four principle ones of which are from the 7th to the 9th magnitude; and under the largest, in the sf, is a red star of the 8th magnitude, which must be that mentioned by JH [John Herschel], No. 126 of his Catalogue of 1833. My attention was first drawn to this object, by seeing it among Srtuve’s acervi (double stars); but soon found that it was also the 103 which Messier describes so vaguely, as being between Delta and Epsilon Cassiopeiae, whereas it is pretty close to Delta, on the Lady’s knee.”

Look for the colors and enjoy your observations!

Top M103 image credit, Palomar Observatory courtesy of Caltech, M103 – Roberto Mura – Wikipedia Image, M103 2MASS image and M103 image courtesy of NOAO/AURA/NSF.

Shuttle Endeavour Rolled to Pad; Countdown to the Final Five Begins

Rollout of Endeavour atop mobile launch platform. Credit: Ken Kremer

[/caption]
Space Shuttle Endeavour was rolled out to its seaside launch pad today (Jan. 6) at the Kennedy Space Center, officially starting the clock for the ‘Final Five’ flights. These five will close out the Space Shuttle era forever by the end of 2010 or early 2011 unless the program is extended for a few missions by President Obama.

I was totally thrilled to witness the trek first hand from just yards away as central Florida was gripped by a rare and truly ‘bone chilling’ cold snap. Endeavour was bolted atop the mobile launch platform (MLP) and hauled out to the pad at about 0.5 MPH by the giant crawler-transporter which dates back to the Apollo moon landing Era of the 1960’s.

The frigid 3.4 mile journey from the cavernous Vehicle Assembly Building (VAB) along the crawlerway to launch pad 39 A began in darkness in the overnight hours, with ‘first motion’ at 4:13 AM. The massive 17 million pound stack was declared ‘hard down” and secured at the pad at 10:37 AM.

Endeavour at Dawn. Credit: Ken Kremer

Along the way we observed a remarkable clump of icicles (see photo) that formed in the below freezing temperatures. So it felt more like sunny Antarctica then sunny Florida. And all us media and NASA technicians were outfitted with several layers of winter attire more appropriate for the recent ‘bone chilling’ Soyuz launch in Kazakhstan on Dec 20.

Endeavour is scheduled to liftoff on February 7, for what is currently planned to be the final night launch and is targeted for 4:39 AM. The goal of the 13 day STS 130 space station assembly mission is to deliver the last of three interconnecting nodes, dubbed ‘Tranquility’, along with the seven windowed Cupola observation module. See my earlier story here. NASA spokesman Allard Beutel said that these payloads will be delivered to the pad on Jan 15 and then be installed inside Endeavour’s giant cargo bay for the trip to space.

‘Tranquility’ is the final major US element remaining for the International Space Station (ISS) and will be attached to the Unity connecting Node. The unique Cupola module will afford astronauts a spectacular 360 degree panoramic view of the Earth, the station and the cosmos.

“Things are going really well for our launch on February 7th, according to Dana Hutcherson, the Endeavour flow director. We spoke as Endeavour was climbing up the last few meters of the ramp behind us leading to the pad. “We’re not tracking any major issues and there are no concerns at this time. We have about 7 days of contingency time in the pad flow. So everything is looking really well”.

Endeavour’s crew of six plans to arrive at the Cape on Jan 19 for several days of final training, equipment familiarization and a launch dress rehearsal, known as the Terminal Countdown Demonstration Test, or TCDT, which will simulate countdown activities at Kennedy. NASA’s executive level shuttle management team will meet on Jan 27 to review all aspects of mission processing and preparations and will then set an official launch date.

Photo Album of Endeavour Rollout on 6 Jan 2010 by Ken Kremer

Rollout of Endeavour  atop mobile launch platform, side view. Credit: Ken Kremer
Caption: Rollout of Endeavour atop mobile launch platform, side view. Credit: Ken Kremer

Reflections along the crawlerway. Credit: Ken Kremer
Endeavour climbs up ramp to Pad 39 A. Credit: Ken Kremer
Icicles form on a ‘bone chilling’ Sunny Florida day. Credit: Ken Kremer
Ken Kremer at Pad 39 A

Messier 102


Object Name: Messier 102
Alternative Designations: M102, NGC 5866, The Spindle Galaxy
Object Type: Lenticular Galaxy
Constellation: Draco
Right Ascension: 15 : 06.5 (h:m)
Declination: +55 : 46 (deg:m)
Distance: 45000 (kly)
Visual Brightness: 9.9 (mag)
Apparent Dimension: 5.2×2.3 (arc min)


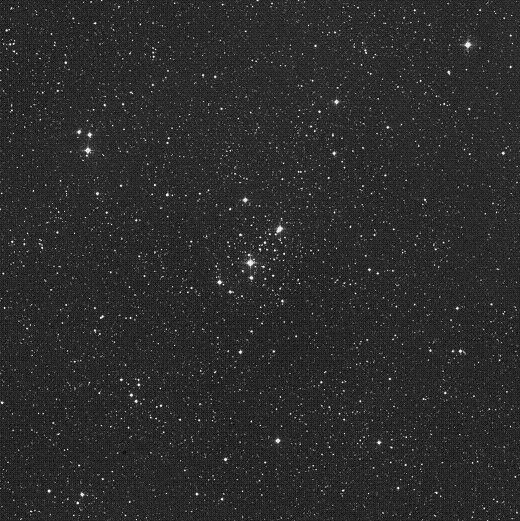
Locating Messier 102: Locating Messier 102 isn’t particularly easy and will require a good start chart and some work. It’s rough location is about 10 degrees east/northeast of Eta Ursa Major – or about 10 degrees south of Gamma Ursa Minor. It will require at least a 4″ telescope at a relatively dark sky to be seen brightly, and will begin to show both structure and its dark dustlane at apertures approaching 6-8″. For smaller scopes, it will appear as a thin streak of nebulosity. If you are at a very dark sky site, you can use Iota Draconis and shift about 3 deg southwest in the direction of Eta Ursae Majoris or use Theta Bootis where M102 is just to the south.

What You Are Looking At: Located some 45 million light-years and part of a galaxy grouping, M102 is a wonderful lenticular galaxy seen almost edge-on. And seeing is believing! From this beautiful Hubble image and the words of Bill Keel: “The dust lane is slightly warped compared to the disk of starlight. This warp indicates that NGC 5866 may have undergone a gravitational tidal disturbance in the distant past, by a close encounter with another galaxy. This is plausible because it is the largest member of a small cluster known as the NGC 5866 group of galaxies. The starlight disk in NGC 5866 extends well beyond the dust disk. This means that dust and gas still in the galaxy and potentially available to form stars does not stretch nearly as far out in the disk as it did when most of these stars in the disk were formed.”

“The Hubble image shows that NGC 5866 shares another property with the more gas-rich spiral galaxies. Numerous filaments that reach out perpendicular to the disk punctuate the edges of the dust lane. These are short-lived on an astronomical scale, since clouds of dust and gas will lose energy to collisions among themselves and collapse to a thin, flat disk. For spiral galaxies, the incidence of these fingers of dust correlates well with indicators of how many stars have been formed recently, as the input of energy from young massive stars moves gas and dust around to create these structures. The thinness of dust lanes in S0s has been discussed in ground-based galaxy atlases, but it took the resolution of Hubble to show that they can have their own smaller fingers and chimneys of dust.”

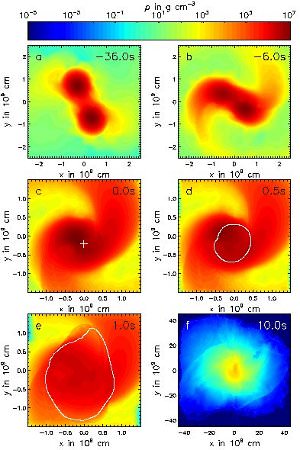
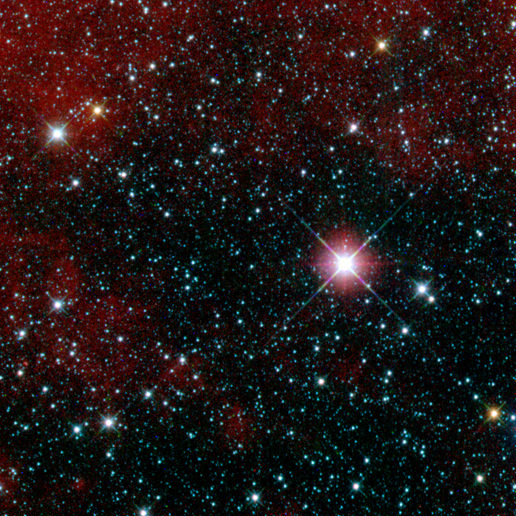
But what happens when the stars are done forming? Take a look in infrared… “S0 galaxies are often thought to be passively evolved from spirals after star formation is quenched. To explore what is actually occurring in such galaxies, we present a multi-wavelength case study of NGC 5866—a nearby edge-on S0 galaxy in a relatively isolated environment. This study shows strong evidence for dynamic activities in the interstellar medium, which are most likely driven by supernova explosions in the galactic disk and bulge.” says Jiang-Tao Li (et al).

“Understanding these activities can have strong implications for studying the evolution of such galaxies. We utilize Chandra, Hubble Space Telescope, and Spitzer data as well as ground-based observations to characterize the content, structure, and physical state of the medium and its interplay with the stellar component in NGC 5866. A cold gas disk is detected with an exponential scale height of ~102 pc. Numerous distinct off-disk dusty spurs are also clearly present: prominent ones can extend as far as ~3 × 10² pc from the galactic plane and are probably produced by individual SNe, whereas faint filaments can have ~kpc scale and are likely produced by SNe collectively in the disk/bulge.”

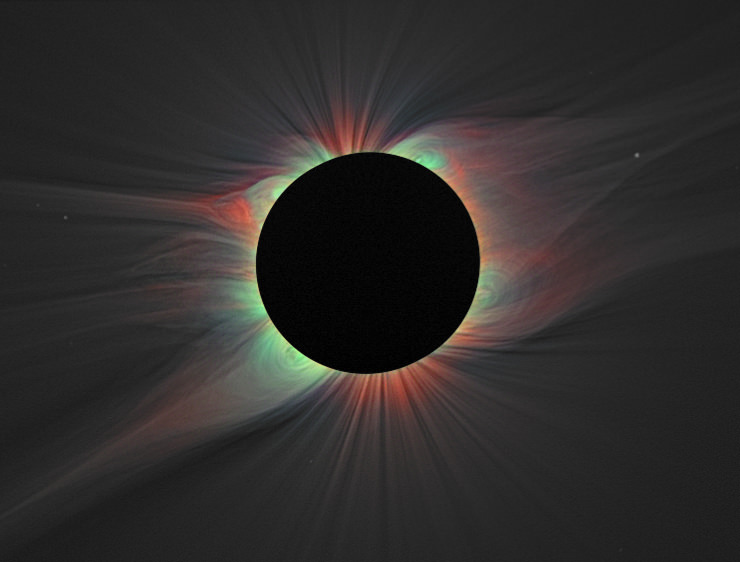
But what’s hot can also be very cool… and it the Spindle Galaxy’s case it the amount of interstellar medium. Says G.K. Kacprzak (New Mexico State University) and G.A. Welch (Saint Mary’s University): “The nearly edge-on S0 galaxy NGC 5866 is notable for its massive molecular interstellar medium, prominent central dust lane, and large IRAS 100 micron flux. The galaxy is relatively isolated, and neither the kinematics nor morphology of the gas suggests that a merger has taken place. Instead, NGC 5866 may be entering an era of star formation fueled with gas donated by its aging stellar population. Are we seeing a counter example of the popular view that galaxies evolve through mergers? We explore that possibility using multi-transition CO observations and SCUBA (Submillimetre Common-User Bolometer Array) imagery of NGC 5866. We analyze the dust and gas components of the interstellar medium using techniques such as the large velocity gradient (LVG) models and a three-dimensional Monte Carlo radiation transfer code. A comparison of SCUBA and appropriately convolved H alpha images reveals both to have similar structure and morphology. This complements the fact that the SCUBA fluxes were under predicted by the Monte Carlo code which does not take star formation into account. Both of those facts indicate that NGC 5866 is indeed under going star formation.”

History: NGC 5866 was probably first turned up by Pierre Mechain during March 1781 – or was observed by Charles Messier himself around that time. Despite Mechain’s disclaimer 2 years later, chances are good that NGC 5866 is object #102 rather than a reclassification of Messier 101. (Considering the personal problems Messier was having during that period, it’s small wonder that an error could have been made.) While Messier orginally added it to his published catalog without verifying its position, he did return later to verify this beautiful galaxy was almost exactly 5 degrees preceding (west) of the actual position previously published. In his 1781 personal notes, Messier writes: “Nebula between the stars Omicron [actually Theta] Bootis and Iota Draconis: it is very faint; near it is a star of the sixth magnitude. (Handwritten position added by Messier in his personal copy: 14h 40m, +56.).”

Even Pierre Mechain was vexed by the error and his letter to Bernoulli on May 6, 1783, he writes: “I will add only that No. 101 & 102 on the p. 267 of the Connoissance des tems [for] 1784 are nothing but the same nebula, which has been taken for two, by an error in the [sky] charts.” Later, Bode would find in his notes: “On page 267 of the “Connoissance des Temps for 1784″ M. Messier lists under No. 102 a nebula which I have discovered between Omicron [actually Theta] Bootis and Iota Draconis; this is a mistake. This nebula is the same as the preceding No. 101. Mr. Messier, caused by an error in the sky charts, has confused this one in the list of my nebulous stars communicated to him.” Although the positioning error occurred, the description was correct for NGC 5866.

It’s Messier designation will probably forever by the subject of debate, but even other notable astronomers called in errors on this one as well. Both Herschels observed it and even Admiral Smyth – who probably following an error by John Herschel in his 1833 catalog, confuses its number with H I.219 (which is NGC 3665, a galaxy in Ursa Major), and thus erroneously gives that object’s discovery date, March 1789: “A small but brightish nebula, on the belly of Draco, with four small stars spreading across the field, north of it. There may be a doubt as to whether this is the nebula discovered by Mechain in 1789, since Messier merely describes it as “very faint,” and situated between Omicron Bootis and Iota Draconis. But there must be some mistake here; the one being on the herdman’s leg, and the other in the coil of the Dragon far above the head of Bootes, having 22 deg of declination and 44′ [44 min] of time [in RA] between them, a space full of all descriptions of celestial objects. But as the Theta in the raised right hand of Bootes, if badly made, might be mistaken for an omicron, this is probably the object seen by Mechain, and JH’s 1910 [NGC 5879]; it being the brightest nebula of five in that vicinity [actually, the brightest is NGC 5866]. A line from Kappa in Draco’s tail, led to the south-east of Thuban, and prolonged as far again, strikes upon its site.”

Don’t you mistake the beautiful Spindle Galaxy for anything but a great observation!

Top M102 image credit, Palomar Observatory courtesy of Caltech, M102 Hubble Images, 2MASS M102 image, M102 data images by AANDA and M102 image courtesy of NOAO/AURA/NSF.

WISE “First Light” Image Released

WISE First Light image. Image credit: NASA/JPL-Caltech/UCLA

Caption: WISE First Light image. Image credit: NASA/JPL-Caltech/UCLA

“In many respects, the most important moment for a telescope is its first light,” said Bill Irace, project manager for the Wide-field Infrared Survey Explorer (WISE) spacecraft, speaking at the 215th American Astronomical Society meeting. “And we are happy to be able to share WISE’s first light image with you today.” The image covers a patch of sky about three times larger than the full moon. An interstellar dust cloud shows in the upper left, and the bright object in the right-center is V 482 Carina, an old puffy, cool giant star. The image was taken with what will be WISE’s standard 8.8 seconds of exposure time where it “stares” at a specific point in the sky. Ultimately, WISE will take millions of images to conduct an all sky survey in 10 months, before the frozen hydrogen that keeps the instrument cold evaporates away.

The exposure shows infrared light from three of WISE’s four wavelength bands: Blue, green and red correspond to 3.4, 4.6, and 12 microns, respectively. WISE will search for millions of hidden objects, including asteroids, “failed” stars, powerful galaxies and brown dwarf stars too cool to emit light, including a potential brown dwarf that might be closer to Earth than Proxima Centauri. WISE data will also serve as navigation charts for other missions.

Irace and David Leisawitz from Goddard Space Flight Center said in about a month, the science team will release the first images from the first survey to the public. “Longer term, the astronomical community around the world has been looking forward to this,” said Leisawitz, “as all of WISE’s data will be released for anyone to use starting in April 2011, with the final release in March 2012. The data products include an atlas of images and catalog of individual objects.”

Leisawitz said that magnificently and stunningly, WISE provides 400 times better angular resolution than the infrared instrument on the COBE spacecraft.

Irace divulged that this image was strictly an engineering image with no regard to the field of view. “We actually took about six images, but this one was the prettiest,” he said. “We did not point at a particular point in the sky, and in fact we didn’t know if we were going to be able to do it this fast, so this is basically a random image.”

The science team believes the spacecraft will still be operational for 3 additional months following the 10 month prime mission, and are writing a proposal to NASA for funding to continue.

For a larger version of the image, visit this NASA webpage.

Source: AAS press conference

Measuring the Coronal Temperature with Iron

This image of the solar corona contains a color overlay of the emission from highly ionized iron lines and white light taken of the 2008 eclipse. Red indicates iron line Fe XI 789.2 nm, blue represents iron line Fe XIII 1074.7 nm, and green shows iron line Fe XIV 530.3 nm. This is the first such map of the 2-D distribution of coronal electron temperature and ion charge state. Credit: Habbal, et al.

Astronomers presenting at this week’s AAS conference have reported on new research measuring the temperature of the solar corona. The work combines observations of the Sun’s outer reaches from observations during total solar eclipses in 2006, 2008, and 2009. It utilized mapping of various abundances of ionized iron to build a two dimensional temperature map.

Although many introductory science classes paint temperature as a fixed number, in reality, it’s the average of a range of temperatures which is a way of quantifying the kinetic energy of the particles in question. Individual particles may be hotter (higher kinetic energy) while others may be cooler (lower kinetic energy). As these atoms move around, they can collide and these collisions will knock off electrons causing the atoms to become ionized. The degree of ionization will be indicative of just how energetic the collision was.

Those ionized atoms can then be identified spectroscopically or by using a filter to search for the wavelength at which those atoms will emit light as new electrons settle down into the previously vacated orbitals. By measuring the relative amounts of ionization astronomers can then reconstruct the range of kinetic energies in the gas and thus, temperature range which can, in turn, be used to determine the average temperature.

This is the method an international team of astronomers used to study the sun’s corona. Since light atoms don’t work well for this method (they become fully ionized or just can’t show a large range of ionization like atoms with more electrons), the astronomers chose to study the Sun’s corona through various states of iron ionization. In doing so they mapped several ionization states, including capturing for the first time, the elusive Fe IX lines (iron with 8 electrons knocked off) at 789.2 nm.

One interesting finding was that the region of emission extended to three solar radii (or 1.5 times the diameter). After this distance, the collision rate drops off and can no longer cause the ionization of atoms (however, radiative processes caused by photons from the sun can still ionize the atoms, but this is no longer indicative of the temperature of the atoms). This was further than originally anticipated.

Another result of their work showed that there is a strong correspondence between the amounts of various ions coming from the sun and that same ratio in interplanetary space as measured by the SWICS on the Advanced Composition Explorer. This connection will better help astronomers understand the working of our Sun as well as how its emissions may impact the Earth.

The full results of this work are to be published in the January 10 issue of the Astrophysical Journal.

Space Station Pictures

Mir

Here are some space station pictures. We’ve already done photo galleries of the International Space Station, but let’s take a look at some different stations as well:

This is a picture of the Mir Space Station, launched by Russia. This photograph was taken by the crew of STS-89 on the space shuttle Endeavour.


Space Station

Here is a recent image of the International Space Station captured by the crew of STS-129. It shows how much of the construction has now been completed.


Skylab

This is a picture of Skylab, the United States’ first space station. It was in orbit from 1973 to 1979, and was visited by 3 crews of astronauts.


Stanford Torus

And maybe some day we’ll live in a futuristic space station like this. It’s called a Stanford Torus, and rotates to provide the people living inside an artificial gravity.


Bigelow station

This is an artist’s impression of a future space hotel developed by Bigelow Aerospace. The various modules are inflated and connected together. Test versions of the modules have already been sent into orbit.

We’ve written many articles about the International Space Station for Universe Today. Here’s an article about how you can track the International Space Station, and here’s an article about a how a radio operator was able to communicate with the station.

If you’d like more info on the station, check out NASA’s mission page for ISS. And here’s a link to NASA’s human spaceflight page for the station.

We’ve also recorded an episode of Astronomy Cast about the space shuttle. Listen here, Episode 127: The US Space Shuttle.

Spitzer Peers Into the Small Magellanic Cloud

Spitzer Image of the Small Magellanic Cloud

This week at the AAC Conference, astronomers released a new image of the Small Magellanic Cloud (SMC, a dwarf galaxy just outside our Milky Way) from Spitzer. The purpose of the image was to study “the life cycle of dust in this galaxy.” In this life cycle, clouds of gas and dust collapse to form new stars. As those stars die, they create new dust in their atmosphere which will enrich the galaxy and, when the stars give off that dust, will be made available future generations of stars. The rate at which this process occurs determines how fast the galaxy will evolve. This research has shown that the SMC is far less evolved than our on galaxy and only has 20% of the heavy elements that our own galaxy has. Such unevolved galaxies are reminiscent of the building blocks of larger galaxies.

As with most astronomical images, this new image is taken in different filters which correspond to different wavelengths of light. The red is 24 microns and traces mainly cool dust which is part of the reservoir from which new star formation can occur. Green represents the 8 micron wavelength and traces warmer dust in which new stars are forming. The blue is even warmer at 3.6 microns and shows older stars which have already cleared out their local region of gas and dust. By combining the amount of each of these, astronomers are able to determine the current rate at which evolution is taking place in order to understand how the evolution of the SMC is progressing.

The new research shows that the tail (lower right in this image) is tidal in nature as it’s being tugged on by gravitational interactions with the Milky Way. This tidal interaction has caused new star formation in the galaxy. Surprisingly, the team of researchers also indicated that their work may indicate that the Magellanic Clouds are not gravitational bound to the Milky Way and may just be passing.

More images can be found at the JPL website.