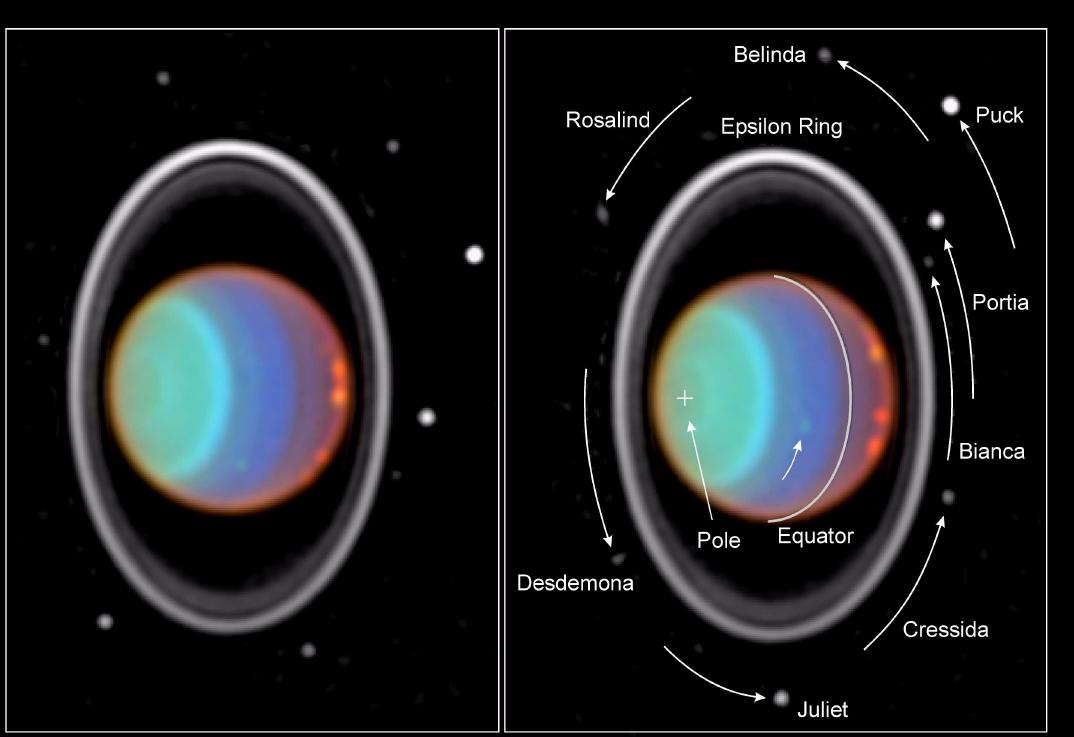
Uranus with its moons and rings. Image credit: Hubble
[/caption]
The Roche limit is named after French astronomy Edouard Roche, who published the first calculation of the theoretical limit, in 1848. The Roche limit is a distance, the minimum distance that a smaller object (e.g. a moon) can exist, as a body held together by its self-gravity, as it orbits a more massive body (e.g. its parent planet); closer in, and the smaller body is ripped to pieces by the tidal forces on it.
Remember how tidal forces come about? Gravity is an inverse-square-law force – twice as far away and the gravitational force is four times as weak, for example – so the gravitational force due to a planet, say, is greater on one of its moon’s near-side (the side facing the planet) than its far-side.
The fine details of whether an object can, in fact, hold up against the tidal force of its massive neighbor depend on more than just the self-gravity of the smaller body. For example, an ordinary star is much more easily ripped to piece by tidal forces – due to a supermassive black hole, say – than a ball of pure diamond (which is held together by the strength of the carbon-carbon bonds, in addition to its self-gravity).
The best known application of Roche’s theoretical work is on the formation of planetary rings: an asteroid or comet which strays within the Roche limit of a planet will disintegrate, and after a few orbits the debris will form a nice ring around the planet (of course, this is not the only way a planetary ring can form; small moons can create rings by being bombarded by micrometeorites, or by outgassing).
Roche also left us with two other terms widely used in astronomy and astrophysics, Roche lobe and Roche sphere; no surprise to learn that they too refer to gravity in systems of two bodies!
You should always put out the old dinner set when you have astronomers around. It all starts innocently enough with imagine this wineglass is the Earth rotating on its axis… But then someone decides that large plate is just right to show the orientation of an orbital plane and more wine glasses are brought to bear to test a solution to the three body problem and…
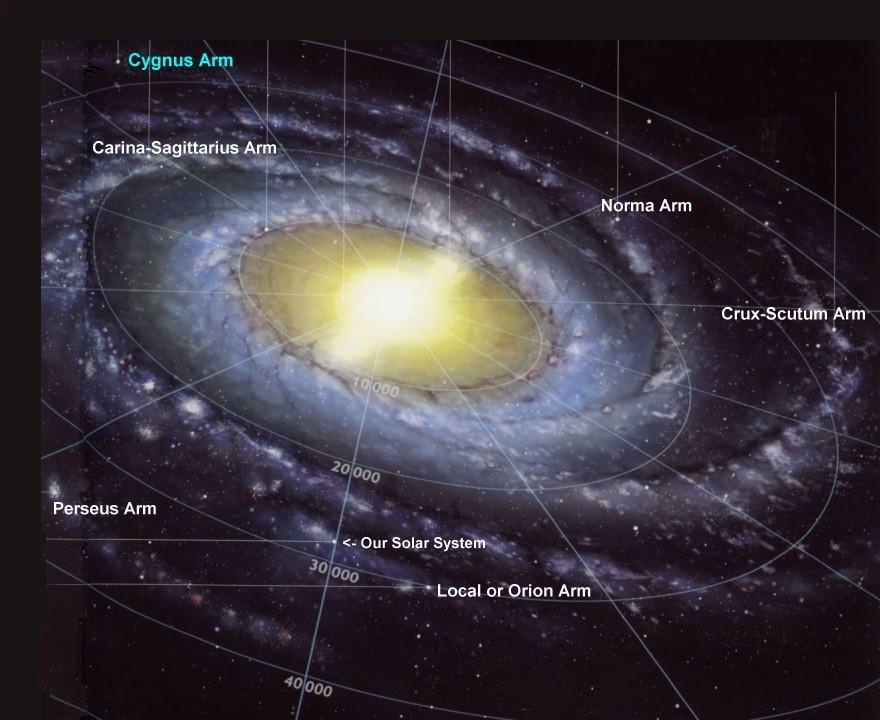
My favorite dinner set demonstration is to use the whole table to represent the galactic plane – ideally with an upturned wide rimmed soup bowl in the middle to mimic the galactic hub. Then you get a plate to represent the solar system’s orbital plane and hold it roughly facing the galactic hub, but at a 63 degree angle from the horizontal. We know the equatorial plane of the Milky Way is tilted 63 degrees from the ecliptic – or vice versa since here we are arbitrarily making the galactic plane (table) the horizontal. This means galactic north is up towards the ceiling – and incidentally a line drawn north up from the galaxy’s centre (i.e. the galactic axis) passes fairly close to Arcturus.
Now for the Earth. Wine glasses make an excellent Earth model since the stem can represent the Earth’s axis of rotation. The glass is at least a bit round and you can see through it for a view of what someone would see from the surface of that glass.
Looking down on the solar system (plate) from its north, which is orientated away from the galactic hub (table), it actually rotates anti-clockwise. So if you hold the glass at the top of the plate – that’s Earth at about September, then move it to the left for December, down to the bottom for March, right side for June and back to September.
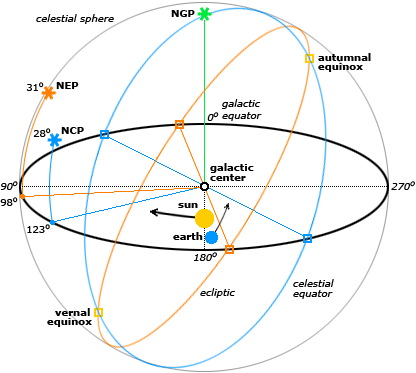
So, holding your plate at 63 degrees to the table, now hold the wine glass tilted at 23.5 degrees to the plate. Assuming you left your protractor at home – this will mean the wine glass stem is now almost parallel to the table – since 63 + 23.5 is close to 90 degrees. In other words, the Earth’s axis is almost perpendicular to the galactic axis.
The range of different orientations available to you. The axis of Earth's rotation (represented by the 'celestial equator') is almost perpendicular to the orbital plane of the galaxy.
You should really imagine the plate being embedded within the table, since you will always see some part of the Milky Way at night throughout the year. But, in any case, the wine glass gives a good demonstration of why we southerners get such a splendid view of the galactic hub in Sagittarius. It’s hidden in the daytime around March – but come September about 7pm you get the Milky Way running almost north-south across the sky with Sagittarius almost directly overhead. Arcturus is visible just above the western horizon, being about where the galaxy’s northern axis points (that is, the ceiling above the middle of the table).
And if you look to the north you can see Vega just above the horizon – which is more or less the direction the solar system (plate) is heading in its clockwise orbit around the galaxy (table).
Now, what’s really interesting is if I add the Moon in by just, oh… Er, sorry – that wasn’t new was it?
[/caption]
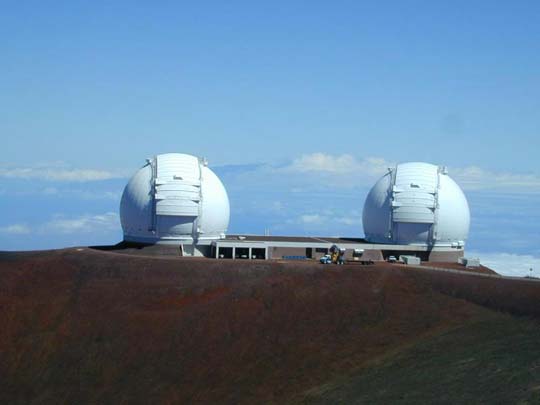
There are two Keck telescopes – Keck I and Keck II; together they make up the W.M. Keck Observatory, though strictly speaking the observatory is a great deal more than just the telescopes (there’s all the instrumentation, especially the interferometer, the staff, support facilities, etc, etc, etc.).
William Myron Keck (1880-1964) established a philanthropic foundation in 1954, to support scientific discoveries and new technologies. One project funded was the first Keck telescope, which was quite revolutionary at the time. Not only was it the largest optical telescope (and it still is) – it’s 10 meters in diameter – but is made up of 36 hexagonal segments, the manufacture of which required several breakthroughs … and all 36 are kept in line by a system of sensors and actuators which adjusts their position twice a second. Keck I saw first light in 1993. Like nearly all modern, large optical telescopes, the Keck telescopes are alt-azimuth. Fun fact: to keep the telescope at an optimal working temperature – no cool-down period during the evening – giant aircons work flat out during the day.
The Keck telescopes are on the summit of Hawaii’s Mauna Kea, where the air is nearly always clear, dry, and not turbulent (the seeing is, routinely, below 1″); an ideal site for not only optical astronomy, but also infrared.
The second Keck telescope – Keck II – saw first light in 1996, but its real day of glory came in 1999, when one of the first adaptive optics (AO) systems was installed on it (the first installed on a large telescope).
2004 saw another first for the Keck telescope – a laser guide star AO system, which gives the Keck telescopes a resolution at least as good as the Hubble Space Telescope’s (in the infrared)!
And in 2005 the two Keck telescopes operated together, as an interferometer; yet another first.
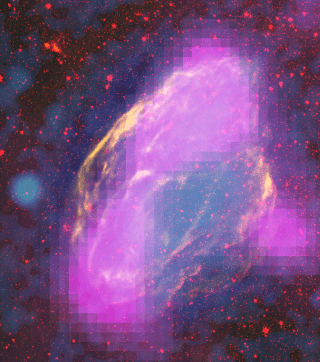
Fermi mapped GeV-gamma-ray emission regions (magenta) in the W44 supernova remnant. The features clearly align with filaments detectable in other wavelengths. This composite merges X-ray data (blue) from the Germany/U.S./UK ROSAT mission, infrared (red) from NASA’s Spitzer Space Telescope, and radio (orange) from the Very Large Array near Socorro, N.M. Credit: NASA/DOE/Fermi LAT Collaboration, NASA/ROSAT, NASA/JPL-Caltech, and NRAO/AUI
[/caption]
From the name, electron volt, you might guess that this has something to do with electricity. Well, you’d be right, it does … but did you know that the electron volt is actually a unit of energy, like the erg or joule?
The symbol for the electron volt is eV – lower case e, upper case V. Like the meter, and parsec, the electron volt can have a prefix, so lots of electron volts can be written easily, so there’s a kilo-electron volt (keV, one thousand eV), mega-electron volt (MeV, one million eV), giga-electron volt (GeV, one thousand million eV), and so on.
About the energy the electron volt represents: if you accelerate an isolated electron through an electric potential difference of one volt, it will gain one electron volt of kinetic energy. Now a volt is a joule per coulomb, so an electron volt is one electric charge times one, or approx 1.6 x 10⁻¹⁹ joules (J).
Astronomers use electron volts to measure the energy of electromagnetic radiation, or photons, in the x-ray and gamma-ray wavebands of the electromagnetic spectrum, and also use electron volts to describe the difference in atomic or molecular energy states which give rise to ultraviolet, visual, or infrared lines, or limits. So, for example, the Lyman limit – which corresponds to the energy to just ionize an atom of hydrogen – is both 91.2 nm and 13.6 eV.
Now particle physicists use the electron volt, as a unit of energy too; however, confusingly, they also use it as a unit of mass! They do this by using the famous E = mc2 equation, so 1 eV – the unit of mass – is equal to 1 eV (the unit of energy) divided by c2 (c is the speed of light). So, for example, the mass of the proton is 0.938 GeV/c2, which makes the GeV/c2 a very convenient unit (= 1.783 x 10⁻²⁷ kg). By convention, the c2 is usually dropped, and masses quoted in GeV.
Oh, and in some branches of physics, the eV is also a unit of temperature!
Would you like to read more on the electron volt? Try Energetic Particles (NASA), and How Big is an Electron Volt? (Fermilab).
[/caption]The image on the left is a basic atom diagram. This one shows the protons, neutrons, and electrons of a carbon atom. Each is in a group of six. That makes the atom very stable. There have been many atomic models over the years, but this type of model is now widely considered a sound basic version. Atomic diagrams were developed to explain the interaction of the elements of the Earth and space long before atoms could be observed. Nowadays, scientists can see particles that are smaller than an atom. These sub-atomic particles are the basis of particle physics.
Scientists have used atomic diagrams to explain the workings of the world for centuries. The ancient Greeks and, before them, the Chinese and Babylonians believed that there were forces that could not be seen that allowed certain metals to be combined and worked to man’s advantage. They did not know it, but that was simply heated metals exchanging subatomic particles to become a new metal.
Basic chemistry explains the atom best. It states that the fundamental building block of matter is the atom. An atom consists of three main parts: protons, neutrons, and electrons. Protons have a positive electrical charge. Neutrons have no electrical charge. Electrons have a negative electrical charge. Protons and neutrons are found together in what is called the nucleus of the atom. Electrons circle around nucleus. Chemical reactions involve interactions between the electrons of one atom and the electrons of another atom. Atoms which have different amounts of electrons and protons have a positive or negative electrical charge and are called ions. When atoms bond together, they can make larger building blocks of matter called molecules. If science did not have the atom modeled out, it would never have understood this exchange of electrons and we could still be stuck in the Dark Ages.
Earlier, I mentioned that there had been many atom models developed. Some of them are the Bohr model, the cubic model, the plum pudding model, the Saturnian model, and the Rutherford model.
Each of these models improved on the other and propelled science closer to a perfect atomic model. The Bohr and Rutherford models were developed for quantum mechanics and used for astronomical applications. As a matter of fact, an improvement on the Bohr model, called the Bohr-Summerfield model, is responsible for some of the many things we now know about quantum mechanics.
The atom diagram is under constant revision as science uncovers more information about sub-atomic particles. Follow this link to get information about the Bohr model and its enhancements. Here on Universe Today we have two great articles: one about the proton and the other about electrons. Astronomy Cast offers a good episode about matter from stars.
[/caption]The atom definition is: A unit of matter, the smallest unit of an element, having all the characteristics of that element and consisting of a dense, central, positively charged nucleus surrounded by a system of electrons. The entire structure has an approximate diameter of 10-8 centimeters and characteristically remains undivided in chemical reactions except for limited removal, transfer, or exchange of certain electrons. Essentially, it is the smallest possible part of an element that still remains the element.
Under normal circumstances an atom can be broken down into any smaller particles, but we humans, have devised ways to break the atom apart. That is the entire basis of the atom bomb, particle colliders, and quarks. It takes high speed, high energy smashing of particles to break an atom. A particle collider does that and helps us understand some of the theories in particle physics. The results of an atom bomb are widely known. Quarks are extremely small particles that do not exist alone. They must group to form the protons, electron, and neutrons normally found in a single atom of an element. They have only been found as a result of a particle collider and in theory.
An atom itself is made up of three tiny kinds of particles called subatomic particles: protons, neutrons, and electrons. The protons and the neutrons make up the center of the atom called the nucleus and the electrons fly around above the nucleus in a small cloud. The electrons carry a negative charge and the protons carry a positive charge. In a normal (neutral) atom the number of protons and the number of electrons are equal. Often, but not always, the number of neutrons is the same, too. The opposing forces(negative and positive) attract and repel each other in the right way so as to keep the atom together. The universe could be looked at as one large atom. Everything in space attracts and repels just right so as to keep the whole together.
One type of theoretical ion propulsion spacecraft would have to take advantage of this atomic attraction and repulsion to operate. It takes advantage of magnetism and electricity to push a ship through space. Electricity, generated by the ship’s solar panels, gives a positive electrical charge to atoms inside the chamber. They are pulled by magnetism towards the back of the ship and then pushed by magnetic repulsion out of the ship. This steady stream of atoms going out of the spacecraft gives it the thrust it needs to go forward through space. NASA has tested other types of ion propulsion and found them lacking.
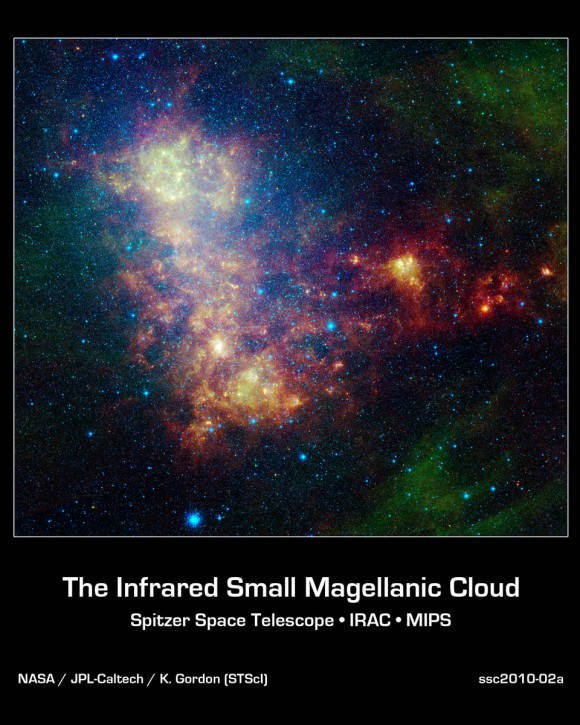
Infrared portrait of the Small Magellanic Cloud, made by NASA's Spitzer Space Telescope
At the end of the proverbial day, space-based missions like Spitzer produce millions of observations of astronomical objects, phenomena, and events. And those terabytes of data are used to test hypotheses in astrophysics which lead to a deeper understanding of the universe and our home in it, and perhaps some breakthrough whose here-on-the-ground implementation leads to a major, historic improvement in human welfare and planetary ecosystem health.
But such missions also leave more immediate legacies, in terms of the pleasure they bring millions of people, via the beauty of their images (not to mention posters, computer wallpaper and screen savers, and even inspiration for avatars).
Some recent results from one of Spitzer’s programs – SAGE-SMC – are no exception.
The image shows the main body of the Small Magellanic Cloud (SMC), which is comprised of the “bar” on the left and a “wing” extending to the right. The bar contains both old stars (in blue) and young stars lighting up their natal dust (green/red). The wing mainly contains young stars. In addition, the image contains a galactic globular cluster in the lower left (blue cluster of stars) and emission from dust in our own galaxy (green in the upper right and lower right corners).
The data in this image are being used by astronomers to study the lifecycle of dust in the entire galaxy: from the formation in stellar atmospheres, to the reservoir containing the present day interstellar medium, and the dust consumed in forming new stars. The dust being formed in old, evolved stars (blue stars with a red tinge) is measured using mid-infrared wavelengths. The present day interstellar dust is weighed by measuring the intensity and color of emission at longer infrared wavelengths. The rate at which the raw material is being consumed is determined by studying ionized gas regions and the younger stars (yellow/red extended regions). The SMC is one of very few galaxies where this type of study is possible, and the research could not be done without Spitzer.
This image was captured by Spitzer’s infrared array camera and multiband imaging photometer (blue is 3.6-micron light; green is 8.0 microns; and red is combination of 24-, 70- and 160-micron light). The blue color mainly traces old stars. The green color traces emission from organic dust grains (mainly polycyclic aromatic hydrocarbons). The red traces emission from larger, cooler dust grains.
The image was taken as part of the Spitzer Legacy program known as SAGE-SMC: Surveying the Agents of Galaxy Evolution in the Tidally-Stripped, Low Metallicity Small Magellanic Cloud.
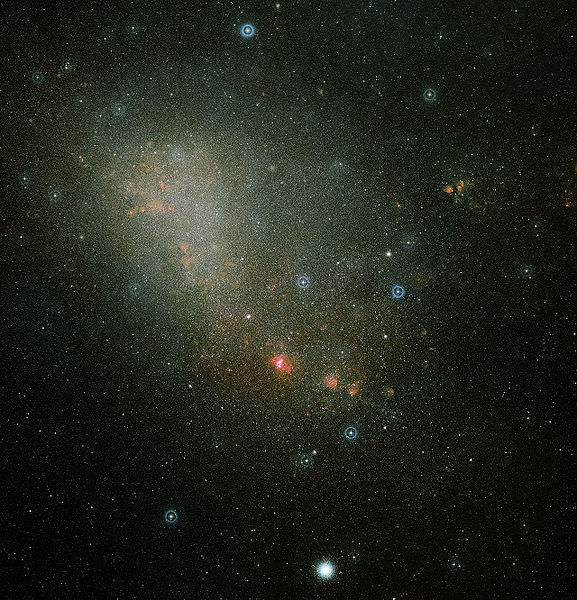
The Small Magellanic Cloud (SMC), and its larger sister galaxy, the Large Magellanic Cloud (LMC), are named after the seafaring explorer Ferdinand Magellan, who documented them while circling the globe nearly 500 years ago. From Earth’s southern hemisphere, they can appear as wispy clouds. The SMC is the further of the pair, at 200,000 light-years away.
Recent research has shown that the galaxies may not, as previously suspected, orbit around our galaxy, the Milky Way. Instead, they are thought to be merely sailing by, destined to go their own way. Astronomers say the two galaxies, which are both less evolved than a galaxy like ours, were triggered to create bursts of new stars by gravitational interactions with the Milky Way and with each other. In fact, the LMC may eventually consume its smaller companion.
Karl Gordon, the principal investigator of the latest Spitzer observations at the Space Telescope Science Institute in Baltimore, Maryland, and his team are interested in the SMC not only because it is so close and compact, but also because it is very similar to young galaxies thought to populate the universe billions of years ago. The SMC has only one-fifth the amount of heavier elements, such as carbon, contained in the Milky Way, which means that its stars haven’t been around long enough to pump large amounts of these elements back into their environment. Such elements were necessary for life to form in our solar system.
Studies of the SMC therefore offer a glimpse into the different types of environments in which stars form.
“It’s quite the treasure trove,” said Gordon, “because this galaxy is so close and relatively large, we can study all the various stages and facets of how stars form in one environment.” He continued: “With Spitzer, we are pinpointing how to best calculate the numbers of new stars that are forming right now. Observations in the infrared give us a view into the birthplace of stars, unveiling the dust-enshrouded locations where stars have just formed.” Little Galaxy with a Tail (Small Magellanic Cloud imaged by Spitzer)
This image shows the main body of the SMC, which is comprised of the “bar” and “wing” on the left and the “tail” extending to the right. The tail contains only gas, dust and newly formed stars. Spitzer data has confirmed that the tail region was recently torn off the main body of the galaxy. Two of the tail clusters, which are still embedded in their birth clouds, can be seen as red dots.
Small Magellanic Cloud. Image credit: NASA/ESA/HST
I’m trying something new, here in Universe Today, a puzzle.
This is, I hope, a puzzle that cannot be answered by five minutes spent googling, a puzzle that requires you to cudgel your brains a bit, and do some lateral thinking.
There are no prizes for the first correct answer – the judge’s decision (mine!) will be final – but I do hope that you’ll have lots of fun.
What do David, Nicholas, and Ferdinand have in common?
Post your guesses in the comments section, and check back later at this same post to find the answer. To make this puzzle fun for everyone, please don’t include links or extensive explanations with your answer, until after the answer has been given. Good luck!
Answer has now been posted below:
[/caption] Malin1 (Hubble Space Telescope image courtesy of Aaron Barth) Mayall's Object (Hubble Space Telescope)
David Malin (Malin I), Nicholas Mayall (Mayall’s object, or Arp 148), and Ferdinand Magellan (the Magellanic Clouds) all have galaxies named after them!
I should have said that David, Nicholas, and Ferdinand have a deep association with the topics we regularly cover here in Universe Today – astronomy, space, telescopes, etc.
Congratulations to IVAN3MAN, who guessed correctly first, and to all those who came up with equally good answers – all must have prizes.
Stay tuned for another Universe Puzzle, next week (HINT: I will pose a quite different kind of puzzle then).
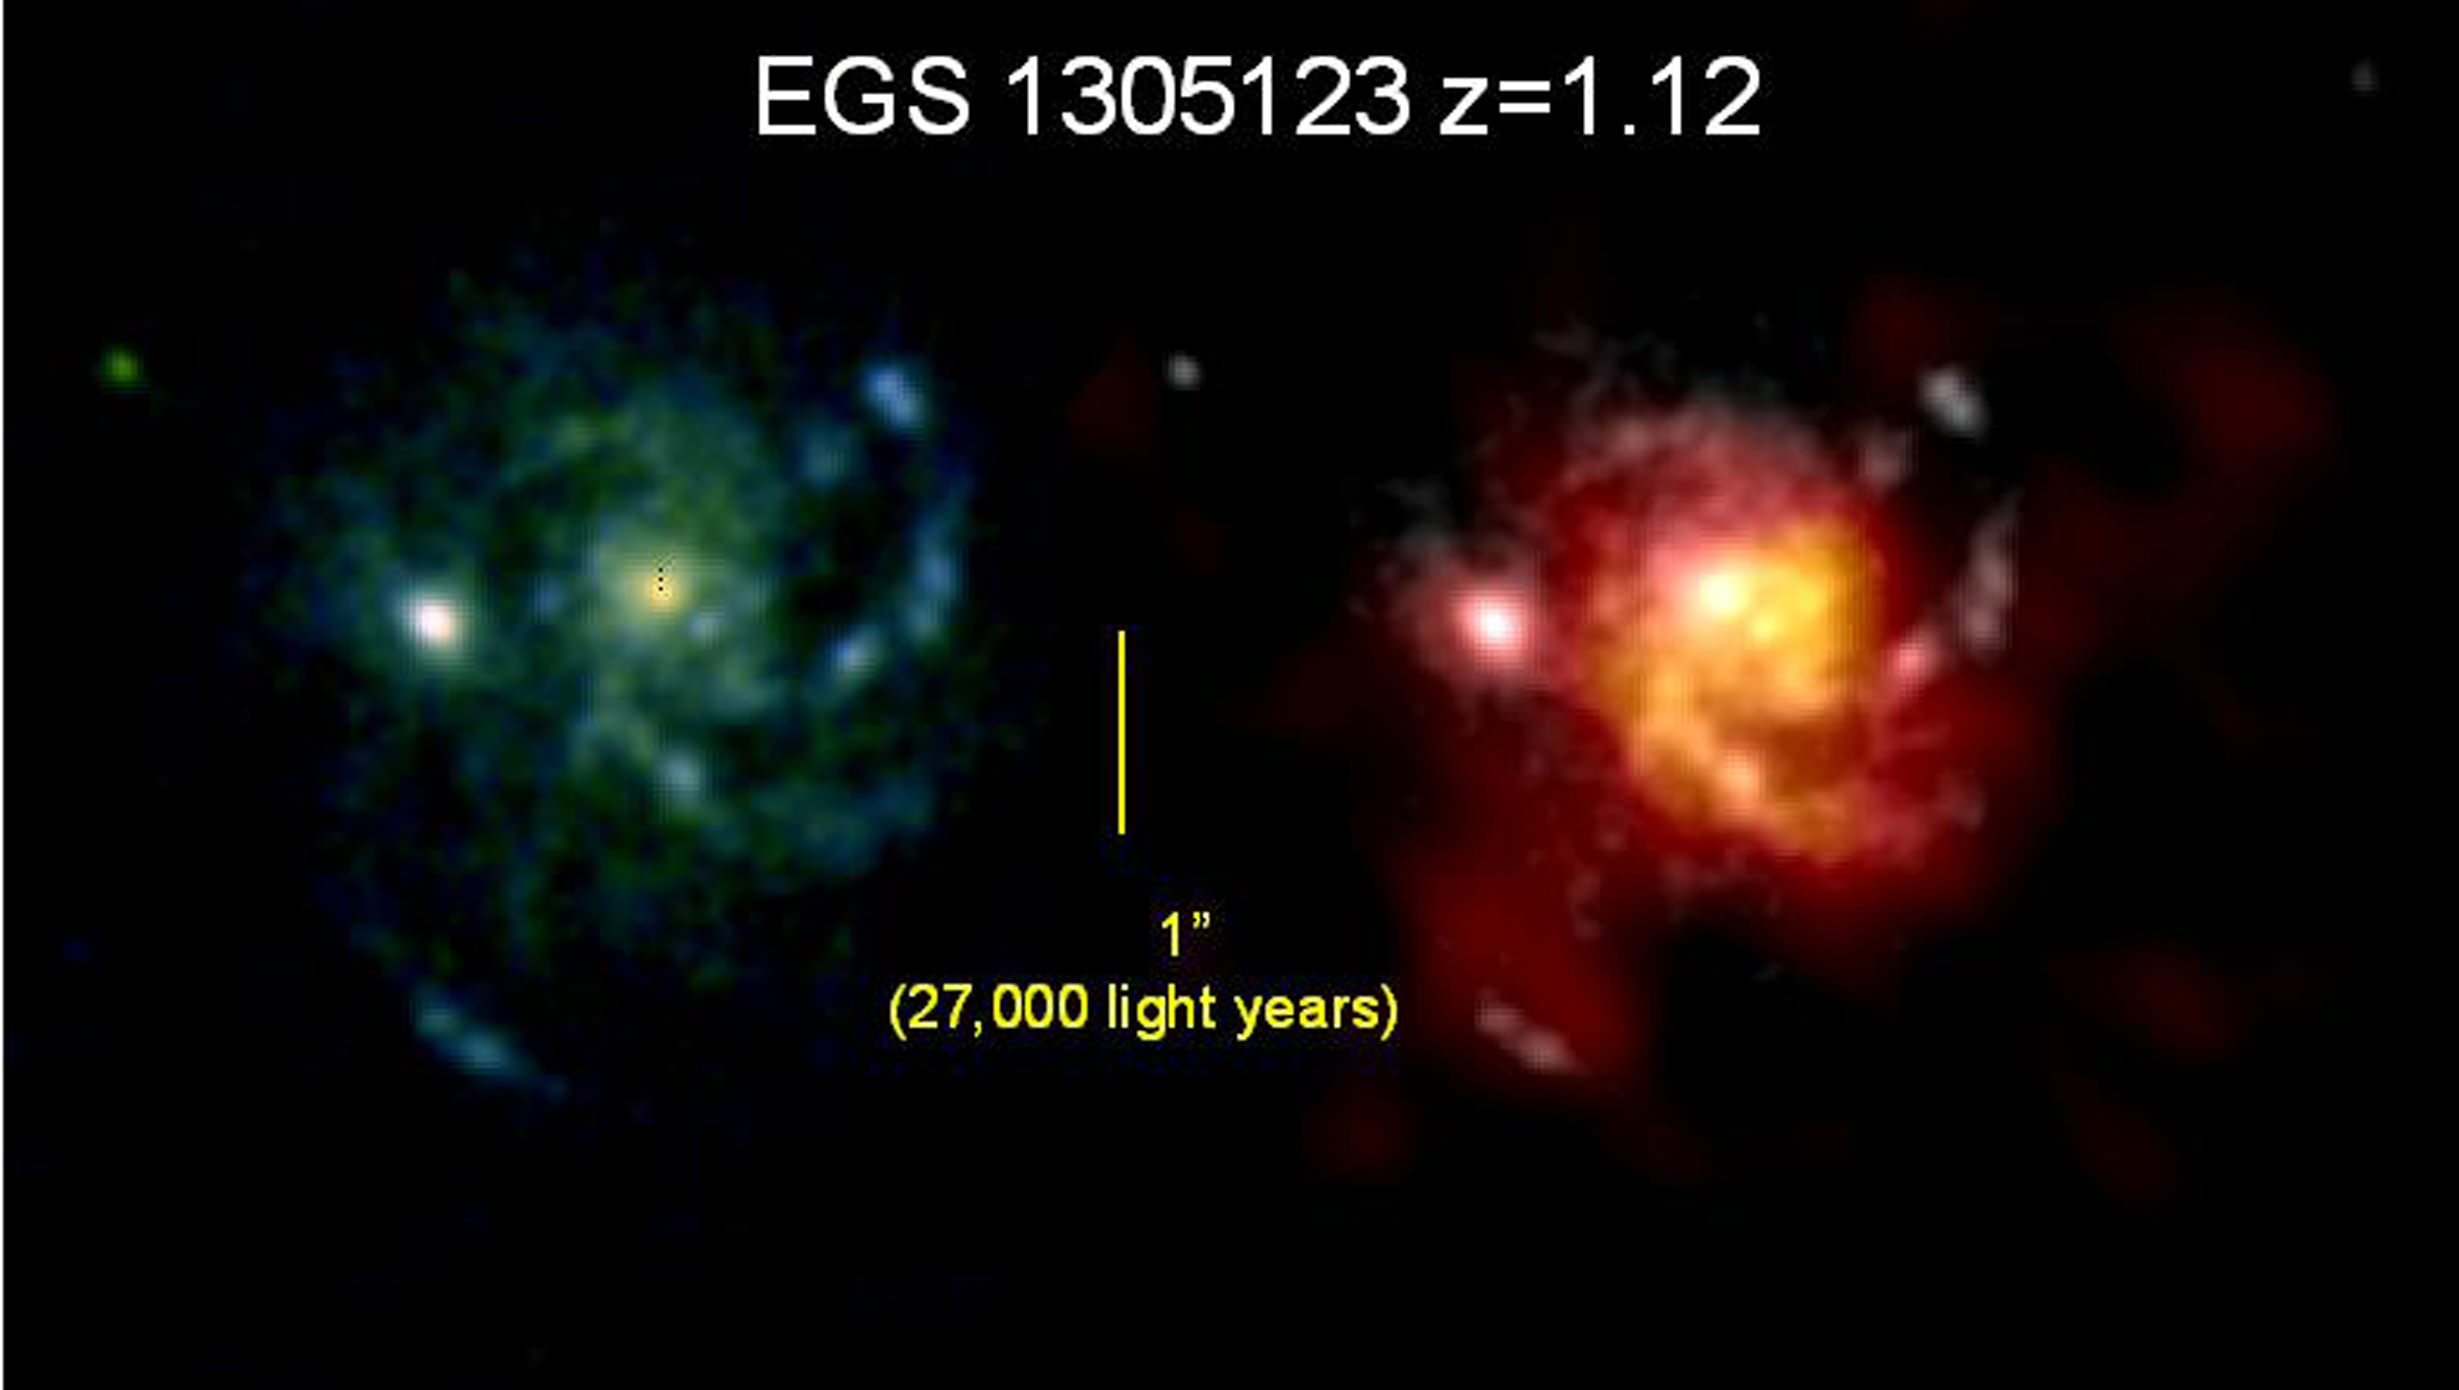
Typical massive galaxy at z=1.1 (left: V, I (Hubble); right: CO 3-2 mm emission (IRAM); copyright MPE/IRAM)
[/caption]
Galaxies long, long ago were very fecund; they gave birth to stars at a rate at least ten times what we see today.
Why? Was there more stuff around then, to make stars? Or were galaxies back then more efficient at star-making? Or something else??
Dr. Linda Tacconi, from Germany’s Max-Planck-Institut für extraterrestrische Physik, led an international team of astronomers to find out why … and the answer seems to be that young galaxies were stuffed to the gills with gas.
“We have been able, for the first time, to detect and image the cold molecular gas in normal star forming galaxies, which are representative of the typical massive galaxy populations shortly after the Big Bang,” said Dr Tacconi.
The challenging observations yield the first glimpse how galaxies, or more precisely the cold gas in these galaxies, looked a mere 3 to 5 billion years after the Big Bang (equivalent to a cosmological redshift z~2 to z~1). At this age, galaxies seem to have formed stars more or less continuously with at least ten times the rate seen in similar mass systems in the local Universe.
It is now reasonably well-established that galaxies formed from proto-galaxies, which themselves formed in local over-densities, dominated by cold dark matter – dark matter halos – where the newly neutral hydrogen and helium collected and cooled. Through collisions and mergers, and some on-going gas accretion, the proto-galaxies formed young galaxies, a few billion years after the Big Bang – in short, hierarchical formation. The Plateau de Bure millimetre interferometer in the southern French Alps. Copyright: IRAM
Detailed observations of the cold gas and its distribution and dynamics hold a key role in disentangling the complex mechanisms responsible for turning the first proto-galaxies into modern galaxies, such as the Milky-Way. A major study of distant, luminous star forming galaxies at the Plateau de Bure millimeter interferometer has now resulted in a breakthrough by having a direct look at the star formation “food”. The study took advantage of major recent advances in the sensitivity of the radiometers at the observatory to make the first systematic survey of cold gas properties (traced by a rotational line of the carbon monoxide molecule) of normal massive galaxies when the Universe was 40% (z=1.2) and 24% (z=2.3) of its current age. Previous observations were largely restricted to rare, very luminous objects, including galaxy mergers and quasars. The new study instead traces massive star forming galaxies representative of the ‘normal’, average galaxy population in this mass and redshift range.
“When we started the programme about a year ago”, says Dr. Tacconi, “we could not be sure that we would even detect anything. But the observations were successful beyond our most optimistic hopes. We have been able to demonstrate that massive normal galaxies at z~1.2 and z~2.3 had five to ten times more gas than what we see in the local Universe. Given that these galaxies were forming gas at a high rate over long periods of time, this means that gas must have been continuously replenished by accretion from the dark matter halos, in excellent agreement with recent theoretical work.”
Another important result of these observations is the first spatially resolved images of the cold gas distribution and motions in several of the galaxies. “This survey has opened the door for an entirely new avenue of studying the evolution of galaxies,” says Pierre Cox, the director of IRAM. “This is really exciting and there is much more to come.”
“These fascinating findings provide us with important clues and constraints for next-generation theoretical models that we will use to study the early phases of galaxy development in more detail,” says Andreas Burkert, specialist for star formation and the evolution of galaxies at Germany’s Excellence Cluster Universe. “Eventually these results will help to understand the origin and the development of our Milky Way.”
About the EGS 1305123 image: Spatially resolved optical and millimeter images of a typical massive galaxy at redshift z=1.1 (5.5 billion years after the Big Bang). The left image was taken with the Hubble Space Telescope in the V- and I-optical bands, as part of the AEGIS survey of distant galaxies. The right image is an overlay of the CO 3-2 emission observed with the PdBI (red/yellow colors) superposed on the I-image (grey). For the first time these observations clearly show that the molecular line emission and the optical light from massive stars trace a massive, rotating disk of diameter ~60,000 light years. This disk is similar in size and structure as seen in z~0 disk galaxies, such as the Milky Way. However, the mass of cold gas is in this disk is about an order of magnitude larger than in typical z~0 disk galaxies. This explains why high-z galaxies can form continuously at about ten times the rate of typical z~0 galaxies.
The proton has three parts, two up quarks and one down quark … and the gluons which these three quarks exchange, which is how the strong (nuclear) force works to keep them from getting out.
The proton’s world is a totally quantum one, and so it is described entirely by just a handful of numbers, characterizing its spin (a technical term, not to be confused with the everyday English word; the proton’s spin is 1/2), electric charge (+1 e, or 1.602176487(40)×10-19 C), isospin (also 1/2), and parity (+1). These properties are derived directly from those of the proton parts, the three quarks; for example, the up quark has an electric charge of +2/3 e, and the down -1/3 e, which sum to +1 e. Another example, color charge: the proton has a color charge of zero, but each of its constituent three quarks has a non-zero color charge – one is ‘blue’, one ‘red’, and one ‘green’ – which ‘sum’ to zero (of course, color charge has nothing whatsoever to do with the colors you and I see with our eyes!).
Murray Gell-Mann and George Zweig independently came up with the idea that the proton’s parts are quarks, in 1964 (though it wasn’t until several years later that good evidence for the existence of such parts was obtained). Gell-Mann was later awarded the Nobel Prize of Physics for this, and other work on fundamental particles (Zweig has yet to receive a Nobel).
The quantum theory which describes the strong interaction (or strong nuclear force) is quantum chromodynamics, QCD for short (named in part after the ‘colors’ of quarks), and this explains why the proton has the mass it does. You see, the up quark’s mass is about 2.4 MeV (mega-electron volts; particle physicists measure mass in MeV/c2), and the down’s about 4.8 MeV. Gluons, like photons, are massless, so the proton should have a mass of about 9.6 MeV (= 2 x 2.4 + 4.8), right? But it is, in fact, 938 MeV! QCD accounts for this enormous difference by the energy of the QCD vacuum inside the proton; basically, the self-energy of ceaseless interactions of quarks and gluons.


")
")
")