NASA to Test New Atomic Clock

Artist's rendering of a vacuum tube, one of the main components of an atomic clock. Credit: NASA

[/caption]
When people think of space technologies, many think of solar panels, propulsion systems and guidance systems. One important piece of technology in spaceflight is an accurate timing device.

Many satellites and spacecraft require accurate timing signals to ensure the proper operation of scientific instruments. In the case of GPS satellites, accurate timing is essential, otherwise anything relying on GPS signals to navigate could be misdirected.

The third technology demonstration planned by NASA’s Jet Propulsion Laboratory is the Deep Space Atomic Clock. The DSAC team plans to develop a small, low-mass atomic clock based on mercury-ion trap technology and demonstrate it in space.

What benefits will a new atomic clock design offer NASA and other players in near-Earth orbit and the rest of our solar system?

The Deep Space Atomic Clock demonstration mission will fly and validate an atomic clock that is 10-times more accurate than today’s systems. The project will demonstrate ultra-precision timing in space as well as the benefits said timing offers.

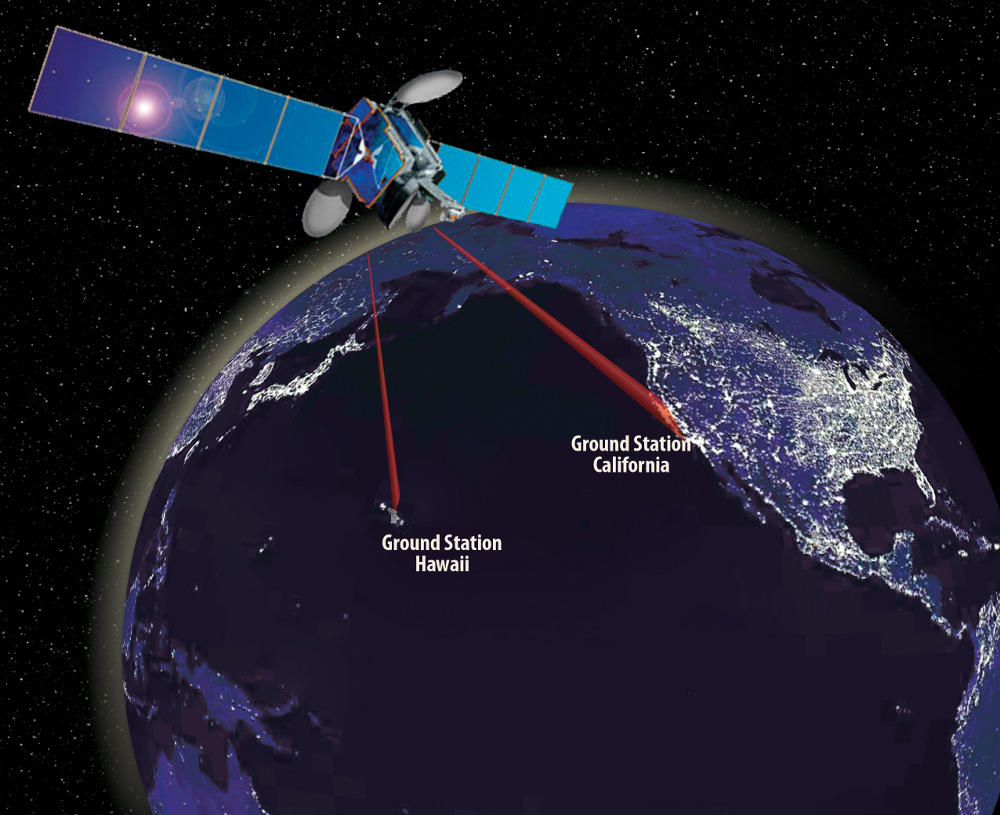
The DSAC will fly on an Iridium spacecraft and make use of GPS signals to demonstrate precision orbit determination and confirm the clock’s performance. As mentioned previously, precise timing and navigation are critical to the performance of many aspects of deep space and near-Earth exploration missions.

The DSAC team believes the demonstration will offer enhancements and cost savings for new missions, which include:

  • Increase Data Quantity: A factor of 2 to 3 increase in navigation and radio science data quantity by allowing coherent tracking to extend over the full view period of Earth stations.
  • Improve Data Quality: Up to 10 times more accurate navigation, gravity science, and occultation science at remote solar system bodies by using one-way radiometric links.
  • Enabling New Missions: Shift towards a more flexible and extensible one-way radio navigation architecture enabling development of capable in-situ satellite navigation systems and autonomous deep space radio navigation.
  • Reduce Proposed Mission Costs: Reduce mission costs for using the Deep Space Network (DSN) through aperture sharing and one-way downlink only time.
  • Benefits to GPS: Improve clock stability of the next GPS system by 100 times.
  • One example use for the DSAC is for a future mission that is a follow-up to the Mars Reconnaissance Orbiter (MRO). A spacecraft equipped with the DSAC could avoid reliance on two-way communications using NASA’s Deep Space Network to perform orbital determination.

    One of the benefits of avoiding said reliance on two-way communications would allow the mission to only require the DSN for one-way communication to transmit scientific data to Earth. Reducing the reliance on two-way communications would provide an additional benefit of cost savings.

    In the previous example, the DSAC team estimates an $11 million dollar reduction in network operational costs, as well as a 100% increase in the amount of usable science and navigation data that could be received.

    Overview of Deep Space Atomic Clock (DASC) mission. Image Credit: NASA

    The Space Communications and Navigation (SCaN) office in the Human Exploration and Operations Mission Directorate is collaborating with the NASA Office of the Chief Technologist in sponsoring this technology demonstration.

    If successful the DSAC flight demonstration mission will bring the improved atomic clock technology to a technological readiness level that will allow it to be used in a wide variety of future space missions.

    Read our earlier articles about the other technology demonstrations planned:

    NASA To Test Solar Sail Technology
    NASA To Test Laser Communications Systems

    Source: NASA Technology Demonstration Mission Announcements

    Pluto or Eris: Which is Bigger?

    Hubble image of Pluto and some of its moons, Charon, Nix and Hydra. Image Credit: NASA, ESA, H. Weaver (JHU/APL), A. Stern (SwRI), and the HST Pluto Companion Search Team

    [/caption]

    The controversy between Pluto and Eris regarding their status as “largest dwarf planet” continues. During a joint meeting of the American Astronomical Society Division for Planetary Sciences and the European Planetary Science Congress last week in Nantes, France, new data was presented that may help settle the debate. The new findings regarding this size of Eris may be a surprise to some, and to others a confirmation of what was believed to be true.

    How were astronomers able to make the new measurements of Eris, and what implications will these new measurements have on the Pluto / Eris debate?

    Using a celestial alignment known as an occultation, Bruno Sicardy of the Paris Observatory (University of Pierre and Marie Curie, France) and his team were able calculate the diameter of Eris in 2010. The occultation was caused by Eris moving past a background star, which blocked the star’s light and cast a small shadow on Earth. When Sicardy and his team compared the shadow’s size at two different sites in Chile, the calculations provided a diameter of 2,326 kilometers for Eris. A previous study by Sicardy in 2009 placed Pluto’s diameter to be at least 2,338 kilometers.

    However, the first estimates of Eris’ size that were made shortly after its discovery put the diameter at 3,000 km, plus or minus 400 km. But a later estimate from observations with the Hubble Space Telescope said Eris might be 2,400 km in diameter, plus or minus 100 km.

    If Sicardy’s data calculations hold true, this places Pluto and Eris at nearly the exact same diameter. What has continued to not be up for debate, however, is that Eris is far more massive than Pluto. Given a nearly identical diameter for Eris and Pluto, Eris’s extra mass makes it the denser of the two dwarf planets. According to Sicardy and his team the increased density of Eris, “indicates that Eris is mainly composed of rocky material, with a relatively thin ice mantle.” Since Pluto’s density indicates it comprised of about equal parts ice and rock, Eris’s extra mass would appear to validate Sicardy’s assertion.

    Eris and its moon, Dysnomia. Credit: NASA, ESA, and M. Brown (California Institute of Technology)

    The Co-discoverer of Eris, and noted “Plutokiller” Mike Brown (Caltech) offers an interesting thought regarding the Pluto / Eris Debate:

    “Scientifically, knowing which one is bigger will teach us…. absolutely nothing. The fact that they are nearly identical in size is scientifically interesting; which one is a few kilometers bigger than the other matters not one bit.” Brown also added, “But, still, I will admit to having a bit of an emotional attachment to Eris, so, deep down inside, I want to believe it will turn out to be a little bigger.

    You can read a brief synopsis of Sicardy’s findings at: http://meetingorganizer.copernicus.org/EPSC-DPS2011/EPSC-DPS2011-137-8.pdf

    If you’d like to learn more about the Pluto / Eris debate, Brown has some great thoughts regarding the debate on his blog at: http://www.mikebrownsplanets.com/2010/11/how-big-is-pluto-anyway.html

    NASA to Test New Solar Sail Technology

    The Solar Sail demonstration mission. Credit: NASA

    [/caption]
    Solar sails, much like anti-matter and ion engines appear at first glance to only exist in science fiction. Many technologies from science fiction however, become science fact.

    In the example of solar sails, perfecting the technology would allow spacecraft to travel through our solar system using very little fuel.

    NASA has been making strides with solar sail technology. Using the NanoSail-D mission, NASA continues to gather valuable data on how well solar sails perform in space. The Planetary Society will also be testing solar sail technology with their LightSail-1 project sometime next year.

    How will NASA (and others) test solar sail technology, and develop it into a common, reliable technology?

    The second of three recently announced technology demonstrations, The Solar Sail Demonstration, will test the deployment of a solar sail in space along with testing attitude control. The solar sail will also execute a navigation sequence with mission-capable accuracy.

    In order to make science fiction into reality, NASA engineers are testing solar sails that could one day provide the propulsion for deep space missions. Spacecraft using solar sails would travel in our solar system in a similar manner to a sailboat through water, except spacecraft using solar sails would rely on sunlight instead of wind. A spacecraft propelled by a solar sail would use the sail to capture photons emitted from the Sun. Over time, the buildup of the solar photons provides enough thrust for a small spacecraft to travel in space.

    NASA’s solar sail demonstration mission will deploy and operate a sail area 7 times larger than ever flown in space. The technology used in the demonstration will be applicable to many future space missions, including use in space weather warning systems to provide timely and accurate warnings of solar flare activity. The solar sail demonstration is a collaborative effort between The National Oceanic and Atmospheric Administration (NOAA), NASA and contractor L’Garde Inc.

    NASA lists several capabilities solar sails have to offer, such as:

  • Orbital Debris: Orbital debris can be captured and removed from orbit over a period of years using the small solar-sail thrust.
  • De-orbit of spent satellites: Solar sails can be integrated into satellite payloads so that the satellite can be de-orbited at the end of its mission.
  • Station keeping: Using the low propellantless thrust of a solar sail to provide station keeping for unstable in-space locations.
  • Deep space propulsion: Payloads free of the Earth’s pull can be continuously and efficiently accelerated to the other planets, or out of the solar system, such as proposed in Project Encounter.
  • As an example, the GeoStorm project considers locating solar storm warning satellites at pseudo Lagrange points three times further from the Earth by using the solar sail to cancel some solar gravitational pull, thus increasing warning time from ~15 minutes to ~45 minutes.

    Providing a satellite with a persistent view of northern or southern latitudes, i.e., a “pole-sitter” project. This allows the observational advantages of today’s geosynchronous satellites for orbits with view angles of the northern and southern high-latitudes.

    A solar sail system, measuring 66 feet on each side was tested in 2005 in the world's largest vacuum chamber. Image Credit: NASA

    If you’d like to learn more about solar sails, Caltech has a nice “Solar Sailing 101” page at: http://www.ugcs.caltech.edu/~diedrich/solarsails/intro/intro.html

    Source: NASA Technology Demonstration Mission Updates

    NASA to Test Laser Communications System

    Conceptual image of The Laser Communications Relay Demonstration. Credit: NASA

    [/caption]Quite often, communication rates with remote spacecraft have been a limiting factor when exploring our solar system. For example, it can take up to 90 minutes to transfer one high-resolution image from the Mars Reconnaissance Orbiter to scientists on Earth.

    Improving data communication rates would allow scientists to collect additional data from future missions to Mars, Titan or other destinations in our solar system.

    How does NASA plan to overcome the current limitations in communication with spacecraft outside Earth orbit?

    One of three recently announced technology demonstrations, The Laser Communications Relay Demonstration, will help demonstrate and validate laser-based communications. One of many goals for the LCRD is to provide spacecraft in Earth orbit ( and beyond ) a faster and reliable method of communication than standard radio communications currently in use.

    A laser-based communication will allow NASA and other government agencies to perform missions that require higher data rates. In the cases where less data is required, the laser-based systems would consume less power, mass and precious volume inside a spacecraft. Given roughly equal mass, power, and volume, the laser-based communications system offers much higher data rates than a radio-based communications system.

    NASA’s goals for the LCRD are to:

    Enable reliable, capable, and cost effective optical communications technologies for near earth applications and provide the next steps required toward optical communications for deep space missions

    Demonstrate high data rate optical communications technology necessary for:

  • Near-Earth spacecraft (bi-directional links supporting hundreds of Mbps to Gbps)
  • Deep Space missions (tens to hundreds of Mbps from distances such as Mars and Jupiter)
  • Develop, validate and characterize operational models for practical optical communications
  • Identify and develop requirements and standards for future operational optical communication systems
  • Establish a strong partnership with multiple government agencies to facilitate crosscutting infusion of optical communications technologies
  • Develop the industrial base and transfer technology for future space optical communications systems
  • High-rate communications 10-100 times more capable than current radio systems will also allow for greatly improved connectivity and enable new generations of remote missions that are far more capable than today’s missions. NASA’s LCRD will also provide the satellite communication industry with technology not available today. Laser-based space communications will enable missions to use high-definition video and and pave the way for a possible “virtual presence” on a remote planet or other bodies in the solar system.

    While the laser-based communications technology featured in the LCRD will allow more data to be sent from spacecraft to scientists on Earth, the communication delays (a few seconds for the Moon, and over twenty minutes for Mars) will still require careful mission planning.

    Diagram of LCRD mission. Image Credit: NASA

    The Laser Communications Relay Demonstration (LCRD) is led by the NASA Goddard Space Flight Center. Space Communications and Navigation (SCaN) office in the Human Exploration and Operations Mission Directorate is collaborating with the NASA Office of the Chief Technologist in sponsoring this technology demonstration.

    If you’d like to learn more about NASA’s LCRD, you can read more at: http://www.nasa.gov/topics/technology/features/laser-comm.html

    Source: NASA Technology Demonstration Updates

    Why is Tonight’s Full Moon the Smallest of the Year?

    Moon at Perigee and Apogee. Credit NASA

    [/caption]
    Think we can only see half of the Moon’s surface from Earth? Not always.

    Over the course of the year, observers on Earth can view a bit less and a bit more than half of the lunar surface. Additionally, the Moon appears smaller in the sky during some months compared to other times of the year.

    Due to the processes at work, tonight’s full Moon is an opposite of the “Supermoon” that made headlines earlier this year.

    What causes our Moon to change apparent size throughout the year, and how do we notice this phenomenon?

    While it would be difficult to judge the apparent size of the full Moon each month with our eyes, the phenomenon of Lunar librations is readily apparent in the animation below.

    There are three forces at work that help produce the “dancing” effect as shown in the video above.

    There are three types of lunar libration:

    First, the Moon doesn’t orbit Earth in a perfectly circular orbit. An eccentric orbit will cause our Moon to lead and lag in its orbital position while its rotational speed stays the same. This causes a libration in longitude.

    Secondly, the Moon’s rotational axis is slightly inclined to its orbital plane, with respect to Earth. The Moon’s orbit is also inclined with respect to the ecliptic, allowing the Moon to be illuminated from above and sometimes from below. The illumination from above and below allows some of the lunar surface beyond the poles to be visible from Earth.

    Last but not least, there is a small daily oscillation due to Earth’s rotation. This oscillation changes the perspective at which an observer views the Moon. Imagine a straight line connecting the center of Earth with the center of the Moon. Over time an observer would be on one side of this imaginary line and then the other, which would allow the observer to look first around one side of the Moon and then around the other. This is because an observer on Earth is on the surface and not at the center of Earth.

    A slight bit of Lunar trivia: Lunar librations helped notable British astronomer Patrick Moore investigate the edge regions where librations provided extra coverage. Moore’s investigations lead him to discover a large circular feature, which he named “Mare Oriental”. Once studies of the Lunar farside were performed from space, it was discovered that Mare Oriental was a lava filled impact crater.

    LROC “Treasure Map” Reveals Titanium Deposits

    LROC WAC mosaic showing boundary between Mare Serenitatis and Mare Tranquillitatis. The relative blue colour of the Tranquillitatis mare is due to higher abundances of the titanium bearing mineral ilmenite. Image Credit: NASA/GSFC/Arizona State University

    [/caption]
    At a joint meeting of the European Planetary Science Congress and the American Astronomical Society’s Division for Planetary Sciences, Mark Robinson and Brett Denevi have unveiled a map of the Moon combining observations in visible and ultraviolet wavelengths showing areas rich in Titanium ores. This discovery not only provides a potential source of a valuable metal, but also provides valuable information which will help scientists better understand lunar formation and composition of the Moon’s interior.

    How did Robinson and Denevi create this map, and what can other scientists learn from this new data?

    “Looking up at the Moon, its surface appears painted with shades of grey – at least to the human eye. But with the right instruments, the Moon can appear colourful,” said Robinson, (Arizona State University). “The maria appear reddish in some places and blue in others. Although subtle, these colour variations tell us important things about the chemistry and evolution of the lunar surface. They indicate the titanium and iron abundance, as well as the maturity of a lunar soil.”

    Robinson and the LROC team previously used similar methods with Hubble Space Telescope images to map titanium abundances near the Apollo 17 landing site, which had varying titanium levels. When Robinson compared the Apollo data with the HST images, it was revealed that titanium levels corresponded to the ratio of ultraviolet to visible light reflected by the lunar surface.

    “Our challenge was to find out whether the technique would work across broad areas, or whether there was something special about the Apollo 17 area,” said Robinson. Using nearly 4000 images from the LRO Wide-Area Camera (WAC), Robinson’s team created a mosaic image, which was then studied using the techniques developed with the Hubble imagery. The research used the same ultraviolet to visible light ratio to deduce titanium abundance, which was verified by surface samples gathered by Apollo and Luna missions.

    “We still don’t really understand why we find much higher abundances of titanium on the Moon compared to similar types of rocks on Earth. What the lunar titanium-richness does tell us is that the interior of the Moon had less oxygen when it was formed, knowledge that geochemists value for understanding the evolution of the Moon,” added Robinson.

    On our Moon, titanium is found in a mineral known as ilmenite, which contains iron, titanium and oxygen. In theory, Lunar miners could process ilmenite to separate the iron, titanium and oxygen. Aside from the elements present in ilmenite, Apollo data shows that minerals containing titanium can retaining particles from the solar wind, such as helium and hydrogen. Future inhabitants of the Moon would find helium and hydrogen, along with oxygen and iron to be vital resources.

    “The new map is a valuable tool for lunar exploration planning. Astronauts will want to visit places with both high scientific value and a high potential for resources that can be used to support exploration activities. Areas with high titanium provide both – a pathway to understanding the interior of the Moon and potential mining resources,” said Denevi (John Hopkins University).

    The new maps also provide insight into how lunar surface materials are altered by the impact of charged particles from the solar wind and high-velocity micrometeorite impacts. Over time, lunar rock is pulverized into a fine powder by micrometeorite impacts, and charged particles alter the chemical composition and color of the surface.Recently exposed materials, such as ejecta from impacts appear bluer and have higher reflectivity than older Lunar regolith (soil). Younger material is estimated to take about half a billion years to fully “weather” to the point where it would blend in with older material.

    “One of the exciting discoveries we’ve made is that the effects of weathering show up much more quickly in ultraviolet than in visible or infrared wavelengths. In the LROC ultraviolet mosaics, even craters that we thought were very young appear relatively mature. Only small, very recently formed craters show up as fresh regolith exposed on the surface,” said Robinson.

    So it seems there’s always something new to be learned from our Moon. Coincidentally, tomorrow (October 8th) is International Observe the Moon Night, so make sure you grab your binoculars or telescope tomorrow night and do some lunar observations! Be sure to check out our previous coverage of International Observe the Moon Night by our Senior Editor, Nancy Atkinson at: http://www.universetoday.com/89522/need-an-excuse-to-gaze-at-the-moon-international-observe-the-moon-night-is-coming/

    If you’d like to learn more about the Lunar Reconnaissance Orbiter Camera, visit: http://lroc.sese.asu.edu/

    Source: Europlanet Research Infrastructure / Division for Planetary Sciences of the American Astronomical Society Joint Press Release

    Buried Treasure: Astronomers Find Exoplanets Hidden in Old Hubble Data

    The left image shows the star HR 8799 as seen by Hubble's Near Infrared Camera and Multi-Object Spectrometer (NICMOS) in 1998. The center image shows recent processing of the NICMOS data with newer, sophisticated software. The processing removes most of the scattered starlight to reveal three planets orbiting HR 8799. Based on the reanalysis of NICMOS data and ground-based observations, the illustration on the right shows the positions of the star and the orbits of its four known planets. (Credit: NASA; ESA; STScI, R. Soummer)

    [/caption]

    Over the past 21 years, the Hubble Space Telescope has gathered boatloads of data, with the Hubble archive center filling about 18 DVDs for every week of the telescope’s life. Now, with improved data mining techniques, an intense re-analysis of HST images from 1998 has revealed some hidden treasures: previously undetected extrasolar planets.

    Scientists say this discovery helps prove a new method for planet hunting by using archived Hubble data. Also, discovering the additional exoplanets in the Hubble data helps them compare earlier orbital motion data to more recent observations.

    How did astronomers detect the previously unseen exoplanets, and can the methods used be applied to other HST data sets?

    This isn’t the first time hidden exoplanets have been revealed in HST data – In 2009 David Lafreniere of the University of Montreal recovered hidden exoplanet data in Hubble images of HR 8799. The HST images Lafreniere studied were taken in 1998 with the Near Infrared Camera and Multi-Object Spectrometer (NICMOS). The outermost planet orbiting HR 8799 was identified and demonstrated the power of a new data-processing technique which could tease out faint planets from the glow of their central star.

    Four giant planets are now known to orbit HR 8799, the first three of which were discovered in 2007/2008 in near-infrared images taken with instruments at the W.M. Keck Observatory and the Gemini North telescope by Christian Marois of the National Research Council in Canada. In 2010 Marois and his team uncovered a fourth, innermost, planet. What makes the HR 8799 system so unique is that it is the only multi-exoplanet star system that has been directly imaged.

    The new analysis by Remi Soummer of the Space Telescope Science Institute has found all three of the outer planets. Unfortunately, the fourth, innermost planet is close to HR 8799 and cannot be imaged due obscuration by the the NICMOS coronagraph that blocks the central star’s light.

    When astronomers study exoplanets by directly imaging them, they study images taken several years apart – not unlike methods used to find Pluto and other dwarf planets in our solar system like Eris. Understanding the orbits in a multi-planet system is critical since massive planets can affect the orbits of their neighboring planets in the system. “From the Hubble images we can determine the shape of their orbits, which brings insight into the system stability, planet masses and eccentricities, and also the inclination of the system,” says Soummer.

    Making the study difficult is the extremely long orbits of the three outer planets, which are approximately 100, 200, and 400 years, respectively. The long orbital periods require considerable time to produce enough motion for astronomers to study. In this case however, the added time span from the Hubble data helps considerably. “The archive got us 10 years of science right now,” Soummer says. “Without this data we would have had to wait another decade. It’s 10 years of science for free.”

    Given its 400 year orbital period, in the past ten years, the outermost planet has barely changed position. “But if we go to the next inner planet we see a little bit of an orbit, and the third inner planet we actually see a lot of motion,” Soummer added.

    When the original HST data was analyzed, the methods used to detect exoplanets such as those orbiting HR 8799 were not available. Techniques to subtract the light from a host star still left residual light that drowned out the faint exoplanets. Soummer and his team improved on the previous methods and used over four hundred images from over 10 years of NICMOS observations.

    The improvements on the previous technique included increasing contrast and minimizing residual starlight. Soummer and his team also successfully removed the diffraction spikes, a phenomenon that amateur and professional telescope imaging systems suffer from. With the improved techniques, Soummer and his team were able to see two of HR 8799’s faint inner planets, which are about 1/100,000th the brightness of the host star in infra-red.

    Soummer has made plans to next analyze 400 more stars in the NICMOS archive with the same technique, which demonstrates the power of the Hubble Space Telescope data archive. How many more exoplanets are uncovered is anyone’s guess.

    Finding these new exoplanets proves that even after the HST is no longer functioning, Hubble’s data will live on, and scientists will rely on Hubble’s revelations for years as they continue in their quest to understand the cosmos.

    Source: Hubble Space Telescope Mission Updates

    Even the Early Universe Had the Ingredients for Life

    The optical image of TN J0924-2201, a very distant radio galaxy at (redshift) z = 5.19, obtained with the Hubble Space Telescope. (c) NASA/STScI/NAOJ.

    [/caption]

    For us carbon-based life forms, carbon is a fairly important part of the chemical makeup of the Universe. However, carbon and oxygen were not created in the Big Bang, but rather much later in stars. How much later? In a surprising find, scientists have detected carbon much earlier in the Universe’s history than previously thought.

    Researchers from Ehime University and Kyoto University have reported the detection of carbon emission lines in the most distant radio galaxy known. The research team used the Faint Object Camera and Spectrograph (FOCAS) on the Subaru Telescope to observe the radio galaxy TN J0924-2201. When the research team investigated the detected carbon line, they determined that significant amounts of carbon existed less than a billion years after the Big Bang.

    How does this finding contribute to our understanding of the chemical evolution of the universe and the possibilities for life?

    To understand the chemical evolution of our universe, we can start with the Big Bang. According to the Big Bang theory, our universe sprang into existence about 13.7 billion years ago. For the most part, only Hydrogen and Helium ( and a sprinkle of Lithium) existed.

    So how do we end up with everything past the first three elements on the periodic table?

    Simply put, we can thank previous generations of stars. Two methods of nucleosythesis (element creation) in the universe are via nuclear fusion inside stellar cores, and the supernovae that marked the end of many stars in our universe.

    Over time, through the birth and death of several generations of stars, our universe became less “metal-poor” (Note: many astronomers refer to anything past Hydrogen and Helium as metals”). As previous generations of stars died out, they “enriched” other areas of space, allowing future star-forming regions to have conditions necessary to form non-star objects such as planets, asteroids, and comets. It is believed that by understanding how the universe created heavier elements, researchers will have a better understanding of how the universe evolved, as well as the sources of our carbon-based chemistry.

    So how do astronomers study the chemical evolution of our universe?

    By measuring the metallicity (abundance of elements past Hydrogen on the periodic table) of astronomical objects at various redshifts, researchers can essentially peer back into the history of our universe. When studied, redshifted galaxies show wavelengths that have been stretched (and reddened, hence the term redshift) due to the expansion of our universe. Galaxies with a higher redshift value (known as “z”) are more distant in time and space and provide researchers information about the metallicity of the early universe. Many early galaxies are studied in the radio portion of the electromagnetic spectrum, as well as infra-red and visual.

    The research team from Kyoto University set out to study the metallicity of a radio galaxy at higher redshift than previous studies. In their previous studies, their findings suggested that the main era of increased metallicity occurred at higher redshifts, thus indicating the universe was “enriched” much earlier than previous believed. Based on the previous findings, the team then decided to focus their studies on galaxy TN J0924-2201 – the most distant radio galaxy known with a redshift of z = 5.19.

    The deep optical spectrum of TN J0924-2201 obtained with FOCAS on the Subaru Telescope. The red arrows point to the carbon emission line.

    The research team used the FOCAS instrument on the Subaru Telescope to obtain an optical spectrum of galaxy TN J0924-2201. While studying TN J0924-2201, the team detected, for the first time, a carbon emission line (See above). Based on the detection of the carbon emission line, the team discovered that TN J0924-2201 had already experienced significant chemical evolution at z > 5, thus an abundance of metals was already present in the ancient universe as far back as 12.5 billion years ago.

    If you’d like to read the team’s findings you can access the paper Chemical properties in the most distant radio galaxy – Matsuoka, et al at: http://arxiv.org/abs/1107.5116

    Source: NAOJ Press Release

    World Space Week ( Oct 4th – 10th ) — Join the Fun!

    World Space Week - October 4th - 10th, 2011. Image Credit: World Space Week Association

    [/caption]

    What is World Space Week?

    Founded in 1981, World Space Week Association is one of the world’s oldest space education organizations. As a partner of the United Nations in the global coordination of World Space Week, WSWA recruits and supports a worldwide network of coordinators and participants. WSWA is a non-government, nonprofit, international organization, based in the United States.

    World Space Week is an international celebration of science and technology, and how each benefits the human condition. In 1999 The United Nations General Assembly declared that World Space Week will be held each year from October 4-10, commemorating two notable space-related events:

    The annual kick-off date of October 4th corresponds with the October 4th 1957 launch of the first human-made Earth satellite, Sputnik 1.

    The end date of October 10th corresponds with the October 10th 1967 signing of the Treaty on Principles Governing the Activites of States in the Exploration and Peaceful Uses of Outer Space, including the Moon and Other Celestial Bodies.

    Here’s some information from their F.A.Q on how you can participate in World Space Week, either by volunteering or by attending an event.

    Where and how is World Space Week celebrated?

    World Space Week is open to everyone – government agencies, industry, non-profit organizations, teachers, or even individuals can organize events to celebrate space. WSW is coordinated by the United Nations with the support of WSWA and local coordinators in many countries.

    What are the benefits of World Space Week?

    WSW educates people around the world about the benefits they receive from space and encourages greater use of space for sustainable economic development. WSW also demonstrates public support for space programs and excites children about learning and their future.
    Some of the other benefits include promoting institutions around the world that are involved in space and fostering a sense of international cooperation in space outreach and education.

    How can schools participate?

    This event is ideal for teachers to promote student interest in science and math. To encourage participation, World Space Week Association gives various educational awards each year.

    Sign at NASA's Johnson Space Center announcing World Space Week. Photo Credit: NASA/WSWA

    What can I do for World Space Week?

    If you’d like to become involved with WSW you can:

  • Volunteer for World Space Week Association
  • Organize an event directly
  • Help expand and coordinate World Space Week
  • Encourage teachers and students to do space-related activities
  • Become a Volunteer
  • Hold an Event During World Space Week
  • If you hold an event, be sure to add your event to the World Space Week calendar and tell the media and your regional WSW coordinator about your planned event. You can also order World Space Week posters and display them in your community.

    If you’d like to find a World Space Week event in your area, visit:http://www.worldspaceweek.org/calendar_2011.php

    You can learn more about World Space Week at: http://www.worldspaceweek.org

    Source: World Space Week Association

    Martian Atmosphere Supersaturated with Water?

    Artist's impression of the Mars Express spacecraft in orbit. Image Credit: ESA/Medialab

    [/caption]

    Last week, scientists announced findings based on data from the SPICAM spectrometer onboard ESA’s Mars Express spacecraft. The findings reported in Science by Maltagliati et al (2011), reveal that the Martian atmosphere is supersaturated with water vapor. According to the research team, the discovery provides new information which will help scientists better understand the water cycle and atmospheric history of Mars.

    What processes are at work to allow large amounts of water vapor in the Martian atmosphere?

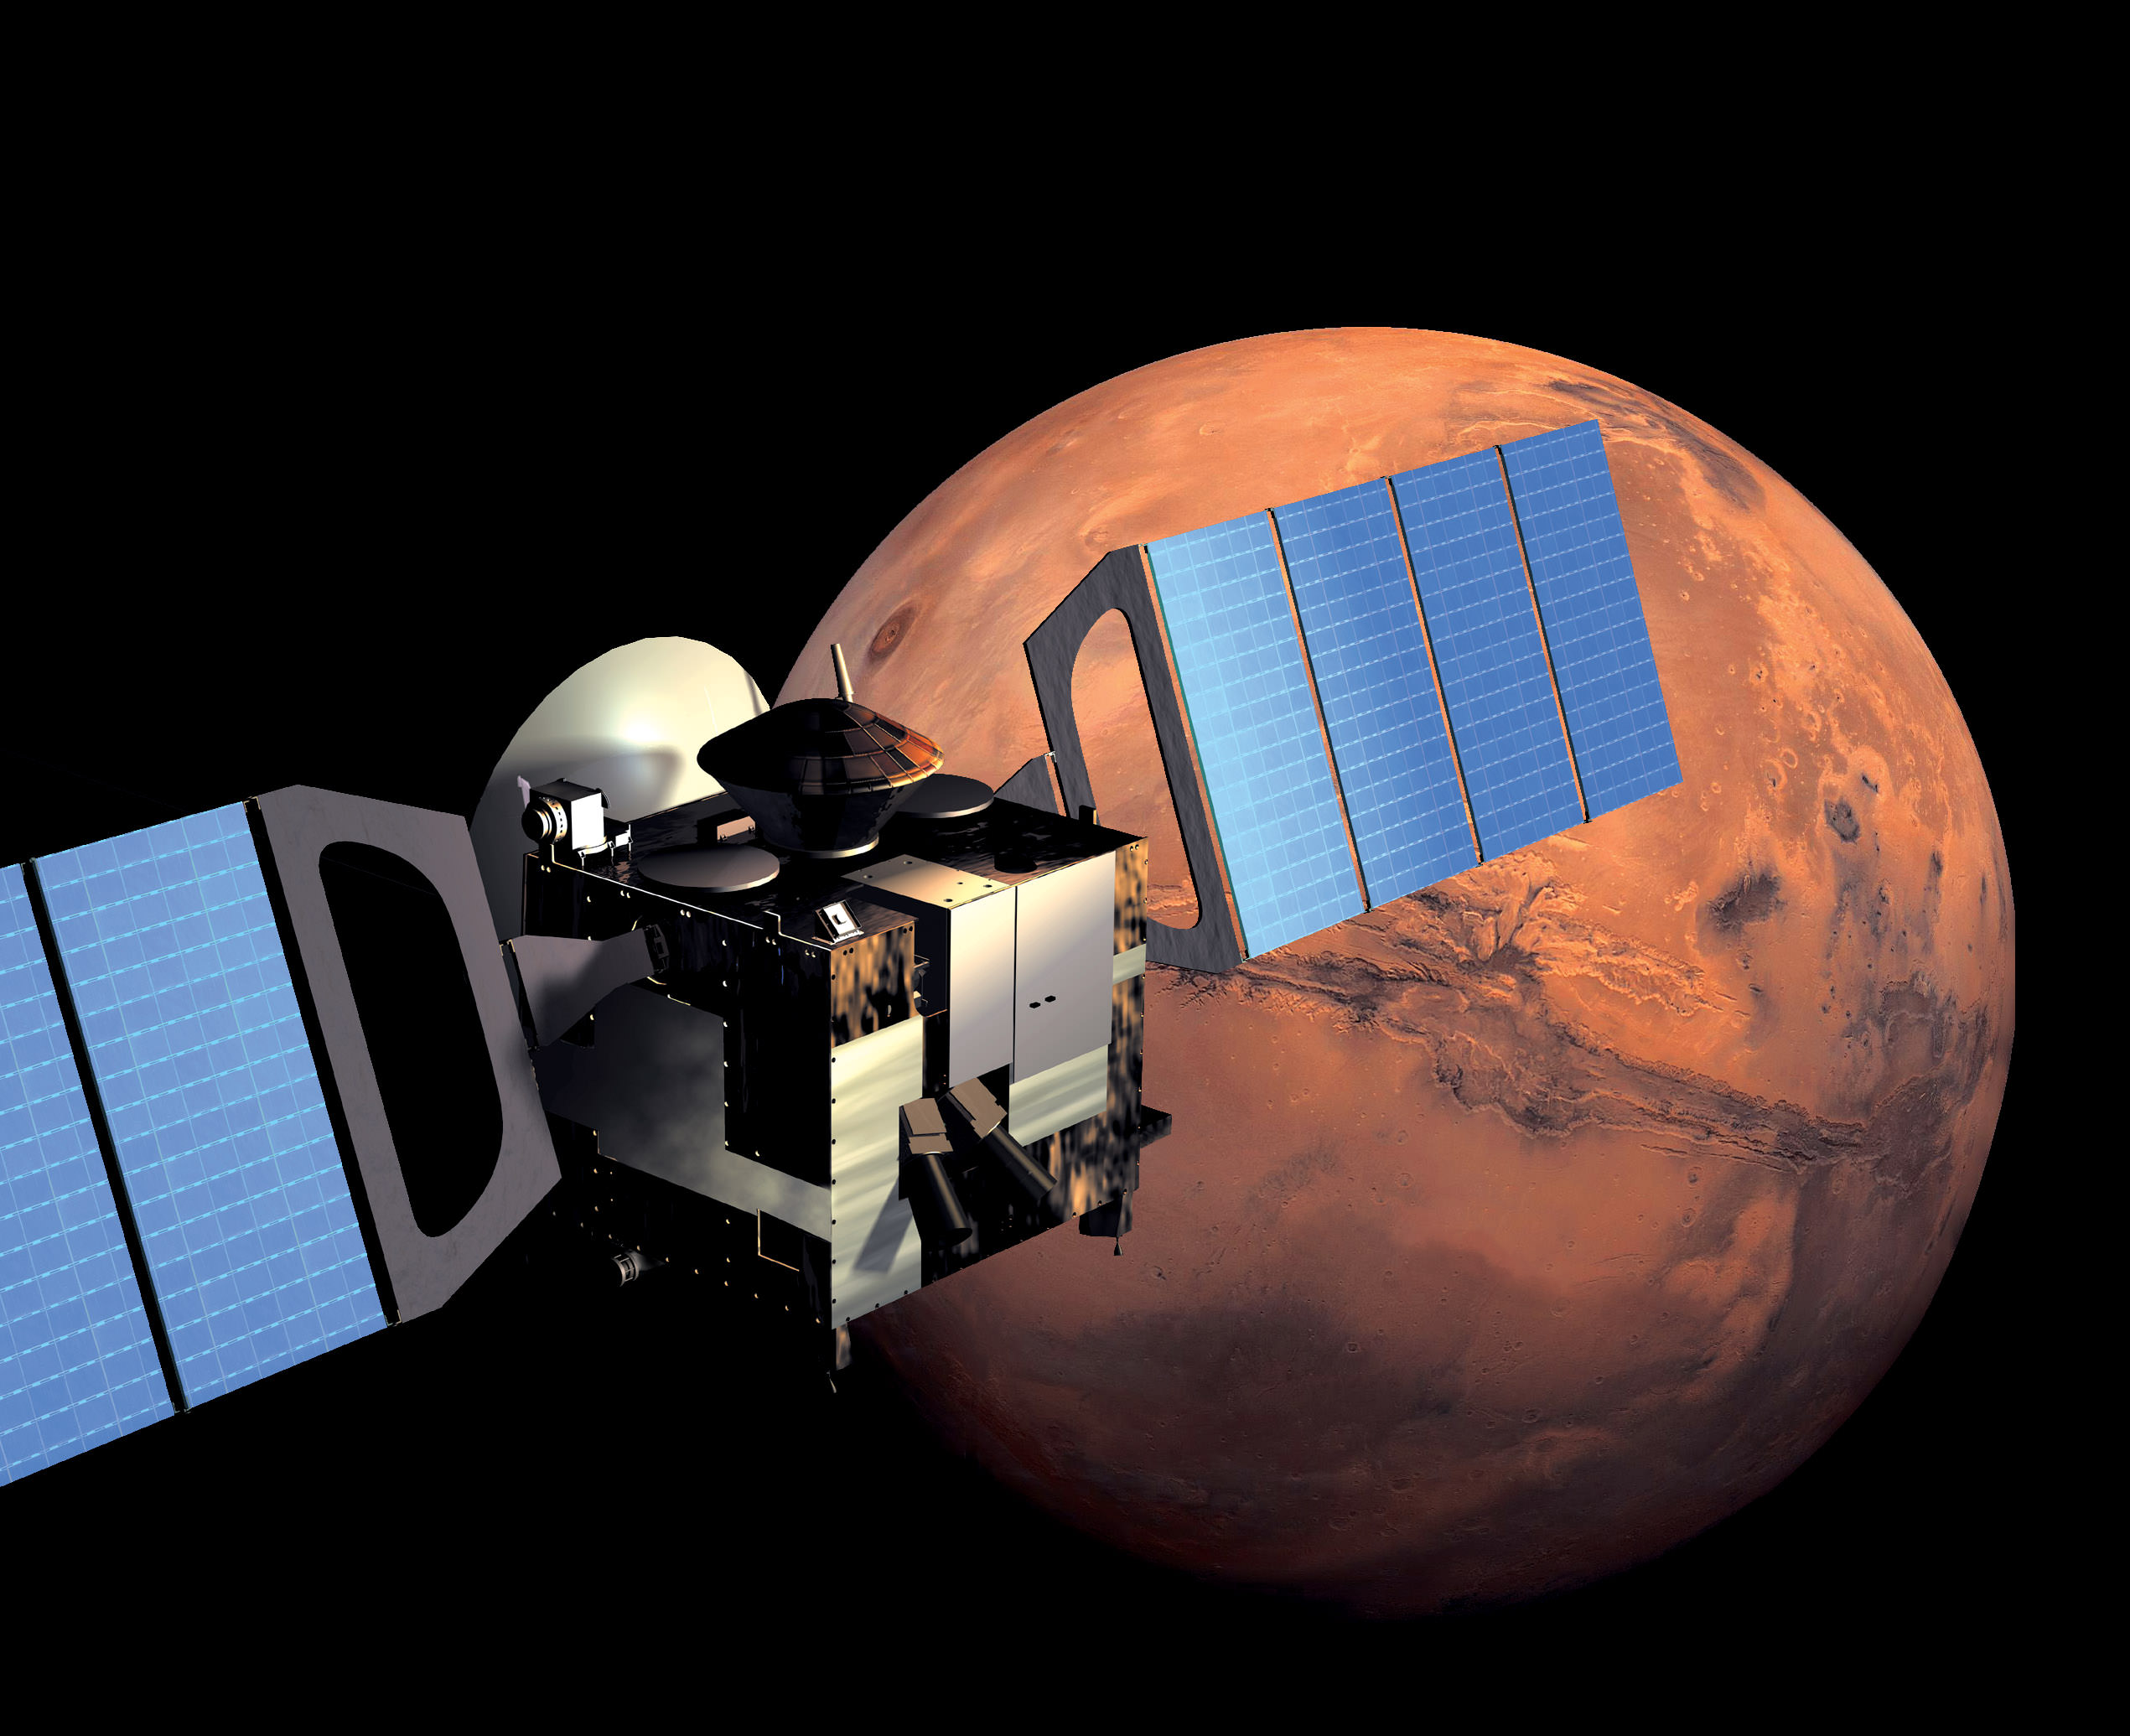
    The animated sequence to the left shows the water cycle of the Martian atmosphere in action:

    When the polar caps of Mars (which contain frozen Water and CO2) are warmed by the Sun during spring and summer, the water sublimates and is released into the atmosphere.

    Atmospheric winds transport the water vapor molecules to higher altitudes. When the water molecules combine with dust molecules, clouds are formed. If there isn’t much dust in the atmosphere, the rate of condensation is reduced, which leaves water vapor in the atmosphere, creating a supersaturated state.

    Water vapor may also be transported by wind to the southern hemisphere or may be carried high in the atmosphere.In the upper atmosphere the water vapor can be affected by photodissociation in which solar radiation (white arrows) splits the water molecules into hydrogen and oxygen atoms, which then escape into space.

    Scientists had generally assumed that supersaturation cannot exist in the cold Martian atmosphere, believing that any water vapor in excess of saturation instantly froze. Data from SPICAM revealed that supersaturation takes place at altitudes of up to 50 km above the surface when Mars is at its farthest point from the Sun.

    Based on the SPICAM data, scientists have learned that there is more water vapor in the Martian atmosphere than previously believed. While the amount of water in Mars’ atmosphere is about 10,000 times less water vapor than that of Earth, previous models have underestimated the amount of water in the Martian atmosphere at altitudes of 20-50km, as the data suggests 10 to 100 times more water than expected at said altitudes.

    “The vertical distribution of water vapour is a key factor in the study of Mars’ hydrological cycle, and the old paradigm that it is mainly controlled by saturation physics now needs to be revised,” said Luca Maltagliati, one of the authors of the paper. “Our finding has major implications for understanding the planet’s global climate and the transport of water from one hemisphere to the other.”

    “The data suggest that much more water vapour is being carried high enough in the atmosphere to be affected by photodissociation,” added Franck Montmessin, Principal Investigator for SPICAM and co-author of the paper.

    “Solar radiation can split the water molecules into oxygen and hydrogen atoms, which can then escape into space. This has implications for the rate at which water has been lost from the planet and for the long-term evolution of the Martian surface and atmosphere.”

    However, water vapour is a very dynamic trace gas, and one of the most seasonally variable atmospheric constituents on Mars.

    Source: ESA/Mars Express Mission Updates