Astronomers Discover Ancient ‘Ultra-Red’ Galaxies

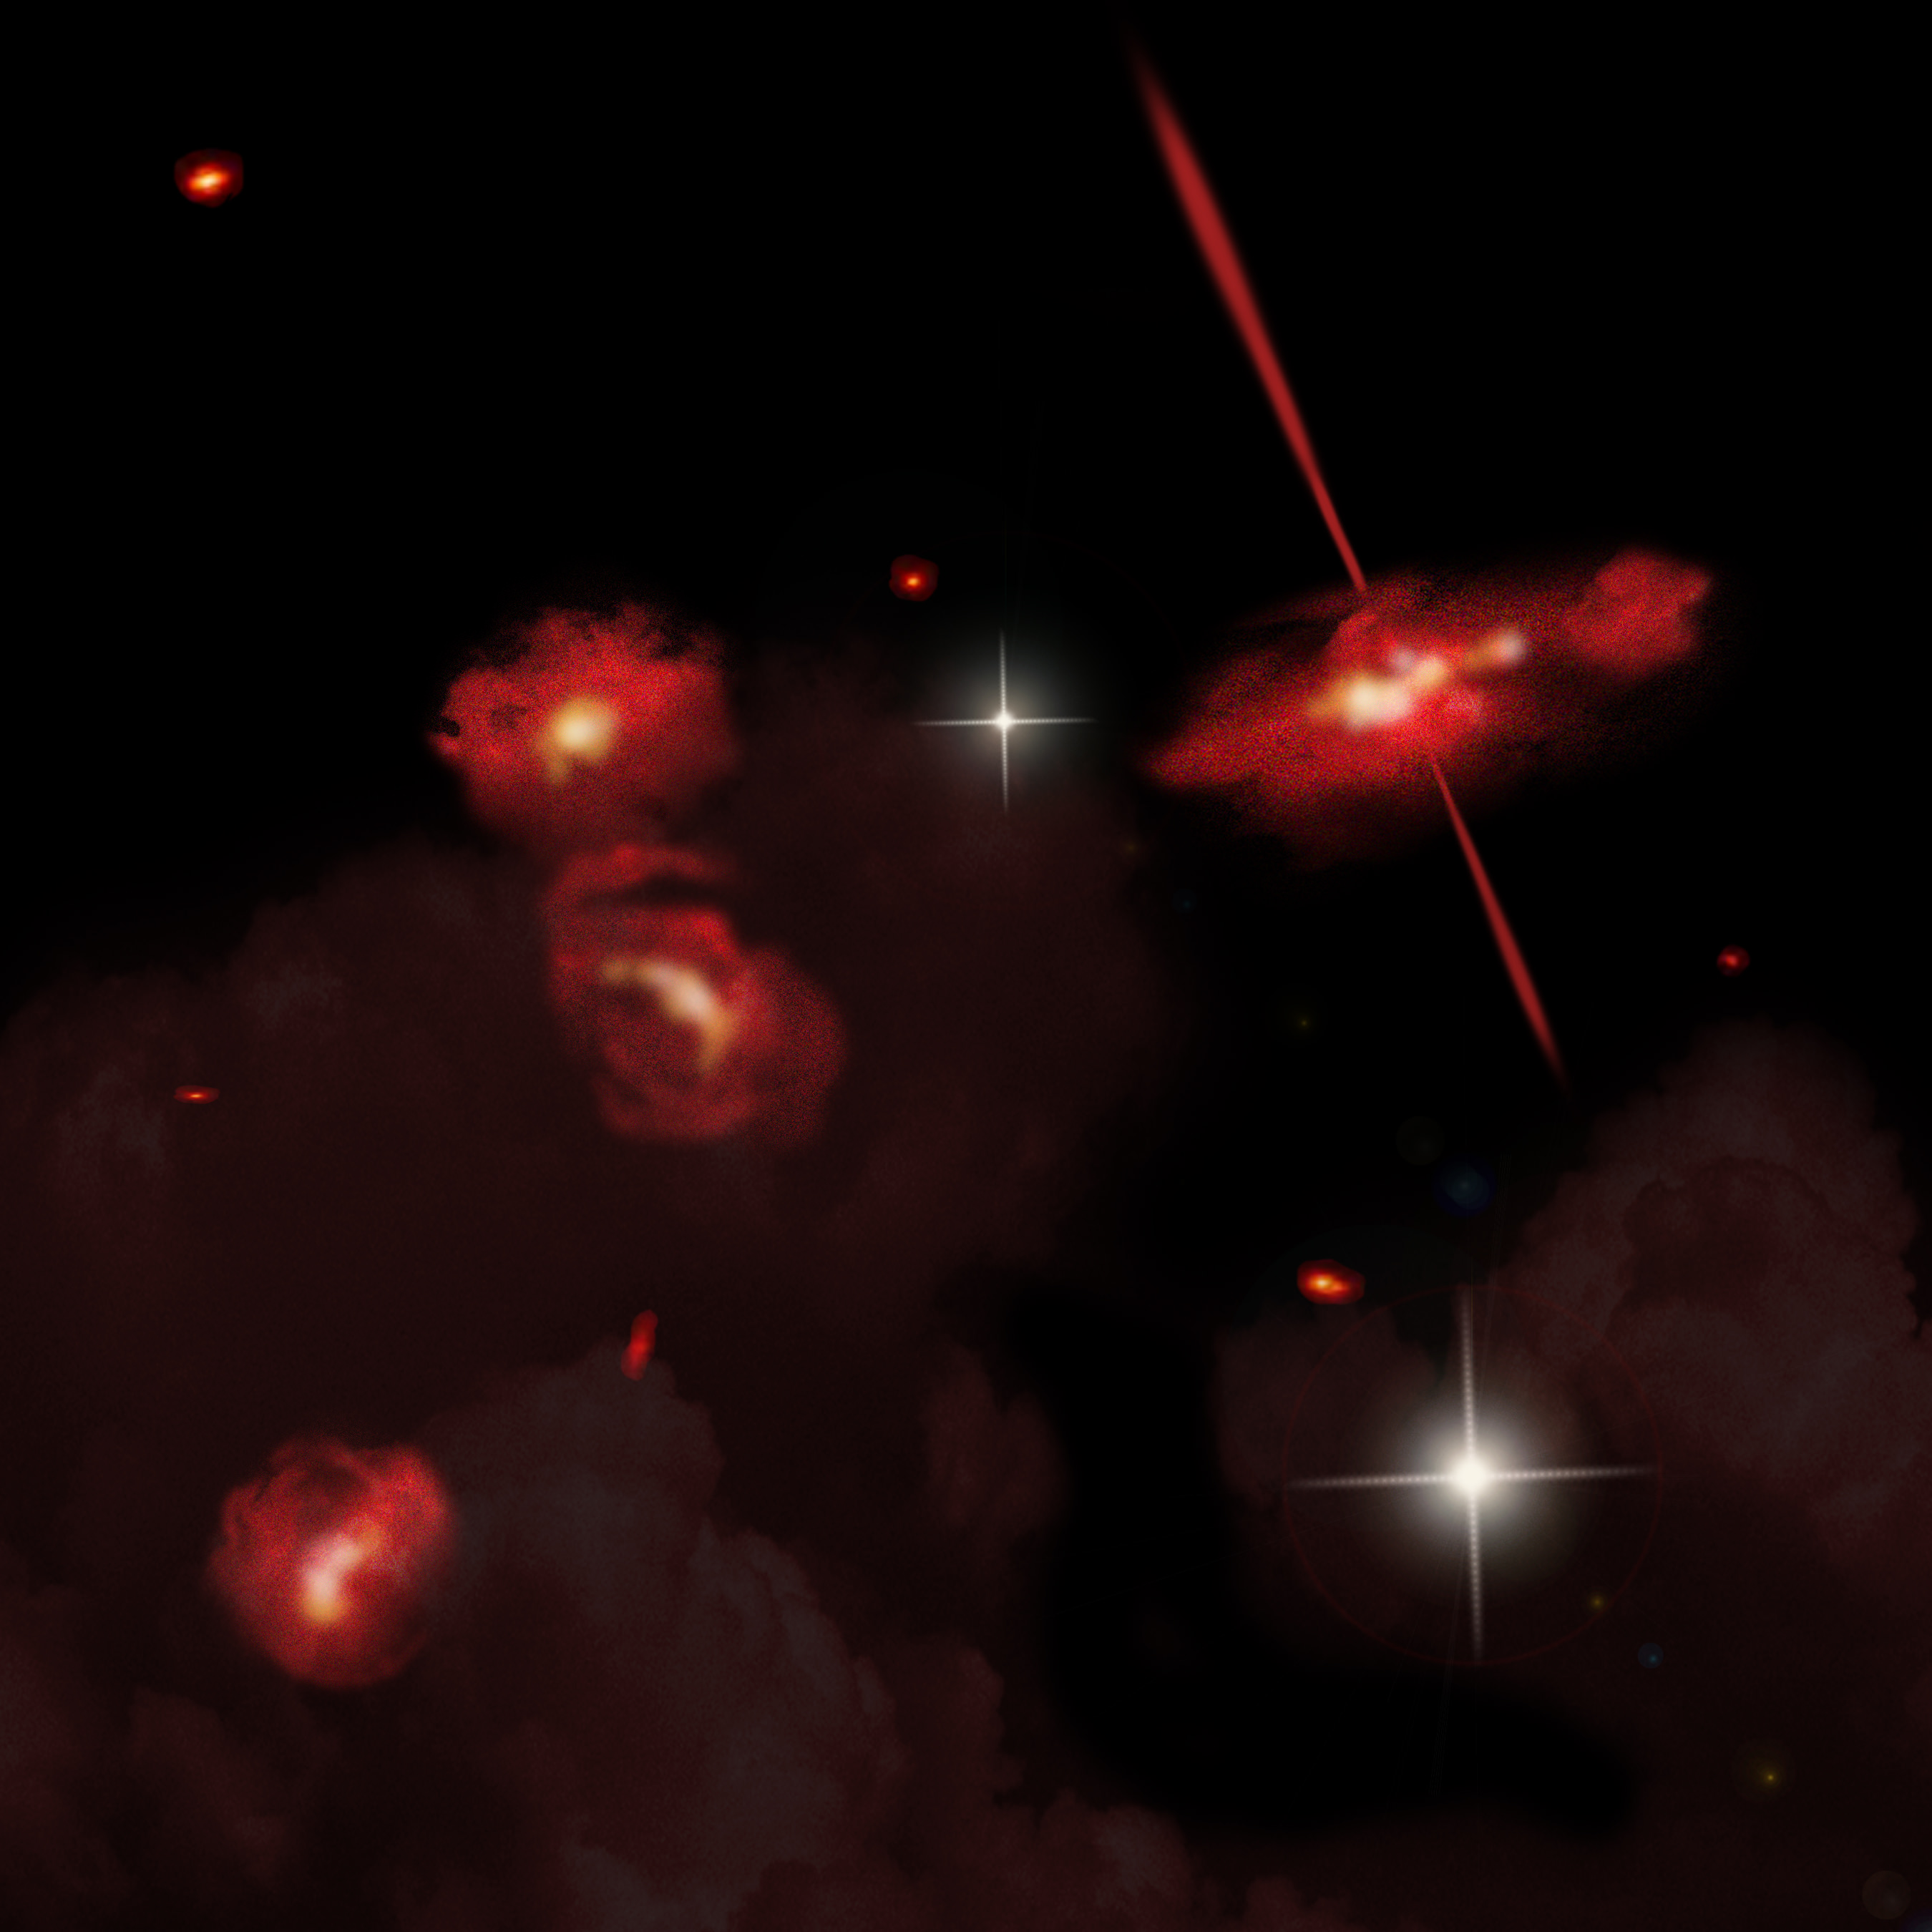
This artist's conception portrays four extremely red galaxies that lie almost 13 billion light-years from Earth. Discovered using the Spitzer Space Telescope, these galaxies appear to be physically associated and may be interacting. One galaxy shows signs of an active galactic nucleus, shown here as twin jets streaming out from a central black hole. Image Credit: David A. Aguilar (CfA)

[/caption]A team of astronomers, led by Jiasheng Huang (Harvard-Smithsonian Center for Astrophysics) using the Spitzer Space Telescope, have discovered four ‘Ultra-Red’ galaxies that formed when our Universe was about a billion years old. Huang and his team used several computer models in an attempt to understand why these galaxies appear so red, stating, “We’ve had to go to extremes to get the models to match our observations.”

The results of Huang’s research were recently published in The Astrophysical Journal

Using the Spitzer Space Telescope helped make the discovery possible, as it is more sensitive to infrared light than other space telescopes such as the Hubble. The newly discovered galaxies are sixty times brighter in the infrared than they are at the longest/reddest wavelengths HST can detect.

What processes are at work to create these extremely red objects, and why are they of interest to astronomers?

There are several reasons a galaxy could be reddened. For starters, extremely distant galaxies can have their light “redshifted” due to the expansion of the universe. If a galaxy contains large amounts of dust, it will also appear redder than a galaxy with less dust. Lastly, older galaxies will tend to be redder, due to a higher concentration of old, red stars and less younger bluer stars.

According to the paper, Huang and his team created three models to determine why these galaxies appear so red. Of their models, the one which suggests an old stellar population is currently the best fit to the observations. Supporting this conclusion, co-author Giovanni Fazio stated, “Hubble has shown us some of the first protogalaxies that formed, but nothing that looks like this. In a sense, these galaxies might be a ‘missing link’ in galactic evolution”.

Studying these extremely distant galaxies helps provide astronomers with a better understanding of the early universe, specifically how early galaxies formed and what conditions were present when some of the first stars were created. The next step in understanding these “ERO” galaxies is to obtain an accurate redshift for the galaxies, by using more powerful telescopes such as the Large Millimeter Telescope or Atacama Large Millimeter Array.

Huang and his team have plans to search for more galaxies similar to the four recently discovered by his team. Huang’s co-author Giovanni Fazio adds, “There’s evidence for others in other regions of the sky. We’ll analyze more Spitzer and Hubble observations to track them down.”

If you’d like to learn more, you can access the full paper (via arXiv.org) at: http://arxiv.org/pdf/1110.4129v1

Source: Harvard-Smithsonian Center for Astrophysics press release , arxiv.org

Telescope Review: Orion SkyQuest XT8 Classic Dobsonian Reflector

Orion XT8 Dobsonian reflector in front of the author's observatory. Photo Credit: Ray Sanders

[/caption]
Orion SkyQuest XT8 Classic Dobsonian Telescope, (MSRP $349.99) Orion Telescopes.

For many astronomers who are just getting started, dobsonian reflector telescopes are a popular choice. While many newcomers to Astronomy seek out computerized “go-to” telescopes, some prefer the “no-frills” setup a dobsonian telescope offers.

The Orion XT8 dobsonian is a mid-range reflector telescope. There are a few smaller and less expensive models available in Orion’s classic dobsonian series, and there are a few larger, more expensive models as well. The XT8 offers a good balance between portability, price and performance. In this review we’ll look at the build quality of the XT8, along with how it performs at planetary and “dark sky” objects.

For starters, let’s look at the raw specifications for the XT8. The XT8 features an 8″ (203mm) primary mirror. With a focal length of 1200mm, this gives a focal ratio of f/5.9. Advanced observers will enjoy the XT8’s 2″ focuser, which allows for larger eyepieces, or even a “T” adapter for short-exposure astrophotography. New observers (or those on a budget) will find the included 2″ to 1.25″ eyepiece adapter allows the use of 1.25″ eyepieces with no noticeable wiggle/slop.

The XT8 does come with a 25mm 1.25″ Plossl eyepiece which performs well as a medium-power eyepiece in the XT8. The XT8 features Orion’s EZ Finder II sight. While the EZ Finder II isn’t a terribly bad “red-dot” finder, some observers may see fit to replace the stock finder with something like a “correct image” finder scope, a laser pointer, or even a Telrad non-magnified finder.

Orion ships the XT8 in two boxes. One for the optical tube, and a second for the dobsonian mount base. The shipping box for the mount base was well thought out, minimizing potential damage to the base components. The shipping box for the optical tube was adequate, but as with any piece of delicate equipment – there can never be enough padding.

Assembling the XT8 took about half an hour by myself. With a helper, the XT8 could probably be assembled in ten minutes. Once assembled the mount base is quite sturdy and allowed for smooth rotation of the optical tube, due to the Teflon azimuth bearings. Adjusting the optical tube in altitude was equally effortless and the tension springs provided enough tension to maintain position (even pointed at the horizon) without making the tube difficult to raise or lower.

The mount base does include a carrying handle. At around 40lbs total weight, some users of the scope may prefer to carry the optical tube and base assemblies separately. Once assembled and put in place at an observing location, operation of the XT8 is fairly straight forward. Depending on what finder setup is used, aligning the finder may take just a few minutes, or slightly longer. Generally, using a very bright object (newcomers may want help with this step) in the finder makes the process of alignment easier and faster. When setting up the XT8 for this review, I aligned my Telrad finder and the telescope itself with Jupiter.

After aligning the finder, using the XT8 is simply a matter of moving the optical tube to whatever objects are desired. Once the telescope is pointed at an object, making focus and/or eyepiece adjustments are fairly trivial. The eyepiece holder features thumbscrews which do a good job of holding eyepieces in place. The focuser offers smooth operation with very little image “wobble”.

Putting the XT8 through a short observing session, I was able to obtain great views of the Moon, Jupiter, the Orion Nebula (M42), and the Andromeda Galaxy (M31). At the time of testing, the Moon was in a waning crescent phase and the XT8 brought out some great views of lunar craters near the terminator. Despite being close to the horizon, the view of lunar craters in the eyepiece were crisp and clear. Moving eastward to Jupiter revealed a delightful view of a few of Jupiter’s atmospheric bands, as well as the Galilean moons. While the view from an 8″ telescope can’t compare to the views of Jupiter from Voyager or the Hubble, the detail revealed is still quite impressive.

Saving the best for last, I pointed the XT8 at M42 (Orion Nebula) and M31 (Andromeda Galaxy). Star-hopping to M31 was fairly trivial, via Alpheratz (In Pegasus). I did switch from the stock 25mm to a lower power 40mm eyepiece, as M31 does tend to benefit from lower power eyepieces, at least visually. The view of M31 provided a fuzzy patch that clearly stood out from the background stars. Moving eastward to M42, the views were breathtaking for such a relatively small telescope. Significant detail (albeit without much color) of the gas and dust was visible, along with a bright trapezium.

In Summary, the Orion XT8 is a great mid-range telescope which balances price and performance quite well. Despite Orion classifying this telescope as an “Intermediate” telescope, the XT8 would be an excellent choice for a beginning astronomer, or even an experienced observer looking to add a new scope to their fleet.

Assembling the XT8 was a trivial task with the included wrenches, and after assembly the telescope felt very sturdy. At around 40lbs, most people will have little to no trouble carrying the XT8 from their car to their observing spot, or from the house to a spot in their backyard. The included 25mm eyepiece works well as a mid-range eyepiece, but some users may want to invest in additional eyepieces, or at the very least a 2X barlow lens.

Some users of the XT8 may choose to replace the stock finder with one of their own choosing, but the included red-dot sight is fairly adequate. With a scope as powerful as the XT8, those planning to regularly perform lunar observations may want to consider purchasing a lunar filter. Any users who choose to perform solar observations can easily obtain a glass filter lens for the XT8 at a cost of around $100.

Are Pulsars Giant Permanent Magnets?

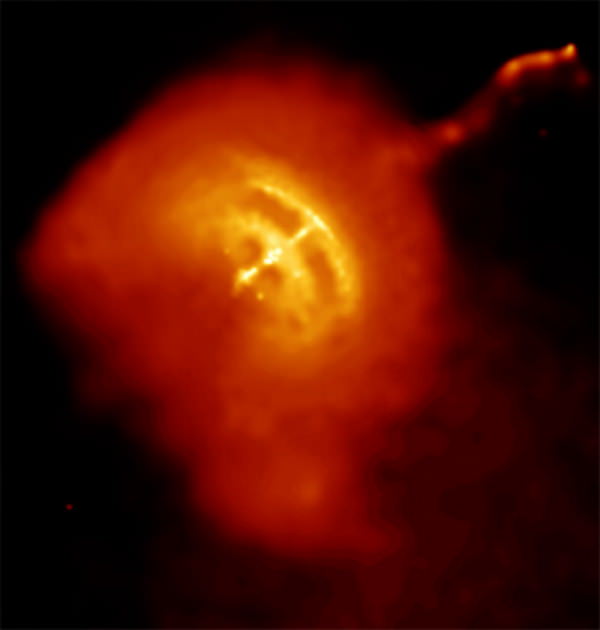
The Vela Pulsar, a neutron star corpse left from a titanic stellar supernova explosion, shoots through space powered by a jet emitted from one of the neutron star's rotational poles. Now a counter jet in front of the neutron star has been imaged by the Chandra X-ray observatory. The Chandra image above shows the Vela Pulsar as a bright white spot in the middle of the picture, surrounded by hot gas shown in yellow and orange. The counter jet can be seen wiggling from the hot gas in the upper right. Chandra has been studying this jet so long that it's been able to create a movie of the jet's motion. The jet moves through space like a firehose, wiggling to the left and right and up and down, but staying collimated: the "hose" around the stream is, in this case, composed of a tightly bound magnetic field. Image Credit:

[/caption]
Some of the most bizarre phenomena in the universe are neutron stars. Very few things in our universe can rival the density in these remnants of supernova explosions. Neutron stars emit intense radiation from their magnetic poles, and when a neutron star is aligned such that these “beams” of radiation point in Earth’s direction, we can detect the pulses, and refer to said neutron star as a pulsar.

What has been a mystery so far, is how exactly the magnetic fields of pulsars form and behave. Researchers had believed that the magnetic fields form from the rotation of charged particles, and as such should align with the rotational axis of the neutron star. Based on observational data, researchers know this is not the case.

Seeking to unravel this mystery, Johan Hansson and Anna Ponga (Lulea University of Technology, Sweden) have written a paper which outlines a new theory on how the magnetic fields of neutron stars form. Hansson and Ponga theorize that not only can the movement of charged particles form a magnetic field, but also the alignment of the magnetic fields of components that make up the neutron star – similar to the process of forming ferromagnets.

Getting into the physics of Hansson and Ponga’s paper, they suggest that when a neutron star forms, neutron magnetic moments become aligned. The alignment is thought to occur due to it being the lowest energy configuration of the nuclear forces. Basically, once the alignment occurs, the magnetic field of a neutron star is locked in place. This phenomenon essentially makes a neutron star into a giant permanent magnet, something Hansson and Ponga call a “neutromagnet”.

Similar to its smaller permanent magnet cousins, a neutromagnet would be extremely stable. The magnetic field of a neutromagnet is thought to align with the original magnetic field of the “parent” star, which appears to act as a catalyst. What is even more interesting is that the original magnetic field isn’t required to be in the same direction as the spin axis.

One more interesting fact is that with all neutron stars having nearly the same mass, Hansson and Ponga can calculate the strength of the magnetic fields the neutromagnets should generate. Based on their calculations, the strength is about 1012 Tesla’s – almost exactly the observed value detected around the most intense magnetic fields around neutron stars. The team’s calculations appear to solve several unsolved problems regarding pulsars.

Hansson and Ponga’s theory is simple to test – since they state the magnetic field strength of neutron stars cannot exceed 1012 Tesla’s. If a neutron star were to be discovered with a stronger magnetic field than 1012 Tesla’s, the team’s theory would be proven wrong.

Due to the Pauli exclusion principle possibly excluding neutrons aligning in the manner outlined in Hansson and Ponga’s paper, there are some questions regarding the team’s theory. Hansson and Ponga point to experiments that have been performed which suggest that nuclear spins can become ordered, like ferromagnets, stating: “One should remember that the nuclear physics at these extreme circumstances and densities is not known a priori, so several unexpected properties might apply,”

While Hansson and Ponga readily agree their theories are purely speculative, they feel their theory is worth pursuing in more detail.

If you’d like to learn more, you can read the full scientific paper by Hansson & Pong at: http://arxiv.org/pdf/1111.3434v1

Source: Pulsars: Cosmic Permanent ‘Neutromagnets’ (Hansson & Pong)

Was a Fifth Giant Planet Expelled from Our Solar System?

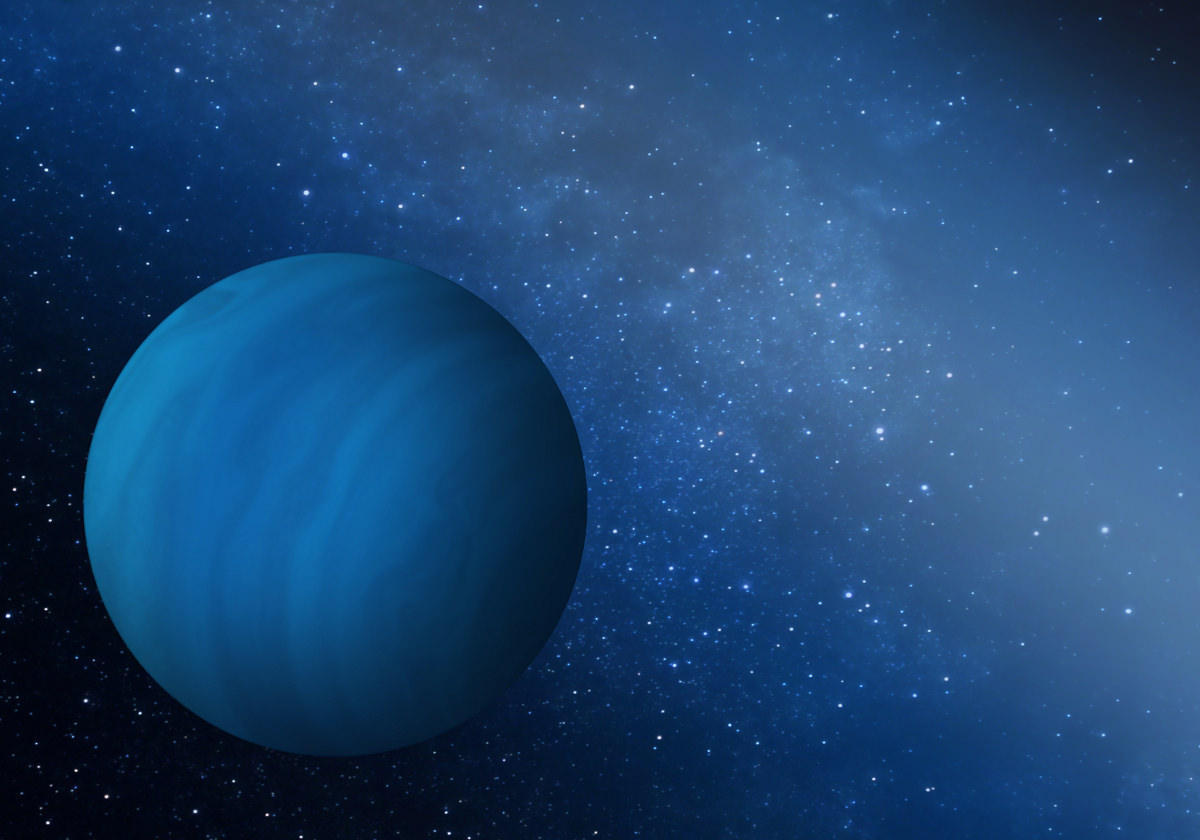
Artist’s impression of a fifth giant planet being ejected from the solar system. Image credit: Southwest Research Institute

[/caption]

Earth’s place in the “Goldilocks” zone of our solar system may be the result of the expulsion of a fifth giant planet from our solar system during its first 600 million years, according to a recent journal publication.

“We have all sorts of clues about the early evolution of the solar system,” said author Dr. David Nesvorny of the Southwest Research Institute. “They come from the analysis of the trans-Neptunian population of small bodies known as the Kuiper Belt, and from the lunar cratering record.”

Nesvorny and his team used the clues they had to build computer simulations of the early solar system and test their theories. What resulted was an early solar system model that has quite a different configuration than today, and a jumbling of planets that may have given Earth the “preferred” spot for life to evolve.


Researchers interpret the clues as evidence that the orbits of Jupiter, Saturn, Uranus and Neptune were affected by a dynamical instability when our solar system was only about half a billion years old. This instability is believed to have helped increase the distance between the giant planets, along with scattering smaller bodies. The scattering of small bodies pushed objects both inward, and outward with some objects ending up in the Kuiper Belt and others impacting the terrestrial planets and the Moon. Jupiter is believed to have scattered objects outward as it moved in towards the sun.

One problem with this interpretation is that slow changes to Jupiter’s orbit would most likely add too much momentum to the orbits of the terrestrial planets. The additional momentum would have possibly caused a collision of Earth with Venus or Mars.

“Colleagues suggested a clever way around this problem,” said Nesvorny. “They proposed that Jupiter’s orbit quickly changed when Jupiter scattered off of Uranus or Neptune during the dynamical instability in the outer solar system.”

Basically if Jupiter’s early migration “jumps,” the orbital coupling between the terrestrial planets and Jupiter is weaker, and less harmful to the inner solar system.

Animation showing the evolution of the planetary system from 20 million years before the ejection to 30 million years after. Five initial planets are shown by red circles, small bodies are in green.
After the fifth planet is ejected, the remaining four planets stabilize after a while, and looks like the outer solar system in the end, with giant planets at 5, 10, 20 and 30 astronomical units.
Click image to view animation. Image Credit: Southwest Research Institute

Nesvorny and his team performed thousands of computer simulations that attempted to model the early solar system in an effort to test the “jumping-Jupiter” theory. Nesvorny found that Jupiter did in fact jump due to gravitational interactions from Uranus or Neptune, but when Jupiter jumped, either Uranus or Neptune were expelled from the solar system. “Something was clearly wrong,” he said.

Based on his early results, Nesvorny added a fifth giant planet, similar to Uranus or Neptune to his simulations. Once he ran the reconfigured simulations, everything fell into place. The simulation showed the fifth planet ejected from the solar system by Jupiter, with four giant planets remaining, and the inner, terrestrial planets untouched.

Nesvorny concluded with, “The possibility that the solar system had more than four giant planets initially, and ejected some, appears to be conceivable in view of the recent discovery of a large number of free-floating planets in interstellar space, indicating the planet ejection process could be a common occurrence.”

If you’d like to read Nesvorny’s full paper, you can access it at: http://arxiv.org/pdf/1109.2949v1

Source: Southwest Research Institute Press Release

New ESA Images Reveal Volcanic History of Mars

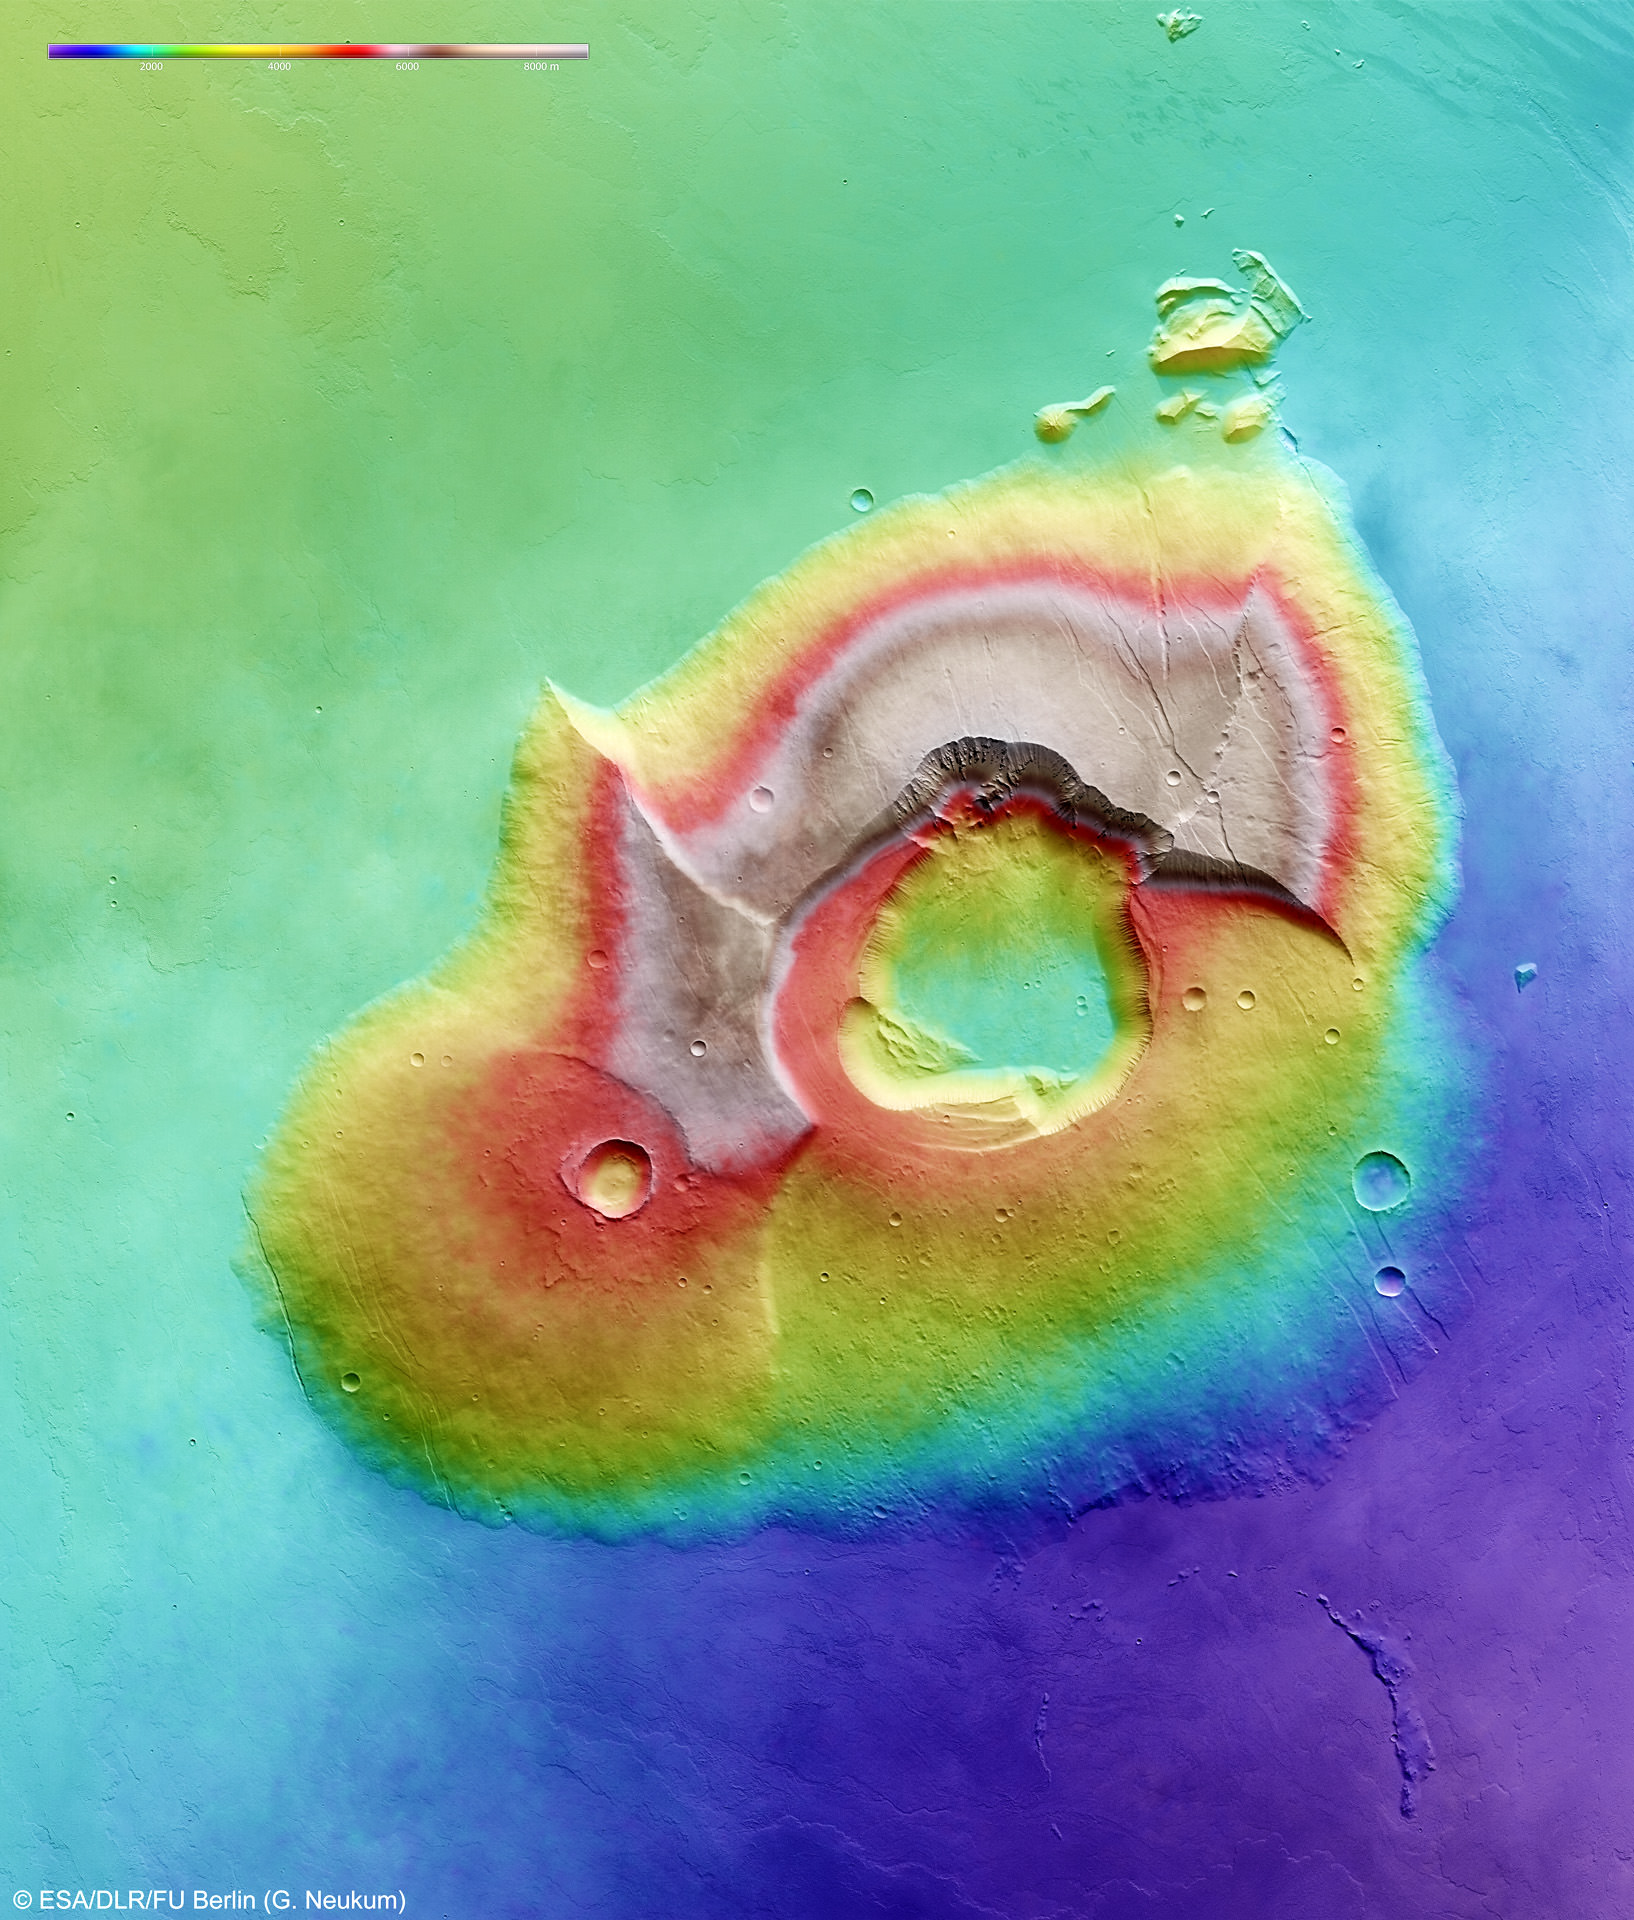
Tharsis Tholus towers 8 km above the surrounding terrain. Its base stretches 155 x 125 km. What makes Tharsis Tholus unusual is its extremely battered condition. Image Credit: ESA/DLR/FU Berlin (G. Neukum)

[/caption]

Earlier this week, The European Space Agency released new Mars images taken by instruments aboard the Mars Express spacecraft. The images show details of Tharsis Tholus, which appears to be a very large and extinct volcano that has been battered and deformed over time.

On Earth, Tharsis Tholus would be a towering giant of a volcano, looming 8 km above the surrounding terrain, with a base of roughly 155 x 125 km. Despite its size, Tharsis Tholus is just an average run-of-the-mill volcano on Mars. That being said, it isn’t the size of Tharsis Tholus that makes it interesting to scientists – what makes the remnants of this volcano stand out is its extremely battered condition.

What does the battered condition of Tharsis Tholus mean to planetary scientists studying Mars?

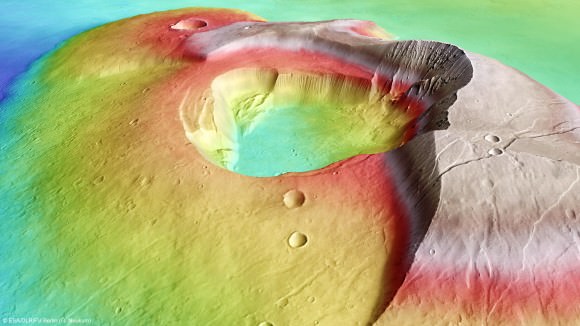
Details shown in the image above by the HRSC high-resolution stereo camera on ESA’s Mars Express spacecraft reveal signs of dramatic events which have significantly altered the volcanic region of Tharsis Tholus. Two (or more) large sections have collapsed around its eastern and western regions in the past several billion years, leaving signs of erosion and faulting.

One main feature of Tharsis Tholus that stands out is the volcanic caldera in its center. The caldera is nearly circular, roughly 30 km across and ringed by faults that have allowed the floor of the caldera to subside by nearly 3km. Planetary scientists believe the volcano emptied its magma chamber during eruptions. Once the magma chamber had emptied its lava onto the surface, the chamber roof became unstable under its own weight and collapsed, forming the large caldera.

This image was created using a Digital Terrain Model (DTM) obtained from the High Resolution Stereo Camera on ESA’s Mars Express spacecraft. Elevation data from the DTM is colour coded: purple indicates the lowest lying regions and beige the highest. Image Credit: ESA/DLR/FU Berlin (G. Neukum)

This month is a very busy month for Mars exploration. Russia’s recently launched (and in distress) Phobos mission (Mission coverage at: http://www.universetoday.com/90808/russians-race-against-time-to-save-ambitious-phobos-grunt-mars-probe-from-earthly-demise/) has a mission goal of returning a sample from Mars’ moon, Phobos, along with “piggyback” missions by China and the Planetary Society.

NASA’s plans to launch the Mars Science Laboratory on November 25th (Coverage at: http://www.universetoday.com/90639/curiosity-rover-bolted-to-atlas-rocket-in-search-of-martian-microbial-habitats/). MSL consists of the “Curiosity” rover and will be performing experiments designed to detect organic molecules, which may help detect signs of past or present life on Mars.

This month also marks the end of the “Mars500” mission, which ended on Friday (coverage at: http://www.universetoday.com/90554/mars500-crew-ready-to-open-hatch/ when the participants opened their hatch for the first time since June 2010. During the past 520 days, the participants were working in a simulated spacecraft environment in Moscow.

Learn more about Mars Express at: http://www.esa.int/esaMI/Mars_Express/index.html

Source: ESA Press Release

Absorption Lines Shed New Light on 90 Year Old Puzzle

Gemini North Observatory, Maunakea Hawaii. Image Credit: Gemini Observatory/AURA

[/caption]

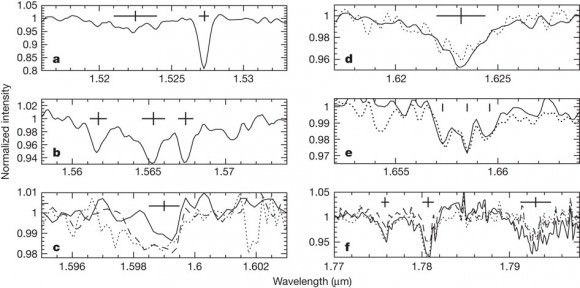
Using the Gemini North Telescope, astronomers studying the central region of the Milky Way have discovered 13 diffuse interstellar bands with the longest wavelengths to date. The team’s discovery could someday solve a 90-year-old mystery about the existence of these bands.

“These diffuse interstellar bands—or DIBs—have never been seen before,” says Donald Figer, director of the Center for Detectors at Rochester Institute of Technology and one of the authors of a study appearing in the journal Nature.

What phenomenon are responsible for these absorption lines, and what impact do they have on our studies of our galaxy?

Figer offers his explanation of absorption lines, stating, “Spectra of stars have absorption lines because gas and dust along the line of sight to the stars absorb some of the light.”

Figer adds, “The most recent ideas are that diffuse interstellar bands are relatively simple carbon bearing molecules, similar to amino acids. Maybe these are amino acid chains in space, which supports the theory that the seeds of life originated in space and rained down on planets.”

“Observations in different Galactic sight lines indicate that the material responsible for these DIBs ‘survives’ under different physical conditions of temperature and density,” adds team member Paco Najarro (Center of Astrobiology, Madrid).

The discovery of low energy absorption lines by Figer and his team helps to determine the nature of diffuse interstellar bands. Figer believes that any future models that predict which wavelengths the particles absorb will have to include the newly discovered lower energies, stating, “We saw the same absorption lines in the spectra of every star. If we look at the exact wavelength of the features, we can figure out the kind of gas and dust between us and the stars that is absorbing the light.”

Spectra of the newly discovered Diffuse Interstellar Bands (DIB's).
Image Credit: Geballe, Najarro, Figer, Schlegelmilch, and de la Fuente.

Since their discovery 90 years ago, diffuse interstellar bands have been a mystery. To date, the known bands that have been identified before the team’s study occur mostly in visible wavelengths. Part of the puzzle is that the observed lines don’t match the predicted lines of simple molecules and can’t be traced to a single source.

“None of the diffuse interstellar bands has been convincingly identified with a specific element or molecule, and indeed their identification, individually and collectively, is one of the greatest challenges in astronomical spectroscopy, recent studies have suggested that DIB carriers are large carbon-containing molecules.” states lead author Thomas Geballe (Gemini Observatory).

One other benefit the newly discovered infrared bands offer is that they can be used to better understand the diffuse interstellar medium, where thick dust and gas normally block observations in visible light. By studying the stronger emissions, scientists may gain a better understanding of their molecular origin. So far, no research teams have been able to re-create the interstellar bands in a laboratory setting, mostly due to the difficulty of reproducing temperatures and pressure conditions the gas would experience in space.

If you’d like to learn more about the Gemini Observatory, visit: http://www.gemini.edu/
Read more about RIT’s Center for Detectors at: http://ridl.cis.rit.edu/

Source: Rochester Institute of Technology Press Release

Are Black Holes Planet Smashers?

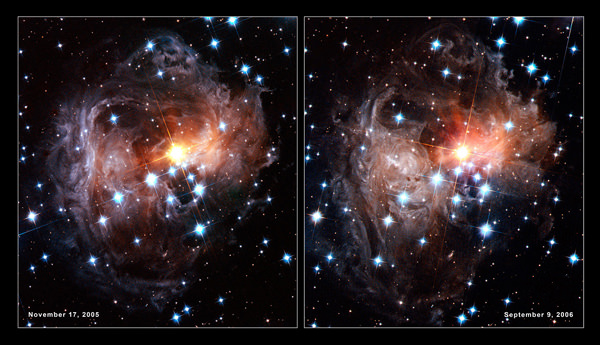
Light echo of dust illuminated by nearby star V838 Monocerotis as it became 600,000 times more luminous than our Sun in January 2002. Credit: NASA/ESA

[/caption]

Some supermassive black holes are obscured by oddly shaped dust clouds which resemble doughnuts. These clouds have been an unsolved puzzle, but last week a scientist at the University of Leicester proposed a new theory to explain the origins of these clouds, saying that they could be the results of high-speed collisions between planets and asteroids in the central region of galaxies, where the supermassive black holes reside.

While black holes are a death knell for any objects wandering too close, this may mean even planets in a region nearby a black hole are doomed — but not because they would be sucked in. The central regions of galaxies just may be mayhem for planets.

“Too bad for life on these planets, ” said Dr. Sergei Nayakshin, whose paper will be published in the Monthly Notices of the Royal Astronomical Society journal.

In the center of nearly all galaxies are supermassive black holes. Previous studies show that about half of supermassive black holes are obscured by dust clouds.

Nayakshin and his team found inspiration for their new theory from our Solar System, and based their theory on the zodiacal dust which is known to originate from collisions between solid bodies such as asteroids and comets.

The central point of Nayakshin’s theory is that not only are black holes present in the central region of a galaxy, but stars, planets and asteroids as well.

The team’s theory asserts that any collisions between planets and asteroids in the central region of a galaxy would occur at speeds of up to 1000 km/sec. Given the tremendous speeds and energy present in such collisions, eventually rocky objects would be pulverized into microscopic dust grains.

Nayakshin also mentioned that the central region of a galaxy is an extremely harsh environment, given high amounts of deadly radiation and frequent collisions, both of which would make any planets near a supermassive black hole inhospitable well before they were destroyed in any collisions.

While Nayakshin said the frequent collisions would be bad news for any life that may exist on the planets, he added, “On the other hand the dust created in this way blocks much of the harmful radiation from reaching the rest of the host galaxy. This in turn may make it easier for life to prosper elsewhere in the rest of the central region of the galaxy.”

Nayakshin believes that a greater understanding of the origins of the dust near black holes is important to better understand how black holes grow and affect their host galaxy, and concluded with, “We suspect that the supermassive black hole in our own Galaxy, the Milky Way, expelled most of the gas that would otherwise turn into more stars and planets. Understanding the origin of the dust in the inner regions of galaxies would take us one step closer to solving the mystery of the supermassive black holes.”

Source: University of Leicester Press Release

Are Pluto and Eris Twins?

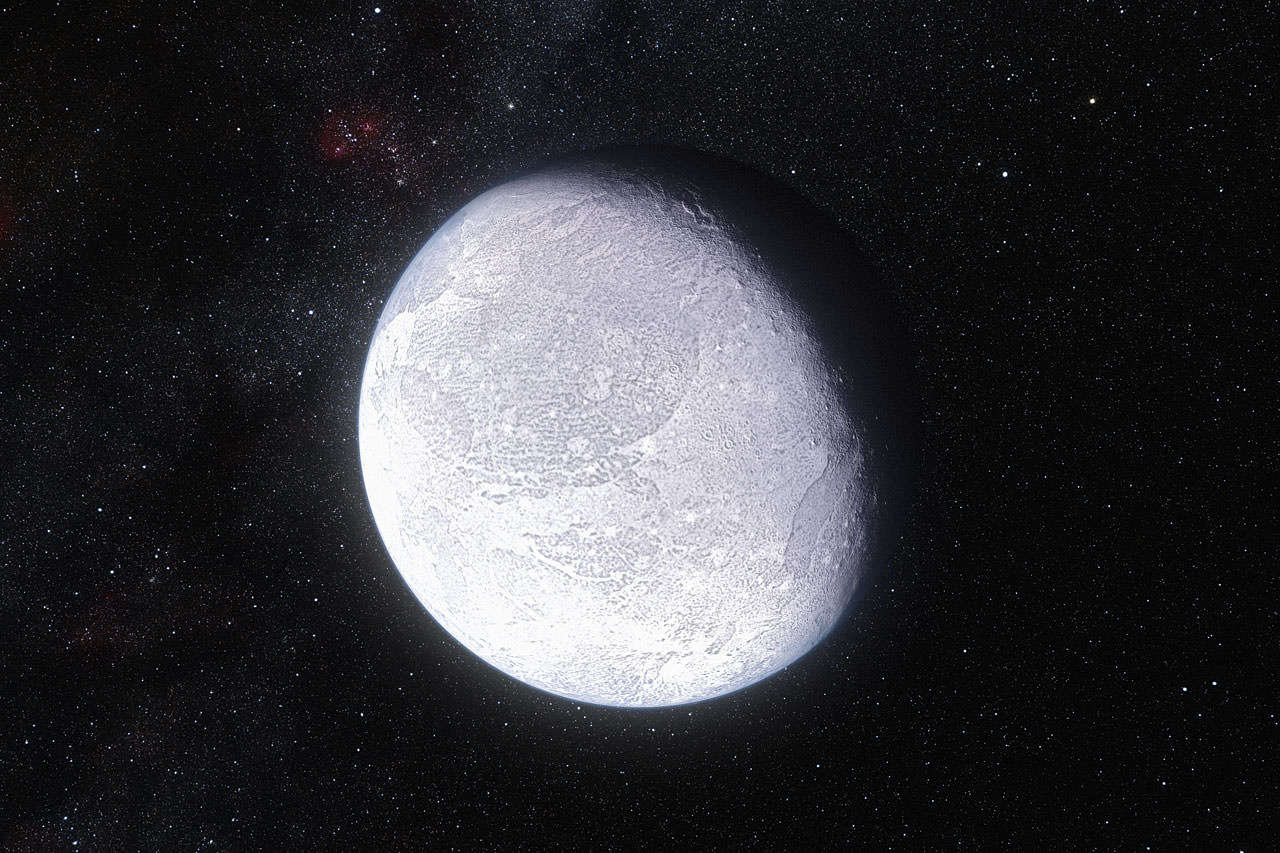
Artist's rendering of the distant dwarf planet Eris. New suggests that Eris is almost exactly the same diameter as Pluto. Eris is very reflective - possibly due to the frozen remains of its atmosphere. Image Credit: ESO/L. Calçada

[/caption]

Back a couple of weeks ago, I wrote an article highlighting the debate between scientists on which dwarf planet is bigger, Pluto or Eris. During a planetary science conference earlier this month in France, word “leaked” out that Eris was still more massive, but likely smaller in diameter.

Today, the latest findings were published in Nature, and as such are now “official”. There’s also some additional information, so I’d like to revisit this topic and include some new details which may help answer the question:

Could Eris and Pluto actually be twins?

Before we answer the pressing question, let’s revisit my prior post at: http://www.universetoday.com/89901/pluto-or-eris-which-is-bigger/.

Bruno Sicardy of the Paris Observatory and his team calculated the diameter of Eris in 2010. The technique they used took advantage of an occultation between Eris and a faint background star. Sicardy’s results provided a diameter of 2,326 kilometers for Eris, slightly less than his 2009 estimate of Pluto’s diameter at 2,338 kilometers.

Combining the diameter estimate with mass estimates yielded a density estimate for Eris which suggests, and is supported by its extra mass, that its composition is far more rocky than Pluto, with Eris being only 10-15% ice by mass.

In this week’s announcement by the European Southern Observatory, additional information was presented which sheds new light on cold, distant Eris.

Regarding the new density estimates, Emmanuel Jehin, one of Sicardy’s team members mentions, “This density means that Eris is probably a large rocky body covered in a relatively thin mantle of ice”.

Further supporting Jehin’s assertion, The surface of Eris was found to be extremely reflective, (96% of the light that falls on Eris is reflected, making it nearly as reflective as a backyard telescope mirror). Based on the current estimate, Eris is more reflective than freshly fallen snow on Earth. Based on spectral analysis of Eris, its surface reflectivity is most likely due to a surface of nitrogen-rich ice and frozen methane. Some estimates place the thickness of this layer at less than one millimeter.

Jehin also added, “This layer of ice could result from the dwarf planet’s nitrogen or methane atmosphere condensing as frost onto its surface as it moves away from the Sun in its elongated orbit and into an increasingly cold environment. The ice could then turn back to gas as Eris approaches its closest point to the Sun, at a distance of about 5.7 billion kilometers.”

Based on the new information on surface composition and surface reflectivity, Sicardy and his team were able to make temperature estimates for Eris. The team estimates daytime temperatures on Eris of -238 C, and that temperatures on the night side of Eris would be much lower.

Sicardy concluded with, “It is extraordinary how much we can find out about a small and distant object such as Eris by watching it pass in front of a faint star, using relatively small telescopes. Five years after the creation of the new class of dwarf planets, we are finally really getting to know one of its founding members.”

Source(s): ESO Press Release , Universe Today

Galaxy Zoo Reveals Curious ‘Violin Clef’ Quadruple Galaxy Merger

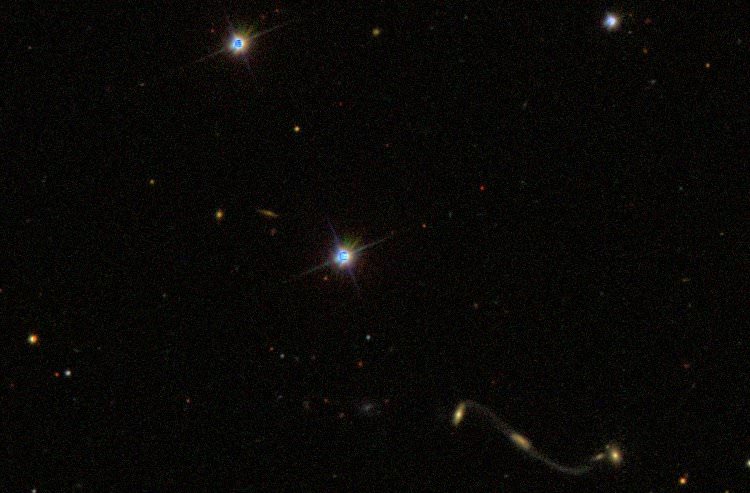
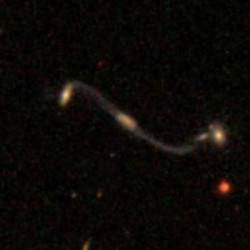
Shown at lower right is the "Violin Clef" galaxy merger. Click for larger image. Credit SDSS

[/caption]

About a month ago, a Galaxy Zoo contributor named Bruno discovered a very unique galaxy merger in the Sloan Digital Sky Survey data. The merger appeared to be a triple, or possibly quadruple system, which are indeed quite rare, and it includes curiously thin and long tidal tails. The Galaxy Zoo team has been informally referring to this merger as the “Violin Clef” or the “Integral” based on the unique shape as shown above.

What about this merger make it so interesting to scientists? What can they learn from these type of galaxy mergers?

Galaxy Zoo contributor Bruno had some insights on what makes the merger so interesting, stating: “These are some really beautiful tidal tails – They are extremely long and thin and appear curiously poor in terms of star formation, which is odd since mergers do tend to trigger star formation.” Bruno also added at the time of discovery: “There is no spectrum so we do not know the redshift of the object. It is also not clear if the objects at either end are associated or just a projection.”

(Note: Redshift is a term used to measure distance to distant objects. The higher the number, the older and more distant the object)

Based on Bruno’s curious discovery, the Galaxy Zoo team put in significant efforts to learn more about this merger. Galaxy Zoo team member Kyle Willett provided an update this week, highlighting several new insights, along with more information on this merger’s significance.

Close-Up view of Violin Clef galaxy merger. Image Credit: Sloan Digital Sky Survey
( http://www.sdss3.org )

One of the additional reasons the system is of scientific interest is that while merging galaxies are quite common in our universe, the merging process is fairly quick compared to the lifetime of a galaxy. What is not common is to observe a system with long tails and multiple companions, which gives researchers an opportunity to test their models of galaxy interaction against a system “caught in the act”.

Researchers are also interested in the content of galaxies and their tails – specifically the gas and stars. In most mergers, there is a compression of gas by gravity, which leads to a short burst of new star formation in the galaxies and their tails.

The resulting star formation results in young, hot stars which are typically blue. (Note: Younger/hotter stars are bluer, older/cooler stars are redder). What is odd about the Violin Clef merger is that all four galaxies and the tidal tails are red.

Willett stated “If that’s the case, then we want to estimate the current age of the system. Were the galaxies all red ellipticals to begin with, with very little gas that could form new stars?” Willett also added, “Or has the starburst already come and gone – and if so, how long-lived are these tidal tails going to be?”

By using analyzing the light given off by the merging galaxies, researchers can obtain a treasure trove of information. By measuring how much the spectra is redshifted, researchers can determine an accurate distance. In the case of the Violin Clef merger, an accurate redshift would let the team know for certain if all four galaxies genuinely belong to a single interacting group.

Once researchers have a distance estimate, they can study UV and radio flux data and determine an estimate of the total star formation rate. Additionally, if researchers have very accurate data from light received (spectroscopy), it’s possible to measure the relative velocities of each interacting galaxy, and build a sort of “3-D” picture of how the four galaxies are interacting.

Since there wasn’t any existing spectral analysis data of the merger system, Danielle Berg, a graduate student at the University of Minnesota, observed the Violin Clef in September using the 6.5-meter Multiple Mirror Telescope in Arizona and provided the additional data needed to answer some of the questions the Galaxy Zoo team had about the system.

Spectral analysis of the "Violin Clef" galaxy merger. Image Credit: Danielle Berg/University of Minnesota/Multiple Mirror Telescope

After the team analyzed the spectral data, they learned that all four galaxies are at the same redshift (z=0.0956 +- 0.002), and as such, are most likely members of the same group. Further analysis reinforced the lack of evidence for strong star formation, which helps to confirm the red colors see in the Sloan Digital Sky Survey data.

Based on these recent discoveries, the Galaxy Zoo team is putting out a second call for assistance on analyzing the Violin Clef merger. According to the team, the next step in the analysis will be working with simulations like the ones in Merger Zoo. Now that the team has confirmed the Violin Clef is almost certainly a quadruple merger, the number of merger models than need to be ran is greatly reduced.

How can citizen scientists help the Galaxy Zoo team with this step of their research?

You can start by visiting the Galaxy Zoo mergers project page at: http://mergers.galaxyzoo.org/

By participating in the Galaxy Zoo mergers project, you can identify simulations that resemble the Violin Clef. Your participation can also provide the Galaxy Zoo team with additional data which may enable them to have another scientific publication, plus these types of projects can be very fun and exciting to work with!

Learn more about becoming a Galaxy Zoo participant at: http://www.galaxyzoo.org/how_to_take_part

Source: Galaxy Zoo

Best-Ever Topographic Map of Earth from NASA and Japan

At 4.4 kilometers in elevation, California's Mt. Whitney is the highest point in the continental United States. Image credit: NASA/GSFC/METI/ERSDAC/JAROS, and U.S./Japan ASTER Science Team

[/caption]NASA and Japan recently announced a new and improved digital topographic map of Earth, which was produced with detailed measurements from NASA’s Terra spacecraft.

The new data covers over 99 percent of Earth’s landmass and spans from 83 degrees north latitude to 83 degrees south. Each elevation measurement point in the data is only 30 meters apart.

How were scientists able to improve on previous generations of detailed topographic maps?


The new model, known as a global digital elevation model, was created from images collected by the Japanese Advanced Spaceborne Thermal Emission and Reflection Radiometer, or ASTER, instrument aboard NASA’s Terra spacecraft. To create a “stereo pair” image,scientists can take two slightly offset images and combine them to create a three-dimensional effect of depth.

The previous version of the global digital elevation model was released in June of 2009 by NASA and Japan’s Ministry of Economy, Trade and Industry.

“The ASTER global digital elevation model was already the most complete, consistent global topographic map in the world,” said ASTER program scientist Woody Turner, “With these enhancements, its resolution is in many respects comparable to the U.S. data from NASA’s Shuttle Radar Topography Mission, while covering more of the globe.”

The ASTER team added 260,000 stereo-pair images to improve the previous model, which improved spatial resolution, increased horizontal and vertical accuracy, and provided the ability to identify lakes as small as 1 kilometer in diameter.

“This updated version of the ASTER global digital elevation model provides civilian users with the highest-resolution global topography data available,” said ASTER science team lead Mike Abrams. “These data can be used for a broad range of applications, from planning highways and protecting lands with cultural or environmental significance, to searching for natural resources.”

Arguably one of America's most magnificent national parks is the Grand Canyon in northern Arizona. Image credit: NASA/GSFC/METI/ERSDAC/JAROS, and U.S./Japan ASTER Science Team

Joining together in a collaborative effort, NASA and METI are contributing data for the ASTER topographic map to the Group on Earth Observations, for use in the group’s Global Earth Observation System of Systems. No, the previous statement wasn’t a typo – the “system of systems” is an international effort, which uses shared Earth observation data to help monitor and forecast global environmental changes.

One of five instruments launched on Terra in 1999, ASTER acquires images from visible to thermal infrared wavelengths, with spatial resolutions ranging from about 15 to 90 meters. ASTER’s science team is a joint effort between the United States and Japan.

The ASTER data was validated by NASA, METI, Japan’s Earth Remote Sensing Data Analysis Center (ERSDAC), and the U.S. Geological Survey, with additional support from the U.S. National Geospatial-Intelligence Agency and other collaborators. NASA’s Land Processes Distributed Active Archive Center is handling the distribution of the new ASTER global digital elevation model.

If you’d like to download the ASTER global digital elevation model to study at no cost, you can do so at: https://lpdaac.usgs.gov/ or http://www.ersdac.or.jp/GDEM/E/4.html

To learn more about ASTER, or NASA’s Terra mission, visit: http://asterweb.jpl.nasa.gov/ and http://www.nasa.gov/terra

Source: NASA/JPL Press Release