Christie’s to Auction off 1st Edition Works by Newton, Galileo

Cardinal Bellarmine had written in 1615 that the Copernican system could not be defended without "a true physical demonstration that the sun does not circle the earth but the earth circles the sun". Galileo considered his theory of the tides to provide the required physical proof of the motion of the earth. This theory was so important to him that he originally intended to entitle his Dialogue on the Two Chief World Systems the Dialogue on the Ebb and Flow of the Sea. For Galileo, the tides were caused by the sloshing back and forth of water in the seas as a point on the Earth's surface sped up and slowed down because of the Earth's rotation on its axis and revolution around the Sun. He circulated his first account of the tides in 1616, addressed to Cardinal Orsini. His theory gave the first insight into the importance of the shapes of ocean basins in the size and timing of tides; he correctly accounted, for instance, for the negligible tides halfway along the Adriatic Sea compared to those at the ends. As a general account of the cause of tides, however, his theory was a failure. If this theory were correct, there would be only one high tide per day. Galileo and his contemporaries were aware of this inadequacy because there are two daily high tides at Venice instead of one, about twelve hours apart. Galileo dismissed this anomaly as the result of several secondary causes including the shape of the sea, its depth, and other factors. Against the assertion that Galileo was deceptive in making these arguments, Albert Einstein expressed the opinion that Galileo developed his "fascinating arguments" and accepted them uncritically out of a desire for physical proof of the motion of the Earth. Galileo dismissed the idea, held by his contemporary Johannes Kepler, that the moon caused the tides. He also refused to accept Kepler's elliptical orbits of the planets, considering the circle the "perfect" shape for planetary orbits.Cardinal Bellarmine had written in 1615 that the Copernican system could not be defended without "a true physical demonstration that the sun does not circle the earth but the earth circles the sun". Galileo considered his theory of the tides to provide the required physical proof of the motion of the earth. This theory was so important to him that he originally intended to entitle his Dialogue on the Two Chief World Systems the Dialogue on the Ebb and Flow of the Sea. For Galileo, the tides were caused by the sloshing back and forth of water in the seas as a point on the Earth's surface sped up and slowed down because of the Earth's rotation on its axis and revolution around the Sun. He circulated his first account of the tides in 1616, addressed to Cardinal Orsini. His theory gave the first insight into the importance of the shapes of ocean basins in the size and timing of tides; he correctly accounted, for instance, for the negligible tides halfway along the Adriatic Sea compared to those at the ends. As a general account of the cause of tides, however, his theory was a failure. If this theory were correct, there would be only one high tide per day. Galileo and his contemporaries were aware of this inadequacy because there are two daily high tides at Venice instead of one, about twelve hours apart. Galileo dismissed this anomaly as the result of several secondary causes including the shape of the sea, its depth, and other factors. Against the assertion that Galileo was deceptive in making these arguments, Albert Einstein expressed the opinion that Galileo developed his "fascinating arguments" and accepted them uncritically out of a desire for physical proof of the motion of the Earth. Galileo dismissed the idea, held by his contemporary Johannes Kepler, that the moon caused the tides. He also refused to accept Kepler's elliptical orbits of the planets, considering the circle the "perfect" shape for planetary orbits.

[/caption]

It’s too bad that they missed Black Friday, but you’ll at least be able to get a few gifts for that astronomy enthusiast friend of yours for Christmas (or even for yourself!). The auction house Christie’s will be putting on the block 160 pieces from Edward Tufte’s rare book collection December 2nd in New York City.

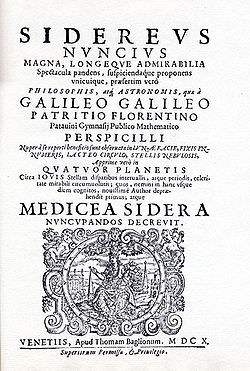
Among the works are original 1st edition copies of such books as Isaac Newton’s Opticks (1704), and Galileo Galilee’s Sidereus nuncius (1610) which is better known in English as The Starry Messenger. Galileo famously reported some of his early telescopic observations in this book, discovering the moons of Jupiter and craters and mountains on the Moon. There will also be a copy of René Descartes’ Principia philosophiae (1644) and various works by other famous astronomers, philosophers and scientists.

Edward Tufte is a Professor Emeritus of Political Science, Statistics, and Computer Science at Yale University. According to his bio on their site, “His research concerns statistical evidence and scientific visualization.” Looking through the Christie’s catalog, his interests in science history and visualization are well-represented, and the collection is quite impressive.

Of course, all of these items come at a price, rare and famous as they are. Would you expect anything less from such a notable auction house? Opticks is billed to sell for $30,000 – $40,000, Principia philosophiae for $6,000 – $8,000 and Siderius nuncius – the most expensive of the entire lot – is valued at between $600,000-$800,000 (all amounts in US Dollars). Here are a few other items for sale, accompanied by their expected fetching price:

– John Snow – On the Mode of Communication of Cholera (1849) $10,000 – $15,000 This is an important book that revolutionized our understanding of disease transmission. Steven Johnson’s book Ghost Map is based on this work, and is a fascinating read.

– Euclid – Elements $400 – $600 A 1589 copy of this important mathematical work that underlies our understanding of physics and math today. Euclid was born around 300 BC, and the oldest fragment of the Elements only dates to 100 AD.

– Thomas Hobbes – Leviathan, or The Matter, Forme, & Power of a Common-Wealth(1651). $15,000 – $20,000 A very influential work in the history of political philosophy and social contract theory. You may recognize this quote from chapter 12 of the book, “…and the life of man, solitary, poor, nasty, brutish and short.”

– Christiaan Huygens – Systema Saturnium (1659) $25,000 – $35,000 This is a digest of Huygens’ observations of the Saturnian system, and contains one of the first drawings of the Orion nebula.

– Edmund Halley – A description of the passage of the shadow of the moon, over England, in the total eclipse of the sun, on the 22nd day of April 1715 in the morning. (1715) $15,000 – $20,000 An illustrated broadside of Halley’s prediction of the shadow cast by the lunar eclipse on April 22nd, 1715. There are a few other works from Halley for sale as well.

I suggest sifting through the catalog – there are a lot of detailed photos and descriptions of the books for sale, many of them rare gems from the history of philosophy and astronomy and science.

Tufte is also selling a piece of his own artwork for $50,000 – $70,000 titled, Pioneer Space Plaque: A Cosmic Prank (2010). A digital print that uses animation electronics, it is a redesign – and parody – of the original plaques that still fly aboard the Pioneer 10 and 11 probes. For a picture, visit the auction page.

Source: Scientific American, Christie’s

An Apertif to the Next Radio Astronomy Entrée

A new detector at the Westerbork Synthesis Radio Telescope (WSRT) allows for a much wider view of the sky in the radio spectrum. In this image, the two pulsars are separated by over 3.5 degrees of arc in the sky. Image Credit: ASTRON

[/caption]

To aid in the digestion of a new era in radio astronomy, a new technique for improving the is unfolding at the Westerbork Synthesis Radio Telescope (WSRT) in the Netherlands. By adding a plate of detectors to the focal plane of just one of the 14 radio antennas at the WSRT, astronomers at the Netherlands Institute for Radio Astronomy (ASTRON) have been able to image two pulsars separated by over 3.5 degrees of arc, which is about 7 times the size of the full Moon as seen from Earth.

The new project – called Apertif – uses an array of detectors in the focal plane of the radio telescope. This ‘phased array feed’ – made of 121 separate detectors – increases the field of view of the radio telescope by over 30 times. In doing so, astronomers are able to see a larger portion of the sky in the radio spectrum. Why is this important? Well, in keeping with our food course analogy, imagine trying to eat a bowl of soup with a thimble – you can only get a small portion of the soup into your mouth at a time. Then imagine trying to eat it with a ladle.

This same analogy of surveying and observing the sky for radio sources holds true. Dr. Tom Oosterloo, the Principle Investigator of the Apertif project, explains the meat of the new technique:

“The phased array feed consists of 121 small antennas, closely packed together. This matrix covers about 1 square meter. Each WSRT will have such a antenna matrix in its focus. This matrix fully samples the radiation field in the focal plane. By combining the signals of all 121 elements, a ‘compound beams'[sic] can be formed which can be steered to be pointing at any location inside a region of 3×3 degrees on the sky. By combining the signals of all 121 elements, the response of the telescope can be optimised, i.e. all optical distortions can be removed (because the radiation field is fully measured). This process is done in parallel 37 times, i.e. 37 compound beams are formed. Each compound beam basically functions as a separate telescope. If we do this in all WSRT dishes, we have 37 WSRTs in parallel. By steering all the beams to different locations within the 3×3 degree region, we can observe this region entirely.”

In other words, traditional radio telescopes use only a single detector in the focal plane of the telescope (where all of the radiation is focused by the telescope). The new detectors are somewhat like the CCD chip in your camera, or those in use in modern optical telescopes like Hubble. Each separate detector in the array receives data, and by combining the data into a composite image a high-quality image can be captured.

The new array will also widen the field of view of the radio telescope, which allowed for this most recent observation of widely separated pulsars in the sky, a milestone test for the project. As an added bonus, the new detector will increase the efficiency of the “aperture” to around 75%, up from 55% with the traditional antennas.

Dr. Oosterloo explained, “The aperture efficiency is higher because we have much more control over the radiation field in the focal plane. With the classic single antenna systems (as in the old WSRT or as in the eVLA), one measures the radiation field in a single point only. By measuring the radiation field over the entire focal plane, and by cleverly combining the signals of all elements, optical distortion effects can be minimised and a larger fraction of the incoming radiation can be used to image the sky.”

This image illustrates the larger field of view afforded by the new instrument. Image Credit: ASTRON

For now, there is only one of the 14 radio antennas equipped with Apertif. Dr. Joeri Van Leeuwen, a researcher at ASTRON, said in an email interview that in 2011, 12 of the antennas will be outfitted with the new detector array.

Sky surveys have been a boon for astronomers in recent years. By taking enormous amounts of data and making it available to the scientific community, astronomers have been able to make many more discoveries than they would have been able to by applying for time on disparate instruments.

Though there are some sky surveys in the radio spectrum that have been completed so far – the VLA FIRST Survey being the most prominent – the field has a long way to go. Apertif is the first step in the direction of surveying the whole sky in the radio spectrum with great detail, and many discoveries are expected to be made by using the new technique.

Apertif is expected to discover over 1,000 pulsars, based on current modeling of the Galactic pulsar population. It will also be a useful tool in studying neutral hydrogen in the Universe on large scales.

Dr. Oosterloo et. al. wrote in a paper published on Arxiv in July, 2010, “One of the main scientific applications of wide-field radio telescopes operating at GHz frequencies is to observe large volumes of space in order to make an inventory of the neutral hydrogen in the Universe. With such information, the properties of the neutral hydrogen in galaxies as function of mass, type and environment can be studied in great detail, and, importantly, for the first time the evolution of these properties with redshift can be addressed.”

Adding the radio spectrum to the visible and infrared sky surveys would help to fine-tune current theories about the Universe, as well as make new discoveries. The more eyes on the sky we have in different spectra, the better.

Though Apertif is the first such detector in use, there are plans to update other radio telescopes with the technology. Dr. Oosterloo said of other such projects, “Phased array feeds are also being built by ASKAP, the Australia SKA Pathfinder. This is an instrument of similar characteristics as Apertif. It is our main competitor, although we also collaborate on many things. I am also aware of a prototype being tested at Arecibo currently. In Canada, DRAO [Dominion Radio Astrophysical Observatory] is doing work on phased array feed development. However, only Apertif and ASKAP will construct an actual radio telescope with working phased array feeds in the short term.”

On November 22nd and 23rd, a science coordination meeting was held about the Apertif project in Dwingeloo, Drenthe, Netherlands. Dr. Oosterloo said that the meeting was attended by 40 astronomers, from Europe, the US, Australia and South Africa to discuss the future of the project, and that there has been much interest in the potential of the technique.

Sources: ASTRON press release, Arxiv, email interview with Dr. Tom Oosterloo and Dr. Joeri Van Leeuwen

Longstanding Cepheid Mass Mystery Finally Solved

An artist's impression of the binary system OGLE-LMC-CEP0227, which contains a classical Cepheid variable star. By measuring this system, astronomers were able to settle a longstanding debate over the masses of these types of stars. Image credit: ESO/L. Calçada

[/caption]

Cepheid variable stars – a class of stars that vary in brightness over time – have long been used to help measure distances in our local region of the Universe. Since their discovery in 1784 by Edward Pigott, further refinements have been made about the relationship between the period of their variability and their luminosity, and Cepheids have been closely studied and monitored by professional and amateur astronomers.

But as predictable as their periodic pulsations have become, a key aspect of Cepheid variables has never been well-understood: their mass. Two different theories – stellar evolution and stellar pulsation – have given different answers as to the masses that these stars should be. What has long been needed to correct this error was a system of eclipsing binary stars that contained a Cepheid, so that the orbital calculations could yield the mass of the star to a high degree of accuracy. Such a system has finally been discovered, and the mass of the Cepheid it contains has been calculated to within 1%, effectively ending a discrepancy that has persisted since the 1960s.

The system, named OGLE-LMC-CEP0227, contains a classical Cepheid variable (as opposed to a Type II Cepheid, which is of lower mass and takes a different evolutionary track) that varies over 3.8 days. It is located in the Large Magellanic Cloud, and as the stars orbit each other over a period of 310 days, they eclipse each other from our perspective on Earth. It was detected as part of the Optical Gravitational Lensing Experiment, and you can see from the acronym soup that this yields the first part of the name, the Large Magellanic Cloud the second, and CEP stands for Cepheid.

A team of international astronomers headed by Grzegorz Pietrzynski of Universidad de Concepción, Chile and Obserwatorium Astronomiczne Uniwersytetu Warszawskiego, Poland measured the spectra of the system using the MIKE spectrograph at the 6.5-m Magellan Clay telescope at the Las Campanas Observatory in Chile and the HARPS spectrograph attached to the 3.6-m telescope of the European Southern Observatory at La Silla.

The team also measured the changes in brightness and slight red and blueshift of the light from the stars as they orbited each other, as well as the pulsing of the Cepheid. By taking all of these measurements, they were able to create a model of the masses of the stars that should yield the orbital mechanics of the system. In the end, the mass predicted by stellar pulsation theory agreed much more with the calculated mass than that predicted by stellar evolution theory. In other words, stellar pulsation theory FTW!!

They published their results today in a letter to Nature, and write in the conclusion of the letter: “The overestimation of Cepheid masses by stellar evolution theory may be the consequence of significant mass loss suffered by Cepheids during the pulsation phase of their lives – such loss could occur through radial motions and shocks in the atmosphere. The existence of mild internal core mixing in the main-sequence progenitor of the Cepheid, which would tend to decrease its evolutionary mass estimate, is another possible way to reconcile the evolutionary mass of Cepheids with their pulsation mass.”

Cepheid variables take their names from the star Delta Cephei (in the constellation Cepheus), which was discovered by John Goodricke to be a variable star a few months after Pigott’s discovery in 1784. There are many different types of variable stars, and if you are interested in learning more or even participating in observing and recording their variability, the American Association of Variable Star Observers has a wealth of information.

Source: ESO, original Nature letter

Researchers Discover 2nd Largest Impact Crater in Australia

The Cooper Basin hides an impact crater that was recently discovered by geothermal energy researchers. The crater may be the second largest discovered in Australia. Image Credit: Southern Australia Dept. of Transport, Energy and Infrastructure

[/caption]

Geothermal energy researchers from the University of Queensland in Australia have identified what may be the second largest meteorite impact crater in Australia. Dr. Tonguç Uysal of the University of Queensland and Dr. Andrew Glikson of Australian National University identified rock structures that appear to have formed because of the shock of a meteorite impact. Their discovery was made while doing geothermal energy research in the Cooper Basin, which lies on the border between Queensland and South Australia.

The meteorite that caused the impact was likely 8 to 12 km in diameter (5 to 7.5 miles), Dr. Glikson said in an interview. It is also possible that a cluster of smaller meteorites impacted the region, so further testing is needed to pin down the exact nature of the impactor. The impact likely occurred over 300 million years ago, and the shock of the impact altered rock in a zone 80 km (50 miles) in diameter.

Dr. Glikson said, “Dr Uysal is studying the geochemistry and isotopes of granites from the basement below the Cooper Basin and observed potential shock lamella in the quartz grains.” Distinctive features of a shock due to a violent event such as a volcanic eruption, meteorite impact or earthquake are preserved in the rock surrounding such an event. In the case of the Cooper Basin impact, “penetrative intracrystalline planar deformation features” – essentially microscopic lines oriented in the same direction – were discovered in quartz grains. Additionally, the magnetic orientation of some of the rocks is slightly altered, further evidence of an impact event.

The impact structure itself may extend 10,000 square kilometers ( 3,850 square miles) and 524 meters (1,700 feet) deep, though Dr. Glikson said that further studies of the area include, “Studies of the geophysical structure of the basement below the Cooper Basin aimed at defining the impact structure.”

There is significant interest in the Cooper Basin as a source of geothermal energy, and there are several oil and gas companies currently mining the region, which is an important on-shore repository of petroleum. The impact event is likely the reason why this region is such a hotspot for geothermal activity.

“Large impacts result in a hydrothermal cell (boiling of ground water) which effect redistribution and re-concentration of K [potassium], Th [thorium] and U [uranium] upwards in the crust, hence elevated generation of heat from crustal zones enriched in the radiogenic elements,” Dr. Glikson explained.

The recent discovery of this impact crater makes it the second largest in Australia, second only to the Woodleigh impact structure (120 km in diameter), which was produced by an asteroid 6 to 12 km (4 to 8 miles) across, about 360 million years ago.

Dr. Glikson and Dr. Uysal will be presenting their findings at the upcoming Australian Geothermal Energy Conference in Adelaide, which runs from the 16th – 19th of November. They also plan to have their results published in a peer-reviewed journal, Dr. Glikson said. You can read a preliminary abstract of their conference paper here.

Source: Queensland University press release, conference paper abstract, interview with Dr. Andrew Glikson

Another X-ray Nova Detected by ISS, Swift

The X-ray nova MAXI J1409-619, as observed by the MAXI instrument aboard the ISS. Image Credit: JAXA/RIKEN/MAXI team

[/caption]

A new X-ray emitting object in the Milky Way has been recently announced by the Monitor of All-sky X-ray Image (MAXI) team and the Swift satellite astronomers. MAXI, a Japan Aerospace Exploration Agency supported instrument, monitors the entire sky in the X-ray portion of the spectrum from its perch on the International Space Station module “Kibo”. On October 12th, MAXI noticed nothing out of the ordinary in a portion of the sky in the constellation Centaurus.

On October 17th, however, things started to brighten up in the region but were still dark enough that the team wanted to analyze their observations before announcing it to the world. By the 20th, they were able to confirm the X-ray source as something more unusual, and sent out an Astronomer’s Telegram (ATel No.2959) at 2:00 a.m. EDT alerting other astronomers to the object.

The Swift satellite – in keeping with its name – began taking observations a mere nine hours later. Swift is equipped with an X-ray telescope, as well as an optical/ultraviolet telescope, and is designed to maneuver quickly to home in on gamma-ray bursts (GRBs)

David Burrows, professor of astronomy and astrophysics at Penn State and the lead scientist for Swift’s X-ray Telescope said in a press release, “The Swift observation suggests that this source is probably a neutron star or a black hole with a massive companion star located at a distance of a few tens of thousands of light years from Earth in the Milky Way…The contribution of Swift’s X-ray Telescope to this discovery is that it can swing into position rapidly to focus on a particular point in the sky and it can image the sky with high sensitivity and high spatial resolution.”

The object has been named MAXI J1409-619. The area of the sky that it was discovered in is not a known source of bright X-rays, though there were two dimmer objects located in the same area detected by the BeppoSAX X-ray survey on January 29th, 2000. One of the objects is consistent with the Swift observation, though this most recent flare-up made it almost 52 times brighter in the X-ray than previously observed.

The X-ray nova as seen by the Swift satellite. The bright portion is 0.2 degrees in radius. Image Credit: MAXI/Swift team

X-ray novae are short-lived events, with an initial bright burst that falls off over a period of weeks or months. Their source is generally understood to be material falling into a black hole or accreting onto a neutron star.

This is not the first discovery made by the MAXI instrument. It detected another X-ray source on the 25th of September in the constellation Ophiuchus – named MAXI J1659-152 – which we wrote about here.

Further observations of the new object are likely in the works, so we’ll keep you posted.

Sources: Eurekalert, JAXA, ATel 2965, Penn State Press Release

Watch a Mars Rover Under Construction – LIVE!

If you are tired of the drama of your favorite reality TV show, it might be time to switch things up a bit. The most recent reality show, available ad free on the internet, features a spunky robot and a huge cast of characters. The spunky robot is Curiosity, the name of the Mars Science Laboratory rover. The characters are all wearing white clean room “bunny suits,” so it will be difficult to tell them apart. Surely, if you spend enough time watching you’ll be able to discern who’s who.

In all seriousness, you can watch the construction of Curiosity live via Ustream. The NASA/JPL team that is constructing the rover will be at work between 8 a.m. to 11:00 p.m. PDT Monday through Friday. Otherwise, things will be a little quiet. The camera looks out onto a pretty active part of the clean room, but they may move the rover outside of the view of the camera. Some of the busy periods will be archived at the bottom of the Ustream feed, so if you end up watching during a quiet period, take a look at those while you’re waiting for the next work period to start up.

For more on the rover and its mission, visit the mission page or see our story on Universe Today from September, “5 Things about the Next Mars Rover“.

Source: JPL

The Strange Warm Spot of upsilon Andromedae b

The warmest part of upsilon Andromedae b is not directly under the light coming from its host star, as would be expected. Image Credit: NASA/JPL-Caltech

[/caption]

If you set a big black rock outside in the Sun for a few hours, then go and touch it, you’d expect the warmest part of the rock to be that which was facing the Sun, right? Well, when it comes to exoplanets, your expectations will be defied. A new analysis of a well-studied exoplanetary system reveals that one of the planets – which is not a big black rock, but a Jupiter-like ball of gas – has its warmest part opposite that of its star.

The system of Upsilon Andromedae, which lies 44 light years away from the Earth in the constellation Andromeda, is a much studied system of planets that orbit around a star a little more massive and slightly hotter than our Sun.

The closest planet to the star, upsilon Andromeda b, was the first exoplanet to have its temperature taken by The Spitzer Space Telescope. As we reported back in 2006, upsilon Andromeda b was thought to be tidally locked to the star and show corresponding temperature changes at it went around its host star. That is, as it went behind the star from our perspective, the face was warmer than when it was in front of the star from our perspective. Simple enough, right? These original results were published in a paper in Science on October 27th, 2006, available here.

As it turns out, this temperature change scenario is not the case. UCLA Professor of Physics and Astronomy Brad Hansen, who is a co-author on both the 2006 paper and updated results, explains, “The original report was based on just a few hours of data, taken early in the mission, to see whether such a measurement was even possible (it is close to the limit of the expected performance of the instrument). Since the observations suggested it was possible to detect, we were awarded a larger amount of time to do it in more detail.”

Observations of upsilon Andromedae b were taken with the Spitzer again in February of 2009. Once the astronomers were able to study the planet more, they discovered something odd – just how warm the planet was when it passed in front of the star from our perspective was a lot warmer than when it passed behind, just the opposite of what one would expect, and opposite of the results they originally published. Here’s a link to an animation that helps explain this strange feature of the planet.

What the astronomers discovered – and have yet to explain fully – is that there is a “warm spot” about 80 degrees opposite of the face of the planet that is pointed towards the star. In other words, the warmest spot on the planet is not on the side of the planet that is receiving the most radiation from the star.

This in itself is not a novelty. Hansen said, “There are several exoplanets observed with warm spots, including some whose spots are shifted relative to the location facing the star (an example is the very well studied system HD189733b). The principal difference in this case is that the shift we observe is the largest known.”

Upsilon Andromedae b does not transit in front of its star from our vantage point on the Earth. Its orbit is inclined by about 30 degrees, so it appears to be passing “below” the star as it comes around the front. This means that astronomers cannot use the transit method of exoplanetary study to get a handle on its orbit, but rather measure the tug that the planet exerts on the star. It has been determined that upsilon Andromedae b orbits about every 4.6 days, has a mass 0.69 that of Jupiter and is about 1.3 Jupiter radii in diameter. To get a better idea of the whole system of upsilon Andromedae, see this story we ran earlier this year.

So what, exactly, could be causing this bizarrely placed warm spot on the planet? The paper authors suggest that equatorial winds – much like those on Jupiter – could be transferring heat around the planet.

A graph and visual representation of the hot spot as the planet orbits the star upsilon Andromedae. Image credit: NASA/JPL-Caltech/UCLA

Hansen explained, “At the sub-stellar point (the one closest to the star) the amount of radiation being absorbed from the star is highest, so the gas there is heated more. It will therefore have a tendency to flow away from the hot region towards cold regions. This, combined with rotation will give a “trade wind”-like structure to the gas flow on the planet… The big uncertainty is how that energy is eventually dissipated. The fact that we observe a hot spot at roughly 90 degrees suggests that this occurs somewhere near the “terminator” (the day/night edge). Somehow the winds are flowing around from the sub-stellar point and then dissipating as they approach the night side. We speculate that this may be from the formation of some kind of shock front.”

Hansen said that they are unsure just how large this warm spot is. “We have only a very crude measure of this, so we have modeled as basically two hemispheres – one hotter than the other. One could make the spot smaller and make it correspondingly hotter and you would get the same effect. So, one can trade off spot size versus temperature contrast while still matching the observations.”

The most recent paper, which is co-authored by members from the United States and the UK, will appear in the Astrophysical Journal. If you’d like to go outside and see the star upsilon Andromedae,here’s a star chart.

Source: JPL Press Release, Arxiv here and here , email interview with Professor Brad Hansen.

Hubble Sees Asteroid Collision in Slow-Motion

The collision between two asteroids in early 2009 produced a strange, X-shaped aftermath. Image Credit: NASA, ESA and D. Jewitt (UCLA)

[/caption]

Alas, the image above is not marking alien pirate treasure in space – for the first time, the aftermath of a collision between two asteroids has been imaged. Last January, an international team of astronomers saw the strange X-shaped object with the Hubble Space Telescope after ground-based observatories spotted evidence of an asteroid collision in the asteroid belt. The team has now used Hubble to do follow-up observations and uncovered a few surprises about the collision.

The collision produced an X shape, followed by a long comet-like tail. The astronomers, led by David Jewitt of the University of California in Los Angeles, were surprised to find that the collision did not happen as recently as they’d thought, but had actually occurred almost a year previous to the detection. It’s likely that the two asteroids smashed together sometime in February or March of 2009.

“When I saw the Hubbble image I knew it was something special,” said ESA astronomer Jessica Agarwal in a press release.

Named P/2010 A2, the object is located in the asteroid belt between Mars and Jupiter. Asteroid collisions are thought to be a commonplace occurrence, and are responsible for kicking up dust in our Solar System and other planetary systems. Just how much dust is produced, and how frequent the collisions happen is still a hazy topic, and the recent observation of P/2010 A2 should help astronomers to better model this phenomenon.

By figuring out how much dust is produced by the process of ‘collisional grinding’, astronomers could better model the dusty debris disks of other planetary systems, as well as our own.

The team monitored the slow-motion expansion of the leftovers of the colliding asteroids with the Hubble Space Telescope between January and May of 2010. They’ve determined that P/2010 A2 is about 120 meters (393 feet) wide, and the particles of dust that make up the tail following it are between 1 millimeter (0.04 inches) to 2.5 centimeters (1 inch) in diameter.

The collision producing the object P/2010 A2, as observed over the course of a few months by Hubble. Image Credit: NASA, ESA and D. Jewitt (UCLA)

The remnants of the collision suggest that a smaller asteroid – 3 to 5 meters (10-16 feet) wide – collided into a larger one at about 18,000 km per hour (11,000 miles per hour). This vaporized the smaller asteroid, and ejected material from the larger one.

Why is the object X-shaped? That mystery has yet to be determined. It is likely, according to the team, that the filaments produced by the collision suggest asymmetries in the colliding objects. Further observations of P/2010 A2 with the Hubble in 2011 will show just how the collision continues to change, allowing for a more precise model of how it started out.

The observed tail is caused by the same mechanism that produces cometary tails – radiation pressure from the Sun pushes the dust away from the nucleus of the object.

As to why we don’t have thousands of Hubble images to produce a whole alphabet of asteroid collisions shapes – “Catching colliding asteroids on camera is difficult because large impacts are rare, while small ones, such as the one that produced P/2010 A2, are exceedingly faint,” Jewitt said. The results of their observations will be published in the October 14th issue of the journal Nature.

Source: ESA Press Release

‘Secret’ X-37B Space Plane Disappears Again

Artist impression of the Boeing X-37B (USAF)

[/caption]

The game between the United States Air Force and amateur satellite trackers continues: the unmanned X-37B space plane – a classified project of the Air Force – has changed orbit once again, leaving those that monitor the flyovers of the space plane scrambling to locate it once again.

The X-37B was launched on April 22nd, 2010 on an Atlas V rocket from Cape Canaveral, Florida, and has been orbiting the Earth ever since. During the period between July 29th and August 14th of this year, the plane changed its orbit and forced the amateurs that monitor the satellite to find it again, and recalculate its orbital path. According to Spaceweather.com yesterday, the X-37B has once again changed its location. It did not pass over at the expected time on the nights of October 7th and October 9th.

Possibilities for this latest change in orbit include a simple maneuvering test or change in the current testing phase of the plane, or the potential that it is finally about to land. The gallium arsenide solar panels on the craft should allow it to stay in space for up to 270 days, but it has only been 173 days since the launch.

The X-37B is controlled remotely, and can automatically land. Once this flight is over, it will land at either the Vandenberg Air Force Base or the Edwards Air Force Base, both located in California.

Not much has been said about the the secret project by the Air Force. Started at NASA in 1999, the automated space plane was handed over to the Pentagon in 2004. This initial flight of the X-37B is billed as a test of the craft by the Air Force. Here’s its description according to the Air Force fact sheet:

“The X-37B Orbital Test Vehicle, or OTV, is a non-operational system that will demonstrate a reliable, reusable, unmanned space test platform for the U.S. Air Force. The objectives of the OTV program include space experimentation, risk reduction and a concept of operations development for reusable space vehicle technologies.”

Of course, there has been much speculation about whether this constitutes the “weaponization of space”, since it is, after all, a project of the Air Force instead of NASA. To put your mind at ease, here’s a link to an analysis of potential uses of the X-37B by former Air Force officer Brian Wheeden, who is now a Technical Adviser to the Secure World Foundation. He places the likelihood that the space plane could be used as a weapon at zero, but its capabilities as an orbital spy platform are feasible.

If you want a comprehensive look into the history and the possible uses of the X-37B, there is a lengthy article over at Air & Space by associate editor Michael Klesius.

There’s also a video up on Space.com by satellite tracker Kevin Fetter of Brockville, Ontario showing a flyover of the plane.

We’ll keep you posted as to when the X-37B is recovered by amateurs, if it has landed, or in the unlikely event that the Air Force decides to release any information about its current mission.

Source: Spaceweather.com

Comet Hartley 2 Scouted by WISE, Hubble for Upcoming Encounter

This image of Hartley 2 - Deep Impact's next cometary target - was taken on Sept. 25th by the Hubble Space Telescope. Image Credit: NASA, ESA, H. Weaver (The Johns Hopkins University/Applied Physics Lab)

[/caption]

In a little less than a month, NASA’s Deep Impact spacecraft (its current mission is called EPOXI) will fly by the comet Hartley 2 to image the comet’s nucleus and take other measurements. In preparation for this event, both the Wide-field Infrared Survey Explorer (WISE) and the Hubble Space Telescope have imaged the comet, scouting out the destination for Deep Impact.

On November 4th of this year, Deep Impact will come within 435 miles (700 km) of the comet Hartley 2, close enough to take images of the comet’s nucleus.

The name of the mission is EPOXI, which is a combination of the names for the two separate missions the spacecraft has been most recently tasked with: the extrasolar planet observations, called Extrasolar Planet Observations and Characterization (EPOCh), and the flyby of comet Hartley 2, called the Deep Impact Extended Investigation (DIXI). The spacecraft itself is still referred to as Deep Impact, though, despite the changes and extensions of its mission.

NASA’s Deep Impact mission to slam a copper weight into comet Tempel 1 was a wonderful success, sending back data that greatly improved our understanding of the composition of comets. After the encounter, though, there was still a lot of life left in the spacecraft, so it was tasked with another cometary confrontation: take images of the comet Hartley 2.

Deep Impact is an example of NASA using a single spacecraft to perform multiple, disparate missions. In addition to impacting and imaging Tempel 1 and performing a flyby of Hartley 2, the spacecraft took observations of 5 different stars outside of our Solar System during the period between January and August of 2008 (8 were scheduled, but some observations were missed due to technical difficulties).

It looked at stars with known exoplanets to observe transits of those planets in front of the star, giving astronomers a better idea of the orbital period, albedo – or reflectivity – and size of the planets.

Click here for a list of the various stars and transits it observed, as listed on the mission page.

Deep Impact also took data on both the Earth and Mars as they passed in front of our own Sun, to help characterize what exoplanets with a similar size and composition the Earth and Mars would look like passing in front of a star.

NASA's WISE infrared observatory took this image of Hartley 2, showing the extent of its tail, on May 10th, 2010. Image Credit: NASA/JPL-Caltech/UCLA

As of September 29th, Deep Impact was about 23 million miles (37 million km) away from Hartley 2. It is approaching at roughly 607,000 miles a day (976,000 km), so that puts it at about 18 million miles (29 million km) away from the comet today. As it approaches, Deep Impact will speed up, to over 620,000 miles (1,000,000 km) per day.

The path of Comet Hartley 2. Image courtesy Sky & Telescope.

You won’t have to depend on NASA’s observatories and the spacecraft to see a view of Hartley 2, though – you should be able to see it with the naked eye or binoculars near the constellation Perseus throughout the month of October. On October 20th, it will make its closest approach to Earth at a distance of 11 million miles (17.7 million km). The comet is officially designated 103P Hartley, and for viewing information you can go to Heavens Above.

As always, check this space regularly for updates on the upcoming flyby.

Sources: JPL here, here and here, Hubblesite, Heavens Above