Globular Clusters Like to Be Near the Center of the Action

Globular Clusters. Credit: NASA, ESA, and E. Peng

[/caption]

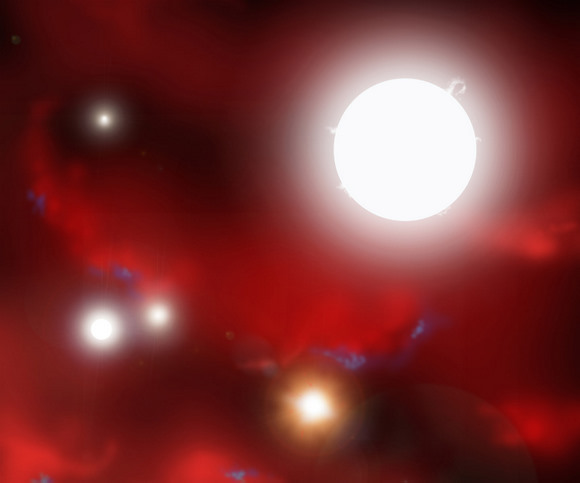
Globular clusters are gravitationally bound, dense concentrations of stars. There can be hundreds of thousands of stars in a cluster, and they are so close together that it’s hard to distinguish globular clusters outside of our galaxy from stars within our own galaxy just using ground-based telescopes: in other words, these big bunches of far away stars can look like a single, nearby star. But astronomers recently used the Hubble Space Telescope’s sharp eyes to identify, incredibly, over 11,000 globular clusters in the Virgo cluster of galaxies. And in doing so, they also noticed something interesting about where the globulars are located. Globular clusters don’t seem to form uniformly from galaxy to galaxy; instead they like to be where the action is near the center of galaxy clusters. The globulars are also more prevalent in dwarf galaxies near the center of the cluster of galaxies.

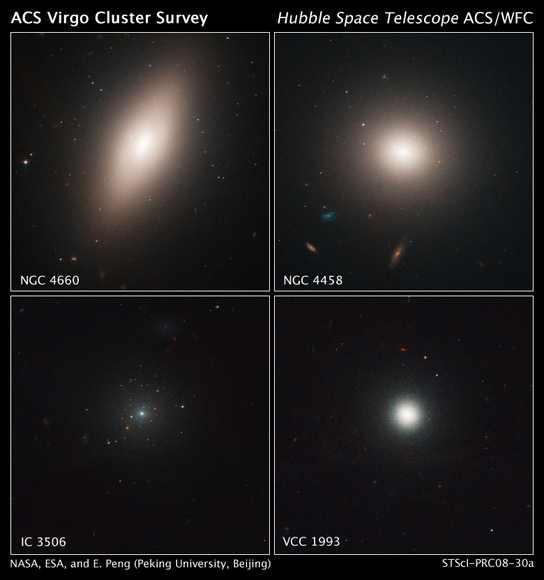
Hubble’s Advanced Camera for Surveys resolved the star clusters in 100 galaxies of various sizes, shapes, and brightnesses, even in faint, dwarf galaxies. Comprised of over 2,000 galaxies, the Virgo cluster is the nearest large galaxy cluster to Earth, located about 54 million light-years away.
Astronomers have long known that the giant elliptical galaxy at the cluster’s center, M87, hosts a larger-than-predicted population of globular star clusters. The origin of so many globulars has been a long-standing mystery.

“Our study shows that the efficiency of star cluster formation depends on the environment,” said Patrick Cote of the Herzberg Institute of Astrophysics in Victoria, British Columbia. “Dwarf galaxies closest to Virgo’s crowded center contained more globular clusters than those farther away.”

M87 and Surrounding Galaxies in the Virgo Cluster.  Credit: R. Gendler
M87 and Surrounding Galaxies in the Virgo Cluster. Credit: R. Gendler

The team found a bounty of globular clusters in most dwarf galaxies within 3 million light-years of the cluster’s center, where the giant elliptical galaxy M87 resides. The number of globulars in these dwarfs ranged from a few dozen to several dozen, but these numbers were surprisingly high for the low masses of the galaxies they inhabited. By contrast, dwarfs in the outskirts of the cluster had fewer globulars. Many of M87’s star clusters may have been snatched from smaller galaxies that ventured too close to it.

“We found few or no globular clusters in galaxies within 130,000 light-years from M87, suggesting the giant galaxy stripped the smaller ones of their star clusters,” explained Eric Peng of Peking University in Beijing, China, and lead author of the Hubble study. “These smaller galaxies are contributing to the buildup of M87.”

Hubble’s “eye” is so sharp that it was able to pick out the fuzzy globular clusters from stars in our galaxy and from faraway galaxies in the background. “With Hubble we were able to identify and study about 90 percent of the globular clusters in all our observed fields,” Peng said. “This was crucial for dwarf galaxies that have only a handful of star clusters.”

Evidence of M87’s galactic cannibalism comes from an analysis of the globular clusters’ composition. “In M87 there are three times as many globulars deficient in heavy elements, such as iron, than globulars rich in those elements,” Peng said. “This suggests that many of these ‘metal-poor’ star clusters may have been stolen from nearby dwarf galaxies, which also contain globulars deficient in heavy elements.”

Studying globular star clusters is critical to understanding the early, intense star-forming episodes that mark galaxy formation. They are known to reside in all but the faintest of galaxies.

“Star formation near the core of Virgo is very intense and occurs in a small volume over a short amount of time,” Peng noted. “It may be more rapid and more efficient than star formation in the outskirts. The high star-formation rate may be driven by the gravitational collapse of dark matter, an invisible form of matter, which is denser and collapses sooner near the cluster’s center. M87 sits at the center of a large concentration of dark matter, and all of these globulars near the center probably formed early in the history of the Virgo cluster.”

The fewer number of globular clusters in dwarf galaxies farther away from the center may be due to the masses of the star clusters that formed, Peng said. “Star formation farther away from the central region was not as robust, which may have produced only less massive star clusters that dissipated over time,” he explained.

Original News Source: HubbleSite Press Release

Conflicting Results from Phoenix Science Instruments Prompts Further Study

Soil in Mars Arctic Region. Credit: NASA/JPL/Caltech/ U of Arizona

[/caption]
Scientists from the Phoenix lander are analyzing conflicting results from soil samples delivered to two science instruments on the Mars lander. Two different samples analyzed by the spacecraft’s Wet Chemistry Lab both suggested one of the soil constituents may be perchlorate, a highly oxidizing substance that is considered toxic. But results from the TEGA instrument, (Thermal and Evolved-Gas Analyzer) downloaded from the lander over the weekend indicated no evidence of perchlorate. These findings may may have prompted the reports of “provocative” science results recently. Today, Phoenix officials said any reports of the spacecraft finding life were unfounded, and over the weekend, the Phoenix spacecraft itself said, via Twitter, that reports of White House briefings were not true. NASA will hold a media teleconference on Tuesday, Aug. 5, at 2 p.m. EDT, to discuss the recent science activities. A press release from the Phoenix team today said, “Confirmation of the presence of perchlorate and supporting data is important prior to scientific peer review and subsequent public announcements.”

Scientists said that while the conflicting results are unexpected, they are working hard to understand the soil chemistry and mineralogy in the Mars northern arctic region.

“This is surprising since an earlier TEGA measurement of surface materials was consistent with but not conclusive of the presence of perchlorate,” said Peter Smith, Phoenix’s principal investigator at the University of Arizona, Tucson. “We are committed to following a rigorous scientific process. While we have not completed our process on these soil samples, we have very interesting intermediate results,” said Smith, “Initial MECA analyses suggested Earth-like soil. Further analysis has revealed un-Earthlike aspects of the soil chemistry.”

The team also is working to totally exonerate any possibility of the perchlorate readings being influenced by terrestrial sources which may have migrated from the spacecraft, either into samples or into the instrumentation. One type of perchlorate, ammonium perchlorate, is sometimes used as an oxidizer in rocket fuel.

“When surprising results are found, we want to review and assure our extensive pre-launch contamination control processes covered this potential,” said Barry Goldstein, Phoenix project manager at NASA’s Jet Propulsion Laboratory.

An article on AviationWeek.com reported August 1 that the US president had been briefed on findings from Phoenix, and NASA would be ready to reveal the findings in mid-August. An article on Universe Today was based on that report. Today, Aviation Week & Space Technology stands by its report, saying that “the new information involves the “potential for life” on Mars. That potential can either be positive or negative, and the new data indicate the new soil tests are at best inconclusive, according to the information being released on the soil chemistry experiment.”

Phoenix’s Wet Chemistry Lab is part of the Microscopy, Electrochemistry, and Conductivity Analyzer, or MECA instrument which studies soluble chemicals in the soil by mixing a soil sample with a water-based solution with several reagents brought from Earth. The inner surface of each cell’s beaker has 26 sensors that give information about the acidity or alkalinity and concentrations of elements such as chloride or perchlorate. The beaker also can detect concentrations of magnesium, calcium and potassium, which form salts that are soluble in water.

The TEGA instrument has tiny ovens that heat soil samples, and analyzers that “sniff” vapors released from substances in a sample.

Original News Source: Phoenix News

50 Years of NASA

Fifty years ago this week NASA was born. On July 29, 1958, President Dwight D. Eisenhower signed into law the “National Aeronautics and Space Act of 1958.” NASA replaced NACA, the National Advisory Committee for Aeronautics, to meet the challenge of exploring beyond Earth, and in particular, to send a human into space. NASA has accomplished a lot during the last 50 years, and now its time to celebrate. To commemorate the anniversary, NASA has developed an interactive multimedia website that provides a historic tour of its first five decades of exploration. It’s a fun and interesting site that offers lots of history and a little look at the future, too. The site combines historic and current video with entertaining computer animation, and the virtual exhibit takes a World’s Fair approach to NASA history, with pavilions that host each decade of NASA’s achievements and challenges.

Begin your personal tour here….

“We’re very excited to have people come and take a look at NASA’s history,” said Brian Dunbar, NASA’s Internet services manager at Headquarters in Washington. “We’ve been able to take a wide range of material and weave it into a virtual tour that allows people to explore at their own pace.”

Here are a few things you can see in this virtual tour:
• Interior 3D views of John Glenn’s Friendship 7 Mercury spacecraft
• The original April 1959 press conference introducing the Mercury astronauts
• A tour of the International Space Station
• Video presentations about NASA’s aeronautics programs
• An interview with former CBS news journalist Walter Cronkite
• A presentation of the Voyager and Viking missions hosted by an avatar of the late Carl Sagan

Latest from HiRISE: Stairs, Polygons, Dunes and Troughs

Stair-Stepped Mounds in Meridiani Planum. Credit: NASA/JPL/University of Arizona


Meridiani Planum on Mars, where the Mars Rover Opportunity has been traversing the past four plus years, is not just covered with flat, endless plains. Of course, Opportunity has been entering and studying a few of the craters in the region.

Continue reading “Latest from HiRISE: Stairs, Polygons, Dunes and Troughs”

“We Have Water” on Mars, TEGA Test Confirms

Latest panorama from Mars. Credit: NASA/JPL/Caltech/U of Arizona

[/caption]
The Phoenix Mars lander finally was successful in delivering a fairly fresh sample of Martian soil to the Thermal and Evolved Gas Analyzer (TEGA) oven on Wednesday and a “bake and sniff” test identified water in the soil sample. “We have water,” said William Boynton of the University of Arizona, lead scientist for TEGA. “We’ve seen evidence for this water ice before in observations by the Mars Odyssey orbiter and in disappearing chunks observed by Phoenix last month, but this is the first time Martian water has been touched and tasted.”

The soil sample came from a trench approximately 2 inches deep. When the robotic arm first reached that depth, it hit a hard layer of frozen soil. Two attempts to deliver samples of icy soil on days when fresh material was exposed were foiled when the samples became stuck inside the scoop. Most of the material in Wednesday’s sample had been exposed to the air for two days, letting some of the water in the sample vaporize away and making the soil easier to handle.

“Mars is giving us some surprises,” said Phoenix principal investigator Peter Smith of the University of Arizona. “We’re excited because surprises are where discoveries come from. One surprise is how the soil is behaving. The ice-rich layers stick to the scoop when poised in the sun above the deck, different from what we expected from all the Mars simulation testing we’ve done. That has presented challenges for delivering samples, but we’re finding ways to work with it and we’re gathering lots of information to help us understand this soil.”

Phoenix's Workspace on Mars.  Credit:  NASA/JPL/Caltech/U of Arizona
Phoenix's Workspace on Mars. Credit: NASA/JPL/Caltech/U of Arizona

Also at the press conference announcing the results, NASA also announced a mission extension for Phoenix, through Sept. 30. The original prime mission of three months ends in late August. The mission extension adds five weeks to the 90 days of the prime mission.

“Phoenix is healthy and the projections for solar power look good, so we want to take full advantage of having this resource in one of the most interesting locations on Mars,” said Michael Meyer, chief scientist for the Mars Exploration Program at NASA Headquarters in Washington.

During the mission extension, the science team will attempt to determine whether the water ice ever thaws enough to be available for biology and if carbon-containing chemicals and other raw materials for life are present.

A full-circle, color panorama of Phoenix’s surroundings was recenlty completed by the spacecraft.

“The details and patterns we see in the ground show an ice-dominated terrain as far as the eye can see,” said Mark Lemmon of Texas A&M University, lead scientist for Phoenix’s Surface Stereo Imager camera. “They help us plan measurements we’re making within reach of the robotic arm and interpret those measurements on a wider scale.”

Original News source: Phoenix News site

Astronomers Simulate the First Stars Formed After the Big Bang

Artist concept of the first stars. Credit: Harvard Smithsonian CfA

[/caption]
What were the first stars like that formed shortly after the Big Bang? We don’t know much about the conditions of the early universe 13 billion years ago, but a new computer simulation provides the most detailed picture yet of the first stars and how they came into existence. The composition of the early universe was quite different from that of today, said Dr. Naoki Yoshida, Nagoya University in Nagoya, Japan and Dr. Lars Hernquist at the Harvard-Smithsonian Center for Astrophysics in Cambridge, MA. An article that will be published to the August 1 journal Science describes their findings from the computer model that simulates the early days of the universe, the “cosmic dark ages,” where the physics governing the universe were somewhat simpler. The astronomers believe small, simple protostars formed, which eventually became massive, but short-lived stars.

According to their simulations, gravity acted on minute density variations in matter, gases, and the mysterious “dark matter” of the universe after the Big Bang in order to form the early stages of a star called a protostar. With a mass of just one percent of our Sun, Dr. Yoshida’s simulation also shows that the protostar would likely evolve into a massive star capable of synthesizing heavy elements, not just in later generations of stars, but soon after the Big Bang. These stars would have been up to one hundred times as massive as our Sun and would have burned for no more than one million years. “This general picture of star formation, and the ability to compare how stellar objects form in different time periods and regions of the universe, will eventually allow investigation in the origins of life and planets,” said Hernquist.

“The abundance of elements in the Universe has increased as stars have accumulated,” he says, “and the formation and destruction of stars continues to spread these elements further across the Universe. So when you think about it, all of the elements in our bodies originally formed from nuclear reactions in the centers of stars, long ago.”

The goal of their research is to be able to figure out how the primordial stars formed, as well as predicting the mass and properties of the first stars of the universe. The researchers hope to eventually extend this simulation to the point of nuclear reaction initiation – when a stellar object becomes a true star. But that’s the point where the physics becomes much more complicated, and the researchers say they’ll need more computational resources to simulate that process.

Original news source: Harvard Smithsonian Center for Astrophysics

Liquid Lake on Titan Confirmed

Artist's concept of the liquid lake on Titan. Credit: NASA/JPL

[/caption]

NASA’s Cassini mission has detected liquid hydrocarbons on Saturn’s moon Titan, in a large, glassy lake near the moon’s south pole. Before the Cassini mission began, scientists thought Titan would have global oceans of methane, ethane and other light hydrocarbons. But after more than 40 close flybys of Titan by Cassini, data showed no global oceans exist. However hundreds of dark, lake-like features are present. Until now, it was not known whether these features were liquid or simply dark, solid material. Using Cassini’s Visual and Infrared Mapping Spectrometer (VIMS), which identifies the chemical composition of objects by the way matter reflects light, a liquid ethane lake 235 kilometers (150 miles) long was detected. This makes Titan the only body in our solar system beyond Earth known to have liquid on its surface.

“This is the first observation that really pins down that Titan has a surface lake filled with liquid,” said Bob Brown of the University of Arizona, Tucson, leader of the VIMS instrument.

Scientists had deduced through earlier observations that there was likely liquid on Titan, but this is the first incontrovertible evidence. (Emily Lakdawalla at the Planetary Society explains this excellently.)

“Detection of liquid ethane confirms a long-held idea that lakes and seas filled with methane and ethane exist on Titan,” said Larry Soderblom, a Cassini interdisciplinary scientist with the U.S. Geological Survey. “The fact we could detect the ethane spectral signatures of the lake even when it was so dimly illuminated, and at a slanted viewing path through Titan’s atmosphere, raises expectations for exciting future lake discoveries by our instrument.”

The dark area near the top is Ontario Lacus.  Credit: NASA / JPL / Space Science Institute
The dark area near the top is Ontario Lacus. Credit: NASA / JPL / Space Science Institute

Titan’s hazy, nitrogen and methane atmosphere makes it difficult to study the moon’s surface. The liquid ethane was identified using a technique that removed the interference from the atmospheric hydrocarbons.

The VIMS instrument observed a lake, called Ontario Lacus, in Titan’s south polar region during a close Cassini flyby in December 2007. The lake is roughly 20,000 square miles (7,800 square miles) in area, slightly larger than North America’s Lake Ontario.

The ethane is in a liquid solution with methane, other hydrocarbons and nitrogen. At Titan’s surface temperatures, approximately 300 degrees Fahrenheit below zero, these substances can exist as both liquid and gas. Titan shows overwhelming evidence of evaporation, rain, and fluid-carved channels draining into what, in this case, is a liquid hydrocarbon lake.

Earth has a hydrological cycle based on water and Titan has a cycle based on methane. Scientists ruled out the presence of water ice, ammonia, ammonia hydrate and carbon dioxide in Ontario Lacus. The observations also suggest the lake is evaporating. It is ringed by a dark beach, where the black lake merges with the bright shoreline. Cassini also observed a shelf and beach being exposed as the lake evaporates.

“During the next few years, the vast array of lakes and seas on Titan’s north pole mapped with Cassini’s radar instrument will emerge from polar darkness into sunlight, giving the infrared instrument rich opportunities to watch for seasonal changes of Titan’s lakes,” Soderblom said.

More information is available at NASA’s Cassini site, JPL’s Cassini site, and the Univeristy of Arizona’s VIMS site.

Where In The Universe Challenge #14

Here’s this week’s image for the “Where In The Universe” challenge. Take a look at the image above and guess where in our universe this image was taken. Extra points if you can name the spacecraft responsible for the image as well. No peeking below before you make your guess. Of course, some of our readers out there don’t guess: they KNOW! Universe Today draws some pretty savvy space buffs who know their stuff. Hopefully this weekly challenge is helping everyone to hone (or show off?) their skills.

Ready? Go!

This week’s image is a composite image, composed of two images taken with Cassini’s visual and infrared mapping spectrometer, shows a crescent view of Saturn’s moon Titan.

The data were obtained during a flyby on July 22, 2006, at a distance of 15,700 kilometers (9,700 miles) from Titan. The image was constructed from images taken at wavelengths of 1.26 microns shown in blue, 2 microns shown in green, and 5 microns shown in red.

Not only is Titan a very intriguing world, its beautiful as well. Just a little chilly there, though.

How’d you do in this week’s challenge?

More info on this image.

Phobos Up Close from Mars Express

Hi-Res Phobos. Credits: ESA/ DLR/ FU Berlin (G. Neukum)

[/caption]
On July 23, Europe’s Mars Express spacecraft flew only 93 kilometers from Mars’ moon Phobos, and took the most detailed images ever of the small, irregular moon. Additionally, the spacecraft made other close flybys during the past few weeks, and creating a variety of images. The moon’s grooved surface can be seen in the pictures quite clearly, but the origin of the grooves is not known. They could have been formed by ejecta thrown up from impacts on Mars, or if they could be caused by internal fissures result from the surface regolith, or soil, slipping into internal fissures. Whatever the cause, enjoy these new hi-resolution images of Phobos.

Phobos flyby. Credits: ESA/ DLR/ FU Berlin (G. Neukum)

The best images taken by Mars Express have a resolution of 3.7 m/pixel and are taken in five channels different channels to create 3-D images, and to analyze the physical properties of the surface. Measuring 27 km × 22 km × 19 km, Phobos is one of the least reflective objects in the Solar System, thought to be a capture-asteroid or a remnant of the material that formed the planets.

A Russian sample return mission called Phobos-Grunt (Phobos soil), is scheduled to launch in 2009. It is expected to land on the far-side of Phobos at a region between 5° south to 5° north, and 230° west to 235° west. This region was last imaged in the 1970s by the Viking orbiters. The inset here shows potential landing sites for the Russian mission.

Phobos.  Credits: ESA/ DLR/ FU Berlin (G. Neukum)
Phobos. Credits: ESA/ DLR/ FU Berlin (G. Neukum)

The images obtained by several other spacecraft so far have either been of a lower resolution, or not available in 3D and have not covered the entire disc of Phobos. This is also the first time that portions of the far-side of the moon have been imaged in such high resolution (Phobos always faces Mars on the same side). Mars Express’ High Resolution Camera (HRSC) Super-resolution channel (SRC) image taken on 22 July 2008 from a distance of 4500 km, showing the illuminated edge of the potential landing site of the Russian Phobos-Grunt mission.

Phobos in 3-D.  Credits: ESA/ DLR/ FU Berlin (G. Neukum)
Phobos in 3-D. Credits: ESA/ DLR/ FU Berlin (G. Neukum)

The imaging team is still working on producing additional images of the moon, including more in 3-D like this one. Managing the close fly-bys was an operational challenge, made possible by spacecraft operations engineers and scientists who worked together to specially optimise Mars Express’s trajectory and obtain the best possible views.

Original News Source: ESA

Astronomers Find New Evidence for Dark Energy

Dark Energy's stretching effect. Credit: U of Hawaii

[/caption]
A team of astronomers has found what they say is the clearest detection to date of dark energy in the universe. Scientists at the University of Hawaii compared an existing database of galaxies with a map of the cosmic microwave background radiation (CMB), and were able to detect dark energy’s effect on vast cosmic structures such as superclusters of galaxies, where there is a high concentration of galaxies, and supervoids, areas in space with a small number of galaxies. “We were able to image dark energy in action, as it stretches huge supervoids and superclusters of galaxies,” said Dr. István Szapudi said, from U of Hawaii’s Institute for Astronomy.

The discovery in 1998 that the universe was actually speeding up in its expansion was a surprise to astronomers. Dark energy refers to the fact that something must fill the vast reaches of mostly empty space in the Universe in order to be able to make space accelerate in its expansion. Dark energy works against the tendency of gravity to pull galaxies together and so causes the universe’s expansion to speed up.But the nature of dark energy and why it exists is one of the biggest puzzles of modern science.

The team from the University of Hawaii made the discovery by measuring the subtle imprints that superclusters and supervoids leave in microwaves that pass through them. Superclusters and supervoids are the largest structures in the universe.

“When a microwave enters a supercluster, it gains some gravitational energy, and therefore vibrates slightly faster,” explained Szapudi. “Later, as it leaves the supercluster, it should lose exactly the same amount of energy. But if dark energy causes the universe to stretch out at a faster rate, the supercluster flattens out in the half-billion years it takes the microwave to cross it. Thus, the wave gets to keep some of the energy it gained as it entered the supercluster.”

“Dark energy sort of gives microwaves a memory of where they’ve been recently,” postdoctoral scientist Mark Neyrinck said.

Comparing superclusters (red circles) and supervoids (blue circles) with the CMB.  Credit:  U of Hawaii
Comparing superclusters (red circles) and supervoids (blue circles) with the CMB. Credit: U of Hawaii

When the team compared galaxies against the CMB, they found that the microwaves were a bit stronger if they had passed through a supercluster, and a bit weaker if they had passed through a supervoid.

“With this method, for the first time we can actually see what supervoids and superclusters do to microwaves passing through them,” said graduate student Benjamin Granett.

The signal is difficult to detect, since ripples in the primordial CMB are larger than the imprints of individual superclusters and supervoids. To extract a signal, the team averaged together patches of the CMB map around the 50 largest supervoids and the 50 largest superclusters that they detected in extremely bright galaxies drawn from the Sloan Digital Sky Survey, a project that mapped the distribution of galaxies over a quarter of the sky.

The astronomers say there is only a one in 200,000 chance that the evidence they detected would occur by chance.

Original News Source: U of Hawaii press release