Measuring the Coronal Temperature with Iron

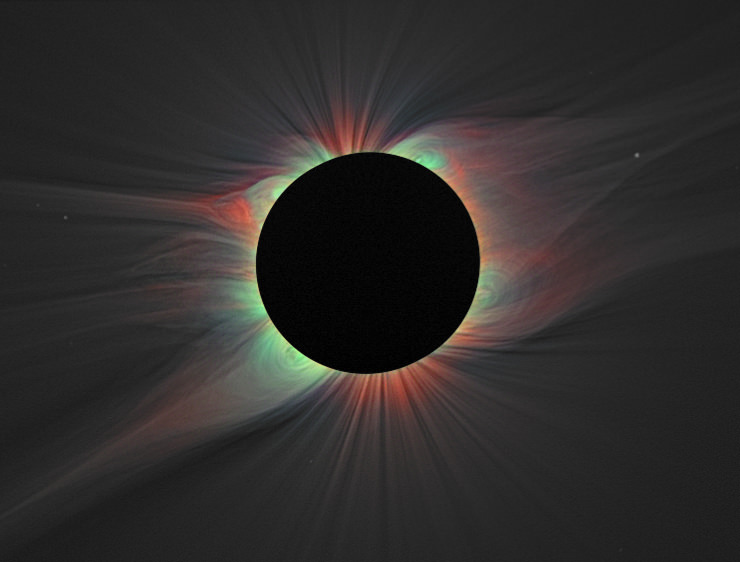
This image of the solar corona contains a color overlay of the emission from highly ionized iron lines and white light taken of the 2008 eclipse. Red indicates iron line Fe XI 789.2 nm, blue represents iron line Fe XIII 1074.7 nm, and green shows iron line Fe XIV 530.3 nm. This is the first such map of the 2-D distribution of coronal electron temperature and ion charge state. Credit: Habbal, et al.

Astronomers presenting at this week’s AAS conference have reported on new research measuring the temperature of the solar corona. The work combines observations of the Sun’s outer reaches from observations during total solar eclipses in 2006, 2008, and 2009. It utilized mapping of various abundances of ionized iron to build a two dimensional temperature map.

Although many introductory science classes paint temperature as a fixed number, in reality, it’s the average of a range of temperatures which is a way of quantifying the kinetic energy of the particles in question. Individual particles may be hotter (higher kinetic energy) while others may be cooler (lower kinetic energy). As these atoms move around, they can collide and these collisions will knock off electrons causing the atoms to become ionized. The degree of ionization will be indicative of just how energetic the collision was.

Those ionized atoms can then be identified spectroscopically or by using a filter to search for the wavelength at which those atoms will emit light as new electrons settle down into the previously vacated orbitals. By measuring the relative amounts of ionization astronomers can then reconstruct the range of kinetic energies in the gas and thus, temperature range which can, in turn, be used to determine the average temperature.

This is the method an international team of astronomers used to study the sun’s corona. Since light atoms don’t work well for this method (they become fully ionized or just can’t show a large range of ionization like atoms with more electrons), the astronomers chose to study the Sun’s corona through various states of iron ionization. In doing so they mapped several ionization states, including capturing for the first time, the elusive Fe IX lines (iron with 8 electrons knocked off) at 789.2 nm.

One interesting finding was that the region of emission extended to three solar radii (or 1.5 times the diameter). After this distance, the collision rate drops off and can no longer cause the ionization of atoms (however, radiative processes caused by photons from the sun can still ionize the atoms, but this is no longer indicative of the temperature of the atoms). This was further than originally anticipated.

Another result of their work showed that there is a strong correspondence between the amounts of various ions coming from the sun and that same ratio in interplanetary space as measured by the SWICS on the Advanced Composition Explorer. This connection will better help astronomers understand the working of our Sun as well as how its emissions may impact the Earth.

The full results of this work are to be published in the January 10 issue of the Astrophysical Journal.

Spitzer Peers Into the Small Magellanic Cloud

Spitzer Image of the Small Magellanic Cloud

This week at the AAC Conference, astronomers released a new image of the Small Magellanic Cloud (SMC, a dwarf galaxy just outside our Milky Way) from Spitzer. The purpose of the image was to study “the life cycle of dust in this galaxy.” In this life cycle, clouds of gas and dust collapse to form new stars. As those stars die, they create new dust in their atmosphere which will enrich the galaxy and, when the stars give off that dust, will be made available future generations of stars. The rate at which this process occurs determines how fast the galaxy will evolve. This research has shown that the SMC is far less evolved than our on galaxy and only has 20% of the heavy elements that our own galaxy has. Such unevolved galaxies are reminiscent of the building blocks of larger galaxies.

As with most astronomical images, this new image is taken in different filters which correspond to different wavelengths of light. The red is 24 microns and traces mainly cool dust which is part of the reservoir from which new star formation can occur. Green represents the 8 micron wavelength and traces warmer dust in which new stars are forming. The blue is even warmer at 3.6 microns and shows older stars which have already cleared out their local region of gas and dust. By combining the amount of each of these, astronomers are able to determine the current rate at which evolution is taking place in order to understand how the evolution of the SMC is progressing.

The new research shows that the tail (lower right in this image) is tidal in nature as it’s being tugged on by gravitational interactions with the Milky Way. This tidal interaction has caused new star formation in the galaxy. Surprisingly, the team of researchers also indicated that their work may indicate that the Magellanic Clouds are not gravitational bound to the Milky Way and may just be passing.

More images can be found at the JPL website.

Early Release Science from Hubble WFC3 at AAS Conference

The image above is a newly released image from the Hubble Space Telescope. The image shows a mosaic of a portion of the Great Observatories Origins Deep Survey (GOODS) South Field nearly 1/3 the size of the full moon taken in September and October of 2009. It combines data taken in 10 filters that span the infrared to near ultraviolet. It made use of the newly installed Wide Field Camera 3 (WCF3) and the Advanced Camera for Surveys (ACS). The survey used 100 Hubble orbits for images from the ACS and 104 for the WCF3 images. Galaxies in the image are as faint as 26.5th to 27th magnitude which is several thousand times fainter than can be viewed with the naked eye and shows 7,500 galaxies.

Some of the first science results from this image were discussed this morning at the AAS conference in Washington.

The nearest galaxy in this image is an estimated 1 billion light years distant. The furthest are nothing more than faint red specks that are 13 billion light years away meaning their light left them just a half billion years after the Big Bang. This dynamic range adds to the large volume of images of galaxies over the history of the universe that allows them to understand how galaxies have formed and evolved.

It reveals that galaxy life in the early universe was especially chaotic. There is an increased number of galaxy mergers. Furthermore, many galaxies are so active with star formation they were blowing themselves apart into unusual shapes (similar to M 82). Although this has been seen in other surveys, this new image confirms the irregularity of shape in all wavelengths. Many of the most distant galaxies appear to be ellipticals although some show traces of faint spiral arms.

The image also shows that galaxies continue to build in mass from this chaotic past but the rate of growth slows around eight to ten billion years ago.

One surprise was that a type of galaxies that were uncharacteristically red (indicative of old stars and a lack of star formation) was discovered to have more star formation that previously expected. Astronomers had called these galaxies “red and dead” but ultraviolet detectors found traces of ongoing star formation in the cores and in weak spiral arms in these galaxies leading them to suspect the galaxies aren’t as dead as previously thought.

The full spectrum coverage also allows for estimates of redshift (an indicator of distance) for galaxies too faint to have their redshift taken spectroscopically. By combining observations in numerous filters Hubble can now give redshift measurements with as little as a 4% error.

Although the results posted at the A A S meeting are very preliminary there are many teams working on this newest data release. In the 2-3 months since the images were taken, 4 papers have been submitted for publication.

See a zoomable version of the image here.

Arp’s Phantom Jet

Arp 192 from his publication (left) compared to SDSS image (right). Prominent jet in upper right is present in Arp's image is missing from modern images.

[/caption]

During the “Great Debate” of 1920 astronomers Herber Curtis and Harlow Shapley had a famous debate on the nature of “spiral nebulae”. Curtis argued they were “island universes” or what we would today call a galaxy. Shapley was of the opinion that they were spiral structures within our own galaxy. One of the evidences Shapley put forth was that another astronomer, Adriaan vanMaanen, had reported detecting rotation of these objects over a period of years leading to an overall rotation rate of ~105 years. If these spiral nebulae were truly as far (and thus, as large) as Curtis suggested this would mean they would be rotating well beyond the speed of light at their outer edges.

It was later determined vanMaanen’s rotation was a case of wishful thinking when Hubble eventually determined the true distance to the Andromeda galaxy. From then on, it was well established that galaxies are so large, their motions will not be observed in human lifetimes. Aside from local flare ups of supernovae and other such events, galaxies should be relatively static. Yet in just over 40 years, a distinct, large-scale feature in the galaxy NGC 3303 seems to have disappeared entirely.

In 1964, Halton Arp observed NGC 3303. This oddly shaped spiral galaxy he reported as having a jet protruding from the northwest side. It made it into his famous 1966 compilation of photographs entitled, “The Atlas of Peculiar Galaxies” as Arp object 192. A 2006 publication by Jeff Kanipe and Dennis Webb (The Arp Atlas of Peculiar Galaxies: A Chronicle and Observer’s Guide) listed this jet as a “challenge” for astronomers to capture.

In 2009, an advanced amateur named Rick Johnson attempted a long exposure of NGC 3303. When his image was finished, it was notably lacking the jet. The news of this eventually reached Kanipe and Webb and they suspected that the exposure was simply not long enough to have captured this object. To be sure, they consulted images of the galaxy from the Sloan Digital Sky Survey. The jet was missing from these images as well. A major feature on a galaxy had vanished in 45 years and no one had noticed until 2009.

The only plausible explanation was that the jet Arp detected didn’t really exist. It was possible it was a photographic defect in the glass plate on which the image was taken. Another possibility was that the imaged structure did exist, it just wasn’t what Arp suspected.

When Charles Messier attempted to look for comets, he kept a list of 109 objects that were not comets so he wouldn’t be confused by them. To tell true comets apart from the other fuzzy objects he observed, he observed them over a period of nights. If they moved with respect to background stars, they must be relatively nearby. If not, they were likely very distant. Was Arp’s jet the opposite; A nearby object that had simply moved out of the field of view since his original image?

Kanipe contacted the Minor Planet Center to determine if any of the known asteroids or minor planets had been in the vicinity when the image was taken. It turned out that a minor planet, TU240, discovered on 6 October 2002 by the Near Earth Asteroid Telescope on Haleakala, Maui, Hawaii, was very near to NGC 3303 when Arp imaged it confirming it was a strong candidate for Arp’s disappearing jet.

This isn’t the first time an object has been pre-discovered and its true nature simply missed when it was imaged. There is evidence that the planet Neptune was observed at least three different times (including by Galileo) before its nature was understood. But for this TU240,  this is expected to be the earliest prediscovery photograph. As a result, TU240 was given a new designation just after Thanksgiving 2009. It is now listed as 84447 Jeffkanipe.

(Read this story as told by Rick Johnson at the BAUT Forums.)

Probing the Explosive History of Eta Car

Eta Carinae as imaged by the Gemini South telescope in Chile with the Near Infrared Coronagraphic Imager (NICI) using adaptive optics to reduce blurring by turbulence in the Earth’s atmosphere. In this image the bipolar lobes of the Homunculus Nebula are visible with the never-before imaged “Little Homunculus Nebula” visible as a faint blue glow, mostly in the lower lobe. The Butterfly Nebula is visible (region circled) as the yellowish glow with dark filamentary structure close to, and mostly below/left, of the central star system (the central star system appears as a dark spot due to the coronagraphic blocking (occulting) disk used to eliminate the star’s bright glare).

Caption: Eta Carinae as imaged by the Gemini South telescope in Chile with the Near Infrared Coronagraphic Imager (NICI) using adaptive optics to reduce blurring by turbulence in the Earth’s atmosphere. In this image the bipolar lobes of the Homunculus Nebula are visible with the never-before imaged “Little Homunculus Nebula” visible as a faint blue glow, mostly in the lower lobe. The Butterfly Nebula is visible (region circled) as the yellowish glow with dark filamentary structure close to, and mostly below/left, of the central star system (the central star system appears as a dark spot due to the coronagraphic blocking (occulting) disk used to eliminate the star’s bright glare).

I can’t seem to stop writing about Luminous Blue Variable (LBV) stars this week. And new research discussed at the AAS conference this week continues the trend. As part of a series of short talks on exploding stars, John Martin of the University of Illinois, Springfield spoke on his work with the LBV Eta Carinae.

Eta Carinae is often cited as one of the most likely stars of which we know to erupt as a core collapse supernova. It has a mass of nearly 100 times that of the sun. Although it hasn’t exploded as a supernova yet, its history has seen some pronounced brightenings. In 1843, Eta Carinae underwent a massive eruption that lasted 20 years and shed an estimated 20 times the mass of the sun. During that time, it became the second brightest stellar object in the sky (note: Eta Car is most readily visible from the southern hemisphere). It also emitted as much energy as a typical supernova although spread out over the duration instead of the quick burst as in a real supernova. Martin called this great eruption an “impostor supernova.”

To probe the internal structure of the outburst Martin and his team used the Near Infrared Chronographic Imager (NICI) on the Gemini South telescope in Chile. The use of infrared allowed the team to peer through the dusty outer layers of the nebula which absorb visible light. The device also used a device to block the light from the central star allowing the team to look through the glare and more directly explore the surrounding structure.

“The Gemini images have allowed us to perform something akin to an autopsy by peeling away the obscuring, outer dusty skin and giving us a glimpse of what’s inside,” Martin said. “In the process we’re finding things we have never imaged before and didn’t expect. It’s like finding your murder victim has a third lung, an extra liver, or something more exotic hidden away under their skin!”

During his presentation Martin also used an analogy of geology in which looking to deeper layers can give a chronological history since the inner layers would not have been expanding as long. Their infrared expedition revealed several structures never before seen in Eta Carinae. The region around the central star system contained wispy clouds which the team nicknamed the “Butterfly Nebula” (not to be confused with NGC 6302, which also has that moniker). They also discovered a smaller set of lobes which they dubbed the “Little Homunculus Nebula”. This structure was traced by mapping forbidden emission lines of Fe II.

New Studies on the Vela Star Forming Region

A false-color infrared image of the star forming complex in Vela. Two new studies have measured for the first time the dust emission at very long infrared wavelengths, and found a set of young stars that are accreting material and flaring. Credit: NASA and the Spitzer Space Telescope

[/caption]

This week at the AAS meeting scientists revealed two new studies on a star forming region in Vela. The first used the Balloon-borned Large Aperture Submillimeter Telescope (BLAST, a proptotype detector for the one on the new Herschel Space Telescope) to classify the young stars and begin mapping the warm dust in the region. The second searched the nebula for flaring young stars. Both studies are to appear in an upcoming publication of the Astrophysical Journal.

Although star formation has been well modeled and understood theoretically, observational astronomy is often made more difficult due to the fact that it occurs shrouded in dusty nebulae. Visible light absorbed by the nebula and reemitted as lower energy infrared light. Most of the wavelengths in this region cannot permeate Earth’s atmosphere.

In order to study regions like this, astronomers are forced to use balloon based and space observatories. Astronomers Massimo Marengo, Giovanni Fazio, and Howard Smith, together with an international team of scientists used BLAST to study just such a star forming region in Vela. The first of their studies searched the nebula for newly formed stars. To do this, they searched for behaviors shown to be indicative of star formation, “such as proto-stellar jets and molecular outflows.” Additionally, to truly classify as a proto-star, the object was required to show up at more than one wavelength. In searching for these candidates, they confirmed 13 cores originally reported by a previous team, but discounted one because it did not have the proper spectral characteristics (although they may still later collapse to form stars).

By analyzing the mass of the forming regions, the team was also able to show that the Core Mass Function (CMF, a function that describes the frequencies of proto-star cores of various masses) is very similar to the Initial Mass Function (IMF, which is the same thing but for already formed stars). Although this is unsurprising, it is a necessary observation to confirm our understanding of how stars form and to show that stars do indeed come from such nebulae.

Another unsurprising confirmation of stellar formation models is that forming cores in the nebula are notably warmer when they’ve reached the density sufficient to create fusion in the core and have an embedded protostar. These results, “can thus provide guidelines
for understanding the physical conditions where the transition between pre- and proto-stellar cores takes place.”

The second of their studies analyzed known young stars to search for large flares thought to be caused by material being accreted onto the young star. The region was imaged once and then a second time six months later. Over this period, 47 of some 170,000 observed stars had increases in brightness consistent with what was expected for flaring. Closer inspection of these stars 19 had the further characteristics (mass, age, environment) expected of such flares. Eight showed evidence of being extremely young (on the order of a hundred thousand years or less) and were still enshrouded in gravitationally bound disks of dust.

Although this cannot confirm the prediction of such youthful flares being due to infalling material (as opposed to magnetic fields or interactions with a companion) it does show that BLAST and its successor, Herschel, will be a powerful tool for further study.

Do Eruptions of P Cygni Point to a Companion?

The other day, I wrote an article on Luminous Blue Variables (LBVs) which made reference to P Cygni as a well established LBV to which a group made comparisons. While P Cygni is a good example of an LBV, it has many interesting characteristics in its own right. Prior to August 8, 1600, the star was not known to exist, when suddenly, it appeared, flaring to 3rd magnitude. Over the next hundred years it continued to undergo outbursts, fading and brightening.

New research by Amit Kashi of the Israel Institute of Technology suggests this series of flares may be due to the presence of a second star in orbit around P Cygni.Many other Luminous Blue Variables, such as Eta Carinae, are suspected to be binary systems. However, the overwhelming brightness of LBV stars makes it difficult to directly detect stars that would otherwise be considered bright. Kashi takes this further and suggests “all major LBV eruptions are triggered by stellar companions”. In this scenario, as a smaller companion in the system came on its closest approach (periastron) the outer layers of the LBV, which are already unstable and loosely bound due to the size of the star, are pulled off due to tidal forces. The gravitational energy as it merges with the companion is turned into thermal energy and this increases the overall brightness until it is fully absorbed. The cause of such a mass transfer would decrease the orbital size of the companion and result in the next outburst being sooner than if the orbit were constant. Kashi suggests “[t]his process repeats until the instability in the LBV stops. From that point on the orbital period remains approximately stable, changing only very slightly due to mass loss from the LBV, and tidal interaction.”

To test his hypothesis, Kashi modeled a system with a LBV star of similar mass to that estimated for P Cygni and put a 3 solar mass star in a highly eccentric orbit around it. With these simple starting parameters, Kashi showed that it was possible to produce a situation in which the onset of eruptions was similar to the periastron approach. However, there were some uncertainties due to a lack of records during the time period which puts the true beginning of the eruptions in question. Furthermore, Kashi retested his model for a 6 solar mass companion and showed the similarity between periastrons and eruptions was still a good fit making the model robust.

Image from Kashi (2009) showing model orbit superimposed on historical light curve data

However, this still leaves many variables for the models unconstrained and able to be fiddled with to make the model fit (Insert joke about being able to fit a curve to a cow with enough degrees of freedom here). Unfortunately, Kashi notes that further testing may be difficult. As earlier mentioned, direct detection of a companion would be hampered by the brightness of the LBV. Even detecting a companion spectroscopically would be difficult if not impossible. The reason is that the wind from P Cygni causes the absorption lines in its spectra to be broadened. For Kashi’s model system, the doppler shift from the companion is not large enough to shift the lines more than they are already broadened which would make detecting the change in radial velocity a challenge. He notes, “the probability of detecting radial velocity due to orbital motion in spectral lines is small for most of the orbit, but might be possible every 7 years, if the inclination angle is large enough. I therefore predict that a continuous 7 year long observation of pronounced lines may reveal a small doppler shift variation, close to the periastron passage.”

MN112 – A New Luminous Blue Variable Found From Its Nebula?

Eta Carinae. One of the most massive stars known. Image credit: Hubble

[/caption]

Luminous Blue Variables (LBVs) are a rare class of extremely massive stars that teeter on the very edge of being stable. The most famous of this class of stars is the well studied Eta Carinae. Like many other LBVs, Eta Carinae is shrouded in a nebula of its own making. The instability of the star causes it to throw off large amounts of mass even during its brief main sequence lifetime. What makes these stars so unstable is an open question which has been difficult to answer do the the paucity of known LBVs. Given that the initial mass function predicts that such massive stars should be rare, this is not surprising, but identifying these stars is often made even more difficult due to the reddening caused by their nebulae.

However, an international team working from Russia and South Africa proposes that the nebula itself may be able to help identify potential candidates of LBVs. To test out their hypothesis, they scanned the Spitzer image archives for nebulae with features similar to those of known LBVs. The feature that distinguished potential LBV nebulae from other nebulae was emission only in the 24 ?m images (likely due to the fact that nebulae do not operate as model blackbodies at such wavelengths, but instead emit most strongly at specific wavelengths due to fluorescence).

In their review of potential nebulae, they identified a one known as MN112. To further explore the possibility, the team took high resolution spectra of the central star. They determined the central star had strong similarities to the known LBV P Cygni. Most notably, the candidate LBV showed very strong emission lines for hydrogen and He I right next to absorption lines for the same elements. This is caused by high pressure regions, either in the atmosphere of the star, or as the faster wind from the star interacts with a slower moving nebula around it. The high pressure region becomes more dense and gives emission lines. Since it moves outwards, it is slightly blueshifted and thus, does not appear directly on top of the absorption line caused by the relatively less dense atmosphere. This time of feature is known as a P Cygni profile.

Another identifying feature of Luminous Blue Variables is that they are variable (Surprise!) up to as much as 1-2 magnitudes. The team had records of the star from photographic plates dating back as far as 1965 as well as more recent CCD measurements and found that the star had not been seen to vary significantly from an apparent blue magnitude (mB) of 17. However, in the infrared region, they determined (using their own photometric observations) that the star had brightened by 0.4 magnitudes over the past 19 years. Although this falls short of the expected variability for a LBV, they suggest “it is quite possible that a significant fraction of LBVs (if not all of them) goes through the long quiescent periods (lasting centuries or more; e.g. Lamers 1986) so that the fast variability (on time
scales from years to decades) observed in the vast majority of classical LBVs could be merely due to the selection effect.”

The authors state their intention to continue observation of this candidate LBV “in the hope that the ”duck” will ”quack” in the foreseeable future.”

Galactic Building Blocks

The current view of galactic formation is that galaxies form from a “bottom-up” method. In this picture, small dwarf galaxies, full of metal poor stars, were attracted by dark matter halos in the early universe which merged into larger galaxies. Many of those metal poor stars can still be seen today in the halo of the galaxy, but it was thought that the building blocks from which the galaxies were constructed were long gone or had evolved on their own and would no longer resemble the primordial building blocks.

However, earlier this year, an extremely metal poor star with only 0.00025% of the iron in the Sun was discovered in the Sculptor dwarf galaxy. If confirmed, this would show a strong link to further support the notion that metal poor dwarf galaxies were related to the metal poor stars that still populate our halo. Confirming this was the subject of a recent paper.

For their study, the authors analyzed the newly discovered star (S1020549) with a high resolution spectrograph. From this, they confirmed that the star had very little iron present (an element generally used as an indicator of overall heavy element abundance since its absorption lines feature prominently in the spectra and are easily detectable). The extremely low ratio of iron to hydrogen makes it currently the most metal poor star known in a dwarf galaxy (the overall record holder for metal deficiency is HE 13272327).

The study determined an overall [Fe/H] abundance of -3.8 (see how this abundance is defined here) which is very similar to the [Fe/H] abundance of archetypical halo stars of about -4.0. Furthermore, many of the other elemental abundances that were uncovered with the detailed spectroscopy (especially those of Mg, Ca, Sc, Ti, and Cr) also fit the general abundance level of stars found in our halo.

This isn’t a conclusive tie between the two and more such stars will need to be uncovered to reinforce the similarities, but since S1020549 was discovered with “a relatively modest survey” this may suggest “that future observational searches should discover more such objects in Sculptor and other dwarf galaxies.”

New Observations of TrES-2b May Reveal New Exoplanet

An artist's impression of a transiting exoplanet. Credit: ESA C Carreau

[/caption]

For those know their solar system history, the discovery of Neptune is an especially exciting story. Before it was detected observationally, its gravitational effects on another planet (Uranus) were discovered. From this, astronomers were able to predict the position of the yet unobserved planet and in 1846 they discovered the predicted planet observationally from Berlin Observatory. (For a more complete retelling of the story, see my summary/review of the book The Neptune File). This discovery prompted searches for other planets from orbital discrepancies attributed to gravitational perturbations on Mercury. However, none were ever found and it was eventually that Mercury’s orbital irregularities were due to relativistic effects.

However, this technique of inferring planets from orbital oddities of a planet may have been used for the first time outside our solar system.

The exoplanet known as TrES-2b is one of the exceptional cases of known exoplanets for which the plane of the orbit lies almost directly in our line of sight. This circumstance means that the planet will appear to cross the disk of the star as it orbits. Although we cannot resolve that disk, it shows up as a characteristic dip in the brightness which can reveal additional information about the system such as “very accurate determinations of the radii of star and planet (relative to the semi-major axis) and the inclination of the orbital plane of the planet”. This additional information allows for excellent determinations of the orbital parameters in order to predict future transits.

A team of German astronomers observed the TrES-2 system in 2006 and 2008 in order to build their understanding of the orbit of the planet. However, when they continued in observation in 2009 they found significant changes in the inclination of the orbit and the period of the orbit. Although planetary migration could change these parameters, it is not expected that such an event could occur on such a short time scale. Additionally, a oddly shaped host star would explain the change, but the degree to which the star would have to be squished at the equator would be impossibly high given the slow rotation rate known for TrES-2.

Instead, the authors suggest “the existence of a third body in the form of an additional planet would provide a very natural explanation”. Although this explanation is anything but conclusive, it does pose an easily testable scenario. If the plane of the orbit of the system is very nearly along the line of sight, this provides the most ideal situation for attempting to detect planets using the radial-velocity of the parent star. The authors even go so far as to suggest a range of periods for a potential planet to have the observed effects. They state, “a planet of one Jovian mass with periods between 50 – 100 days would suffice to cause the observed inclination changes”.

Furthermore, the authors note that several similar systems are known to exist with a close in planet and a second massive planet in a longer orbit. “[I]n the system HIP 14810 there is a close-in planet with a 6.6 day period and a somewhat lighter planet with a period of 147 days, in the HD 160691 system the close-in planet has a period of 9.6 days and two outer planets with Jupiter masses are known with periods of 310 and 643 days.”