European Astronomers: ‘Era of Stellar Imaging’ Has Begun

The first VLTI image is that of the double star Theta1 Orionis C in the Orion Nebula Trapezium. From these, and several other observations, the team of astronomers, led by Stefan Kraus and Gerd Weigelt from the Max-Planck Institute in Bonn, could obtain the full orbit of the two stars in the system, and derive the total mass of the two stars (47 solar masses) and their distance from us (1350 light-years).
 

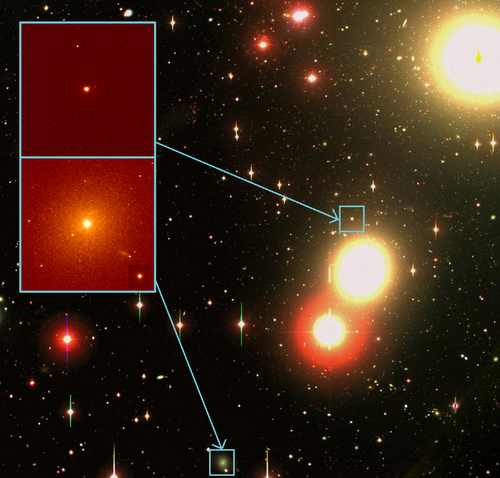
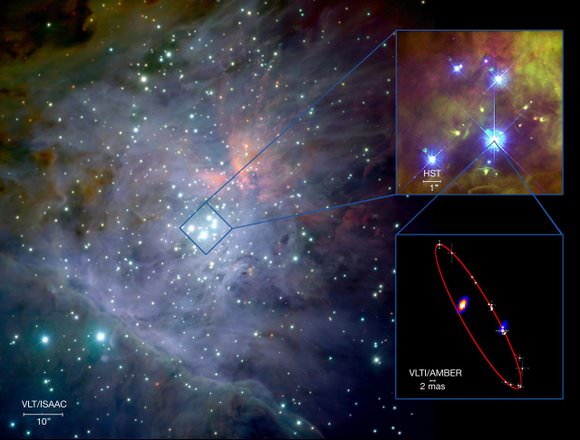
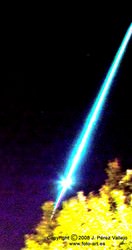
The first VLTI image shows the double star Theta1 Orionis C in the Orion Nebula Trapezium. Credit: ESO

European astronomers are celebrating two of the first images ever made using near-infrared interferometry, and say they herald the dawn of a new era of stellar imaging.

A German-led team has captured images of the double star system Theta1 Orionis C with ESO’s Very Large Telescope Interferometer, which emulates a virtual telescope about 100 meters (328 feet) across. That discovery could lead to a calculation of the orbits and mass of the system. And a team of French astronomers has captured an image of the star T Leporis revealing a spherical molecular shell around the aged star — which appears, on the sky, as small as a two-story house on the Moon. Both feats were announced today by the European Organisation for Astronomical Research in the Southern Hemisphere (ESO).

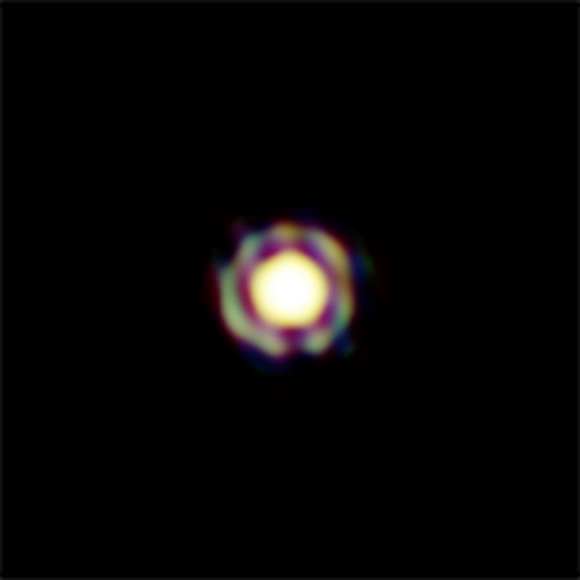
“We were able to construct an amazing image, and reveal the onion-like structure of the atmosphere of a giant star at a late stage of its life for the first time,” said the ESO’s Antoine Mérand, a member of the T Leporis research team. “Numerical models and indirect data have allowed us to imagine the appearance of the star before, but it is quite astounding that we can now see it, and in colour.”

This image from ESO’s Very Large Telescope Interferometer is one of the sharpest colour images ever made. It shows the Mira-like star T Leporis in great detail. The central disc is the surface of the star, which is surrounded by a spherical shell of molecular material expelled from the star. In order to appreciate the feat of such measurement, one should realize that the star appears, on the sky, as small as a two-storey house on the Moon. The resolution of the image is about 4 milli-arcseconds.
T Leporis at a resolution of about 4 milli-arcseconds, captured with the VLTI. Credit: ESO

Interferometry is a technique that combines the light from several telescopes, resulting in a vision as sharp as that of a giant telescope with a diameter equal to the largest separation between the telescopes used. Achieving this requires the VLTI system components to be positioned to extraordinary accuracy over the 100 meters (328 feet) and maintained throughout the observations — a formidable technical challenge.

When doing interferometry, astronomers must often content themselves with fringes, the characteristic pattern of dark and bright lines produced when two beams of light combine, from which they can model the physical properties of the object studied. But, if an object is observed on several runs with different combinations and configurations of telescopes, it is possible to put these results together to reconstruct an image of the object. This is what has now been done with ESO’s VLTI, using the 1.8-meter (6 foot) auxiliary telescopes.

The new T Leporis results are set to appear in a letter to the editor in Astronomy and Astrophysics, by lead author Jean-Baptiste Le Bouquin, also of the ESO, and his colleagues. The image of  Theta1 Orionis C, in the Orion Nebula Trapezium, is reported in an Astronomy and Astrophysics article led by Stefan Kraus at the Max-Planck-Institut für Radioastronomie in Germany. 

Although it is only 15 by 15 pixels across, the reconstructed image of T Leporis shows an extreme close-up of a star 100 times larger than the Sun, a diameter corresponding roughly to the distance between the Earth and the Sun. This star is, in turn, surrounded by a sphere of molecular gas, which is about three times as large.

T Leporis, in the constellation of Lepus (the Hare), is located 500 light-years from Earth. It belongs to the family of Mira stars, well known to amateur astronomers. These are giant variable stars that have almost extinguished their nuclear fuel and are losing mass. They are nearing the end of their lives as stars, and will soon die, becoming white dwarfs. The Sun will become a Mira star in a few billion years, engulfing the Earth in the dust and gas expelled in its final throes.

Mira stars are among the biggest factories of molecules and dust in the Universe, and T Leporis is no exception. It pulsates with a period of 380 days and loses the equivalent of the Earth’s mass every year. Since the molecules and dust are formed in the layers of atmosphere surrounding the central star, astronomers would like to be able to see these layers. But this is no easy task, given that the stars themselves are so far away — despite their huge intrinsic size, their apparent radius on the sky can be just half a millionth that of the Sun.

“Obtaining images like these was one of the main motivations for building the Very Large Telescope Interferometer,” Mérand said. “We have now truly entered the era of stellar imaging.”

Source: ESO

NASA Study Predicted Outbreak of Deadly Virus

Scientists have long suspected that climatic variables like sea surface temperature and precipitation could foreshadow outbreaks of disease. Now, they have confirmation.

Responding to a deadly 1997 outbreak of the mosquito-borne disease Rift Valley fever, researchers had developed a “risk map,” pictured above, using NASA and National Oceanic and Atmospheric Administration measurements of sea surface temperatures, precipitation, and vegetation cover. As reported in a recent NASA-led study, the map gave public health officials in East Africa up to six weeks of warning for the 2006-2007 outbreak of the deadly Rift Valley fever in northeast Africa — enough time to lessen human impact.

On the map above, pink areas depict increased disease risk, while pale green areas reflect normal risk. Yellow dots represent reported Rift Valley fever cases in high-risk areas, while blue dots represent occurrences in non-risk areas. The researchers have detailed the map’s effectiveness in the Proceedings of the National Academy of Sciences.

313585main_riftvalley_scientists_hi
Scientists study a typical dambo habitat at Sukari Farm, a long-term Rift Valley Fever study site just outside Nairobi, Kenya. Dambos are natural breeding grounds for disease-carrying mosquitoes and can be observed from space with the aid of satellites. Credit: Assaf Anyamba

During an intense El Niño event in 1997, the largest known outbreak of Rift Valley fever spread across the Horn of Africa. About 90,000 people were infected with the virus, which is carried by mosquitoes and transmitted to humans by mosquito bites or through contact with infected livestock. That outbreak prompted the formation of a working group — funded by the U.S. Department of Defense Global Emerging Infections Surveillance and Response System — to try to predict future outbreaks.

The working group didn’t start from scratch. The link between the mosquito life cycle and vegetation growth was first described in a 1987 Science paper by co-authors Kenneth Linthicum of the U.S. Department of Agriculture and Compton Tucker of NASA’s Goddard Space Flight Center. Later, a 1999 Science paper described a link between Rift Valley fever and the El Niño-Southern Oscillation, a cyclical, global phenomenon of sea surface temperature changes that can contribute to extreme climate events around the world.

Building on that research, Assaf Anyamba of NASA Goddard and the University of Maryland, and his colleagues, set out to predict when conditions were ripe for excessive rainfall — and thus an outbreak. They started by examining satellite measurements of sea surface temperatures. One of the first indicators that El Niño will boost rainfall is a rise in the surface temperature of the eastern equatorial Pacific Ocean and the western equatorial Indian Ocean. Perhaps the most telling clue is a measure of the mosquito habitat itself. The researchers used a satellite-derived vegetation data set that measures the landscape’s “greenness.” Greener regions have more than the average amount of vegetation, which means more water and more potential habitat for infected mosquitoes. The resulting risk map for Rift Valley fever, showing areas of anomalous rainfall and vegetation growth over a three-month period, is updated and issued monthly as a means to guide ground-based mosquito and virus surveillance.

As early as September 2006, the monthly advisory from Anyamba and colleagues indicated an elevated risk of Rift Valley fever activity in East Africa. By November, Kenya’s government had begun collaborating with non-governmental organizations to implement disease mitigation measures—restricting animal movement, distributing mosquito bed nets, informing the public, and enacting programs to control mosquitoes and vaccinate animals. Between two and six weeks later—depending on the location—the disease was detected in humans.

After the 2006-2007 outbreak, Anyamba and colleagues assessed the effectiveness of the warning maps. They compared locations that had been identified as “at risk” with the locations where Rift Valley fever was reported. Of the 1,088 cases reported in Kenya, Somalia, and Tanzania, 64 percent fell within areas delineated on the risk map. The other 36 percent of cases did not occur within “at risk” areas, but none were more than 30 miles away, leading the researchers believe that they had identified most of the initial infection sites.

The potential for mapping the risk of disease outbreaks is not limited to Africa. Previous research has shown that risk maps are possible whenever the abundance of a virus can be linked to extremes in climate conditions. Chikungunya in east Africa and Hantavirus and West Nile virus in the United States, for example, have been linked to conditions of rainfall extremes.

“We are coming up on almost 30 years of vegetation data from satellites, which provides us with a good basis for predicting,” said Linthicum, co-author on the 1987 paper, upon his return from a Rift Valley fever workshop in Cairo, Egypt last month. “At this meeting, it was clear that using this tool as a basis for predictions has become accepted as the norm.”

Sources: NASA and the Proceedings of the National Academy of Sciences

New Theory: Bizarre Martian Deposits from Vast Ice at Equator

Ice core from Mars? Not quite. But this aggregation of soil grains, from Antarctica ice, derived from the same process now proposed for the Red Planet (Credit: Hans Paerl, University of North Carolina at Chapel Hill).

[/caption]

Ice core from Mars? Not quite. But this aggregation of soil grains, from Antarctica ice, derived from the same process now proposed for the Red Planet (Credit: Hans Paerl, University of North Carolina at Chapel Hill)

The puzzling Meridiani Planum deposits on Mars — discovered by NASA’s Opportunity rover — could be remnants of a massive ancient ice field, according to a new study online in Nature Geoscience.

Paul Niles of NASA’s Johnson Space Center and Joseph Michalski, of Université Paris-Sud, analysed the chemistry, sedimentology and geology of the Meridiani Planum deposits using data from Opportunity. They suggest that sulphate formation and chemical weathering occurred within an ice deposit as massive as today’s polar ice caps on Mars. Once the ice sublimed away in a warmer climate, the remaining sediments kept their chemical signature, the authors suggest.

The new theory gets around a weakness in the previous belief, that the deposits were formed in a wet, shallow basin — because no evidence of such a basin has been found yet. But it comes with its own baggage: there’s not much evidence of massive ice in the region, either.

The Meridiani represent one of the flattest areas on the Martian surface, with long, rolling smooth plains, linear dunes and ridges. Based on the number of craters, scientists have speculated that it formed early in the Hesperian Era, roughly 3.8 billion years ago.

The intriguing place — right at the crosshairs of zero degrees longitude and zero degrees latitude — was initially spotted by the Mars Thermal Emission Spectrometer aboard NASA’s Mars Global Surveyor (1996-2006). It was then chosen as the landing site for NASA’s rover Opportunity, in 2004.

“Immediately upon touchdown, when we turned on the cameras for the first time and looked out on the plains, it became obvious that it was a different kind of place on Mars than we’d ever been before,” Michalski said.

Since then, the place has been the object of numerous chemistry studies which have generated a handful of competing theories about how its odd sulfate deposits might have formed. The prevailing theory, fronted by scientists on the Mars Exploration Rovers team, has it that the Meridiani Planum was once a shallow evaporation basin which was periodically wet, where wind helped drive away the moisture and left the deposits behind. Other scientists have proposed a catastrophic event like a volcano or major impact, perhaps with volcanic aerosols altering layered rocks at the surface.

Microscopic image of Meridiani Planum sediments. Image of outcrop of sediments at Meridiani Planum inside Endurance crater taken by the microscopic imager on sol 145 (Credit: NASA/JPL/Cornell/USGS).

But Michalski and Niles say the deposits formed when the area was covered with thick ice. Dust trapped within the ice would have warmed in the presence of sunlight, causing minor melting nearby. And because the ice also contained volcanic aerosols, the water that formed would have been highly acidic, and reacted with the dust, yielding the perplexing products in pockets within the ice that became the deposits when the ice sublimed. The same process happens to a limited extent in the Earth’s polar regions, Michalski said. The Meridiani Planum is near the equator, where large ice fields are lacking today. The authors propose that the ice could have formed in ancient times, when the poles were in a different place or when the Martian axis of rotation was at a different angle.

Michalski said the new theory gets around a lot of the sticking points in the older ones.

“It doesn’t require a basin to be present; it doesn’t require the groundwater,” he said. “We like a lot of aspects of the MER team’s hypothesis. One of the big problems is that you have to have a lot of acidic water in that situation.”

Brian Hynek, an atmospheric and space physicist at the University of Colorado in Boulder, had proposed a volcanic origin for the deposits in the past, but he said there are strengths to the new theory as well. For starters, he said, the ice pocket hypothesis could explain why salts of varying water solubility co-exist so closely in the Meridiani Planum deposits.

“The volume of the Meridiani deposits is similar to the amount of sediment contained within the layered ice-rich deposits at Mars’s south pole,” he added. “And sublimation of a sufficiently large dusty ice deposit would provide a convincing source for all the sediment, which other models have failed to provide.”

But he said there are shortfalls to the new theory too: No model has allowed for the necessarily massive ice deposits at the Martian equator, for example, and it’s curious how the dust and aerosols “could aggregate into consistent sand-sized particles” in the examined bedrock.

Hynek said of all the theories that could explain the strange deposits in the Meridiani Planum, none has emerged yet as a clear winner: “All have their strengths and all have significant weaknesses. I don’t think we’ve solved this mystery yet.”

Michalski is less cautious about the implications of the new work.

“We’re able to propose this process for the Meridiani deposits because there are a lot of data,” he said. “We think that it’s likely that the other sulfate deposits on Mars could have been formed by the same mechanism.”

Sources: Joseph Michalski and Brian Hynek

Q&A with Kepler Scientist from — Iowa?

Artist's rendering of the Kepler Mission (NASA)

[/caption]

kawaler

With a target launch date of March 5, NASA’s Kepler mission is just weeks away from its tantalizing journey to peer at faraway stars and the Earth-like planets they may be hosting. Hundreds of astronomers from all over the world have a stake in the data. The United States participants hail from all the usual astronomy hubs, among them Arizona, California, Texas and … Iowa? Steve Kawaler, an astrophysicist at Iowa State University, took a moment to chat with Universe Today about his role in a less-publicized goal of the Kepler mission — and his research out of a less-publicized astronomy program.

Q. Why Iowa?

Kawaler: Iowa’s a great place. I’m originally a New Yorker, and went to grad school at the University of Texas, but landing at Iowa State (mostly by chance) still feels right. 

(Still Kawaler:) You can get a lot of work done here. We’ve organized and run the Whole Earth Telescope from here for about 10 years. A few years ago [in 2004], the WET team showed a pulsating white dwarf (BPM 37093, but later dubbed the ‘Diamond Star’) may truly be crystalline. Finding one of the biggest diamonds in the cosmos and announcing it around Valentine’s Day was pretty fun! I’ve been part of some big collaborations where nearly all the work is done remotely, and that is important as we stare at the mountain of data we’re about to see.

Q. What’s your role in the Kepler mission?

Kawaler: I serve on the Steering Committee for the Kepler Asteroseismology Research Consortium. We’ll use the exquisite time-series measurements of the brightness of over 100,000 stars to measure their internal properties.  The KASC has over 250 scientists involved, and the Steering Committee is charged with helping organize and coordinate their efforts in reducing and interpreting the data.

Q. What’s most exciting about the science in this mission?

Kawaler: The most exciting discovery will be the discovery of Earth-like planets around other stars. It’s what we all wonder about – are there other planets out there that host life?  That said, most of the stars that Kepler examines won’t show any signs of planetary transits … but the data will provide a gold mine of information about how stars behave. From the point of view of my own research, the most exciting thing that will come out will be improvement, by a factor of almost 100, in the measure of brightness of over 100,000 stars. Asteroseismologists are drooling at this prospect, because we expect to find oscillations in many stars, but this huge increase in sensitivity is bound to reveal new phenomena that we can’t even guess at yet. 

Q. A press release described part of your interest as “peering into stars.” Can you elaborate?

Kawaler: Until very recently, everything we know about stars, we learned from looking at the outsides. When you want to really need to know what’s going on, you need some sort of probe that goes beneath the surface.  For the Earth, seismic waves generated by earthquakes give you that kind of probe.  For stars, we have to measure their vibrations from (very!) far away.  Those vibrations produce only tiny signals — very subtle brightness variations. We can also look at how the surfaces move up and down and use those as a measure of the oscillations that are going on inside. Once we do make those measurements, we use the tools that terrestrial seismologists have developed, along with some of our own that are adapted to the special circumstances within stars, to probe the insides of the stars.

Q. Why can’t we do this work from Earth?

Kawaler: The short answer is that we can, sort of, but Earth is a really poor place to do this kind of work.  An astronomer can only look at a star for a couple hours a night before the star sets or the sun comes up. It’s kind of the equivalent of listening to Beethoven’s 5th Symphony and listening to every third note. You can sort of do it from the ground by putting together a network of telescopes.  We’ve had some remarkable successes.  But it’s much easier if you can observe from a platform that isn’t rotating. And if that platform is above the atmosphere, you get the added benefit of a direct line of sight to the star that doesn’t have the atmosphere degrading the image.  With continuous views and no atmosphere, Kepler can do way, way better than we can from the ground.

6. Is this helping to realize a life-long ambition for you?

Kawaler: Absolutely – I’ve always been a space program ‘geek.’ I grew up in the 60s. My older brother grew up in the 50s, and he got caught up in the whole Sputnik thing. There were all these books and toys about space; I picked them up and was instantly fascinated. Later, I was just riveted to the TV all the time, watching Gemini and the Apollo missions. I guess I still haven’t grown out of it. My brother is one of the few rabbis that dresses as Captain Kirk on Purim, Jewish Halloween, so I guess he didn’t grow out of it, either. I’m actually heading down to Florida for the launch, with my father, so he can finally be convinced I didn’t have to be a ‘real doctor’ — I can be a PhD.

Sources: Steve Kawaler, NASA

kepler-1
Kepler's search space in the Milky Way, courtesy of NASA.

Climate Change Satellite gets Green Light for Launch

The European Space Agency’s Soil Moisture and Ocean Salinity (SMOS) satellite has been cleared for takeoff, following nearly a year in limbo while the mission team awaited the go-ahead from a private launch company.

Originally expected to launch in 2008, SMOS has been in storage at Thales Alenia Space’s facilities in Cannes, France since last May, awaiting a  launch appointment at the Russian Plesetsk Cosmodrome, north of Moscow. If all goes according to plan, the craft will now launch between July and October, the second ESA mission in a series of six designed to observe Earth from space and bolster an understanding of climate change. The first of the satellites in its new Living Planet Program, The Gravity field and steady-state Ocean Circulation Explorer (GOCE), is scheduled to go up March 16. 


Over its lifetime of about 20 months, GOCE will map global variations in the gravity field – crucial for deriving accurate measurements of ocean circulation and sea-level change, both of which are affected by climate change.

SMOS, circulating at a low orbit of around 750 km (466 miles) above the Earth,  will be the first mission dedicated to mapping soil moisture and ocean salinity. Salinity in the oceans has a significant impact on ocean circulation, which in turn helps drive the global climate. Among other applications, understanding the salinity and temperature of the seas will lead to easier predictions of the zones where hurricanes intensify. A specialized radiometer has been developed for the mission that is capable of observing both soil moisture and ocean salinity by capturing images of emitted microwave radiation around the frequency of 1.4 GHz (L-band). SMOS will carry the first-ever, polar-orbiting, space-borne, 2-D interferometric radiometer. The mission is designed to last three years.

Here’s a rundown of the final four planned crafts in the series:

  • ADM-Aeolus (Atmospheric Dynamics Mission), with a 2010 launch date, will collect data about the global wind profile to improve weather forecasting.
  • CryoSat-2, set to launch in late 2009, will determine variations in the thickness of the Earth’s continental ice sheets and marine ice cover to further our understanding of the relationship between ice and global warming. CryoSat-2 replaces CryoSat, which was lost at launch in 2005.
  • Swarm, due for launch in 2010, is a constellation of three satellites to study the dynamics of the magnetic field to gain new insights into the Earth system by studying Earth’s interior and its environment.  
  • EarthCARE (Earth Clouds Aerosols and Radiation Explorer), lanching in 2013, is a joint European-Japanese mission that aims to improve the representation and understanding of the Earth’s radiative balance in climate and numerical weather forecast models.
Source: ESA

Last Summer’s Fireball in Pieces on the Ground?

 
The Bejar bolide photographed from Torrelodones, Madrid, Spain. The incoming fireball is the streak to the right of the floodlit house. The bright light at the top is the overexposed Moon. Credit: J. Perez Vallejo/SPMN.

Astronomers have analyzed the cometary fireball that blazed across the sky over Europe last year and concluded it was a dense object, about a meter (3.2 feet) across and with a mass of nearly two tons — large enough that some fragments probably survived intact and fell to the ground as meteorites.

Last July, people in Spain, Portugal and France watched the brilliant fireball produced by a boulder crashing down through the Earth’s atmosphere. In a paper to be published in the journal Monthly Notices of the Royal Astronomical Society, astronomer Josep M. Trigo-Rodríguez, of the Institute of Space Sciences in Spain, and his co-authors present dramatic images of the event. The scientists also explain how the boulder may originate from a comet which broke up nearly 90 years ago, and suggest that chunks of the boulder (and hence pieces of the comet) are waiting to be found on the ground.

“If we are right, then by monitoring future encounters with other clouds of cometary debris, we have the chance to recover meteorites from specific comets and analyse them in a lab,” Dr Trigo-Rodríguez said. “Handling pieces of comet would fulfil the long-held ambitions of scientists — it would effectively give us a look inside some of the most enigmatic objects in the Solar System.”

Fireballs (or bolides) are the name given by astronomers to the brightest meteors, popularly referred to as shooting stars. On the afternoon of July 11, a brilliant fireball was recorded over southwestern Europe. At maximum intensity, the object was more than 150 times brighter than the full Moon. It was first picked up at a height of 61 miles (98.3 km) and disappeared from view 13 miles (21.5 km) above the surface of the Earth, tracked by three stations of the Spanish Fireball Network above Bejar, near Salamanca in Spain. At the same time, a professional photographer took a picture of the fireball from the north of Madrid.

A close-up image of the Bejar bolide, photographed from Torrelodones, Madrid, Spain. Credit: J. Perez Vallejo/SPMN.

From these images, the astronomers have demonstrated that before its fiery demise, the boulder traveled on an unusual orbit around the Sun, which took it from beyond the orbit of Jupiter to the vicinity of Earth. This orbit is very similar to that of a cloud of meteoroids known as the Omicron Draconids, which on rare occasions produces a minor meteor shower and probably originates from the breakup of Comet C/1919 Q2 Metcalf in 1920. The authors suggest the boulder was once embedded in the nucleus of that comet.

Comet C/1919 Q2 Metcalf was discovered by Joel Metcalf from Vermont in August 1919, and was visible until February 3, 1920. The orbit was not well determined and no subsequent appearances are known. The Omicron Draconids meteor stream was discovered to be following a similar orbit to this comet by Allan F. Cook in 1973. The stream characteristically produces bright fireballs and rare meteor outbursts.

In the mid-1980s, the astronomers Tamas I. Gombosi and Harry L.F. Houpis first suggested that the nuclei of comets consist of relatively large boulders cemented together by a ‘glue’ of smaller particles and ice. If the rocky and icy nucleus of a comet disintegrates, then these large boulders are set loose into space. If the Bejar bolide was formed in this way, it confirms the glue model for at least some comets.

Source: Royal Astronomical Society

New high-res maps suggest little water in moon

Lunar global topographic map obtained from Kaguya (SELENE) altimetry data shown in Hammer equal-area projection. Credit: Hiroshi Araki et al. 2009

[/caption]

New maps of the moon from Japan’s Kaguya (SELENE) satellite suggest a lunar surface too rigid to allow for any liquid water, even deep below.

The new view is unveiled in one of three new papers in this week’s issue of the journal Science based on Kaguya (SELENE) data. In it, lead author Hiroshi Araki, from the National Astronomical Observatory of Japan, and international colleagues report that the Moon’s crust seems to be relatively rigid compared to Earth’s and may therefore lack water and other readily evaporating compounds. The new map is the most detailed ever created of the Moon, and reveals never-before-seen craters at the lunar poles.

“The surface can tell us a lot about what’s happening inside the Moon, but until now mapping has been very limited,” said C.K. Shum, professor of earth sciences at Ohio State University, and a study co-author. “For instance, with this new high-resolution map, we can confirm that there is very little water on the Moon today, even deep in the interior. And we can use that information to think about water on other planets, including Mars.”

Using the laser altimeter (LALT) instrument on board the Japanese Selenological and Engineering Explorer (SELENE) satellite, Araki and his colleagues mapped the Moon at an unprecedented 15-kilometer (9-mile) resolution. The map is the first to cover the Moon from pole to pole, with detailed measures of surface topography, on the dark side of the moon as well as the near side. The highest point — on the rim of the Dririchlet-Jackson basin near the equator — rises 11 kilometers (more than 6.5 miles) high, while the lowest point — the bottom of Antoniadi crater near the south pole — rests 9 kilometers (more than 5.5 miles) deep. In part, the new map will serve as a guide for future lunar rovers, which will scour the surface for geological resources.

But the team did something more with the map: they measured the roughness of the lunar surface, and used that information to calculate the stiffness of the crust. If water flowed beneath the lunar surface, the crust would be somewhat flexible, but it isn’t, the authors say. They add that the surface is too rigid to allow for any liquid water, even deep within the Moon. Earth’s surface is more flexible, by contrast, with the surface rising or falling as water flows above or below ground. Even Earth’s plate tectonics is due in part to water lubricating the crust.

Araki and his team say Mars, on a scale of surface roughness, falls somewhere between the Earth and the Moon — which suggests there may have once been liquid water, but that the surface is now very dry.

In the second Kaguya/SELENE study, lead author Takayuki Ono of Japan’s Tohoku University and colleagues describe debris layers between the near-side basalt flows, which suggest a possible period of reduced volcanism in the Moon’s early history. They propose that global cooling was probably a dominant driver of the shaping of lunar maria on the moon’s near side starting about 3 billion years ago. 

The third paper was authored by Noriyuki Namiki of Japan’s Kyushu University and his colleagues, who report gravity anomalies across the Moon’s far side indicating a rigid crust on the far side of the early Moon, and a more pliable one on the near side.

Source: Science

Polar topographic maps obtained from Kaguya (SELENE) 
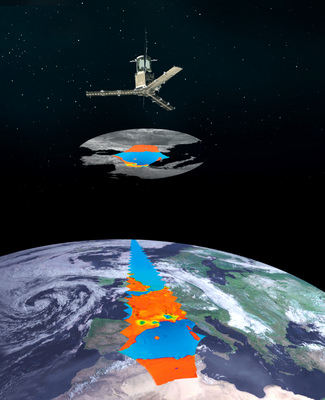
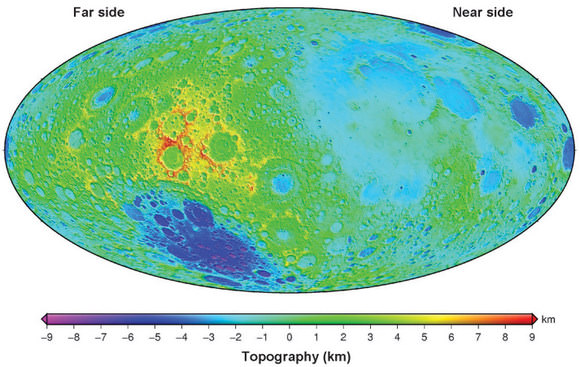
altimetry data. Credit: Hiroshi Araki et al. 2009

Ultra Compact Dwarf Galaxies once crowded with stars

The background image was taken by Michael Hilker of the University of Bonn using the 2.5-metre Du Pont telescope, part of the Las Campanas Observatory in Chile. The two boxes show close-ups of two UCD galaxies in the Hilker image. These images were made using the Hubble Space Telescope by a team led by Michael Drinkwater, at the University of Queensland

Astronomers think they’ve found a way to explain why Ultra Compact Dwarf Galaxies, oddball creations from the early universe, contain so much more mass than their luminosity would explain.

Pavel Kroupa, an astronomer at the University of Bonn in Germany, led a research team that’s proposing the unexplained density may actually be a relic of stars that were once packed together a million times more closely than in the solar neighbourhood. The new paper appears in the Monthly Notices of the Royal Astronomical Society.

UCDs were discovered in 1999. At about 60 light years across, they are less than 1/1000th the diameter of the Milky Way — but much more dense. Astronomers have proposed they formed billions of years ago from collisions between normal galaxies. Until now, exotic dark matter has been suggested to explain the ‘missing mass.’

The authors of the new study think that at one time, each UCD had an incredibly high density of stars, with perhaps 1 million in each cubic light year of space, compared with the 1 that we see in the region of space around the Sun. These stars would have been close enough to merge from time to time, creating many much more massive stars in their place. The more massive stars would consume hydrogen rapidly, before ending their lives in violent supernova explosions, leaving either superdense neutron stars or black holes as their remains. 

In today’s UCDs, the authors think, the previously unexplained mass comprises these dark remnants, largely invisible to Earth-based telescopes.

“Billions of years ago, UCDs must have been extraordinary,” study co-author Joerg Dabringhausen, also of the University of Bonn, said in a press release. “To have such a vast number of stars packed closely together is quite unlike anything we see today. An observer on a (hypothetical) planet inside a UCD would have seen a night sky as bright as day on Earth.”

PHOTO CAPTION: Background image taken by Michael Hilker of the University of Bonn using the 2.5-metre Du Pont telescope, part of the Las Campanas Observatory in Chile. The two boxes show close-ups of two UCD galaxies in the Hilker image. These images were made using the Hubble Space Telescope by a team led by Michael Drinkwater, at the University of Queensland.

Source: Royal Astronomical Society

Fermi, Swift spy outburst from gamma-ray star

Gamma-rays flares from SGR J1550-5418 may arise when the magnetar's surface suddenly cracks, releasing energy stored within its powerful magnetic field. Credit:NASA/Goddard Space Flight Center Conceptual Image Lab

[/caption]

NASA’s Swift satellite and Fermi Gamma-ray Space Telescope have keyed in on a rowdy stellar remnant 30,000 light-years away. The object, already known as a source of pulsing radio and X-ray signals, lies in the southern constellation Norma. It kicked out some moderate eruptions in October, but then it settled down again. Late last month, it roared to life.

“At times, this remarkable object has erupted with more than a hundred flares in as little as 20 minutes,” said Loredana Vetere, who is coordinating the Swift observations at Pennsylvania State University. “The most intense flares emitted more total energy than the sun does in 20 years.”

The new object has been cataloged as SGR J1550-5418. Because of the recent outbursts, astronomers will classify it as a soft-gamma-ray repeater. Only six such objects are known to science, and they share the trait that they unpredictably send out a series of X-ray and gamma-ray flares. In 2004, a giant flare from another soft-gamma-ray repeater was so intense it measurably affected Earth’s upper atmosphere from 50,000 light-years away.

The source of the wild emissions is probably a spinning neutron star — the superdense, city-sized remains of an exploded star. Measuring only about 12 miles (19 kilometers) across, a neutron star is more massive than the sun.

While neutron stars typically possess intense magnetic fields, a subgroup displays fields 1,000 times stronger. These so-called magnetars have the strongest magnetic fields of any known objects in the universe. SGR J1550-5418, which rotates once every 2.07 seconds, holds the record for the fastest-spinning magnetar. Astronomers think magnetars power their flares by tapping into the tremendous energy of their magnetic fields.

Fermi’s gamma-ray burst monitor is designed to investigate magnetar flares, and SGR J1550-5418 has already triggered the instrument more than 95 times since Jan. 22. Swift’s X-ray telescope captured the first “light echoes” ever seen from a oft-gamma-ray repeater when SGR J1550-5418 started exploding. Both the halo-like rings and their apparent expansion are an illusion caused by the finite speed of light and the longer path the scattered light must travel. NASA’s Wind satellite, the joint NASA-Japan Suzaku mission, and the European Space Agency’s INTEGRAL satellite also have detected flares from SGR J1550-5418.

Swift's X-Ray Telescope (XRT) captured an apparent expanding halo around the flaring neutron star SGR J1550-5418. The halo formed as X-rays from the brightest flares scattered off of intervening dust clouds. Credit: NASA/Swift/Jules Halpern (Columbia Univ.)
Source: NASA

ESA extends Mars, Venus, Earth missions

Artist's impression of Mars Express (ESA)

[/caption]

The European Space Agency has extended operations of three missions: Mars Express, Venus Express and Cluster, until the end of the year, citing “excellent” research returns from all three missions. Each mission has been extended at least once in its history, said Monica Talevi, an ESA spokeswoman — but they’re all worth it.

“The scientific community recognizes and ESA recognizes that these missions have provided excellent results,” she said.

Mars Express

The first European mission to the Red Planet, Mars Express has been orbiting Mars since the end of 2003.  Besides high-resolution color images of the Martian surface, the spacecraft has also beamed back mineralogical evidence for the presence of liquid water throughout Martian history and studied the density of the Martian crust in detail. Mars Express was the first spacecraft to detect methane in the planet’s atmosphere from orbit. Its radar instrument, the first flown to Mars, has returned pioneering sub-surface sounding measurements that show underground deposits of water ice. The mission has also pioneered insights into the Martian atmosphere, including the detection of aurorae at mid-latitudes and new estimates for the rate at which Mars’ atmosphere escapes into space.

The mission has been extended twice in the past, with the most recent lasting until May 2009. This third extension will make it possible to continue with the mission’s study of the Red Planet which includes, among other inquiries: the study of its subsurface, the observation of the upper atmospheric layers under varying solar conditions, observation of methane in the atmosphere and high resolution mapping of its surface.

Venus Express 
 
Since it reached Venus in April 2006, Venus Express has been mapping Venus’s noxious and thick atmosphere globally and in 3D for the first time. With the data, scientists have put together extensive meteorological maps of Venus, providing measurements of wind fields and temperatures and the chemical composition of the atmosphere.

Venus Express is studying largely unknown phenomena in the Venusian atmosphere like never before. Image by AOES Medialab, courtesy of ESA.
Venus Express is studying largely unknown phenomena in the Venusian atmosphere. Image by AOES Medialab, courtesy of ESA.

The spacecraft has peered at the planet’s dynamic cloud system, including its striking double-eyed atmospheric vortex that dominates the south pole. It’s found water molecules escaping into space, concrete evidence for lightning in the Venusian atmosphere, and infrared glimpses of the hot surface.

Previously extended once to last until May 2009, the next extended phase will be used to improve scientists’ understanding of how Venus’ climate works, and search for suspected active volcanism on the planet’s surface.

Cluster 

The Cluster constellation was launched in summer 2000 and started operating in early 2001. Since then, the four-satellite mission has been spying on the Earth’s own magnetosphere, the magnetic bubble surrounding our planet. Its work is yeilding new insights into the way solar activity affects the near-Earth environment.

ESAs Cluster mission comprises four identical spacecraft flying in formation 19,000 to 119,000 km (11,800 to 74,000 miles) above Earth. Courtesy of ESA.
ESA's Cluster mission comprises four identical spacecraft flying in formation 19,000 to 119,000 km (11,800 to 74,000 miles) above Earth. Courtesy of ESA.

Cluster pioneered measurements of electric currents in space, revealed the nature of black aurorae, and discovered that plasma — a gas of charged particles surrounding Earth — makes ‘waves.’ The mission also provided the first 3D observation of magnetic reconnection in space — a phenomenon that reconfigures the magnetic field and releases high amounts of energy.

The Cluster mission has been extended twice in the past, up to June 2009. The new extension will make it possible to study the auroral regions above Earth’s poles and widen the investigations of the magnetosphere, particularly its inner region.

Source: ESA