
[/caption]
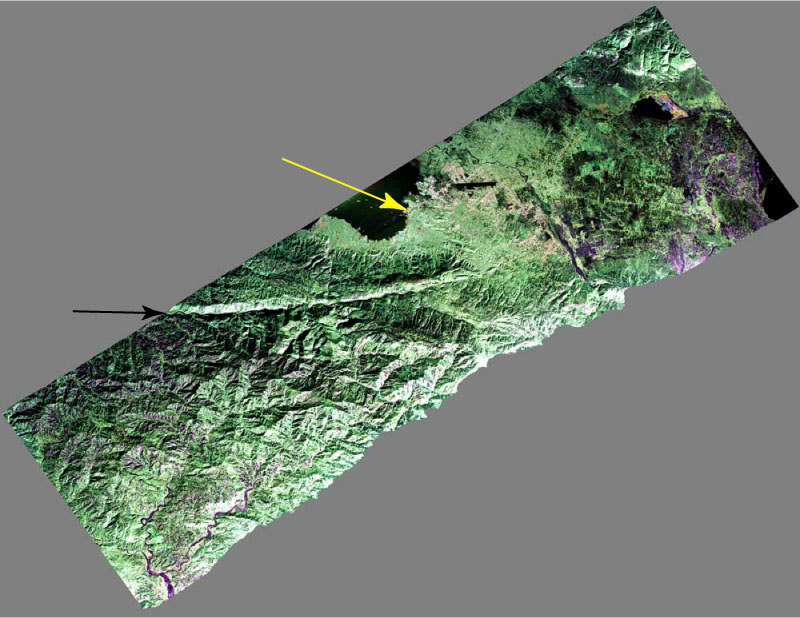
A modified NASA Gulfstream III aircraft began a three-week campaign to provide a close-up study of the fault lines in Haiti with radar. This first image, captured on Jan. 27, 2010 is a false-color composite image of the city of Port-au-Prince, Haiti, (near the center of the image) and the surrounding region. This image and subsequent images taken by the Uninhabited Aerial Vehicle Synthetic Aperture Radar (UAVSAR) will be combined to measure the motion of Earth’s surface. The earthquake in Haiti on January 12, 2010 has increased the stress on this fault line, significantly increasing the risk of a future earthquake, according to a recent report by the U.S. Geological Survey.
The UAVSAR uses a technique called interferometry. The polarimetric L-band synthetic aperture radar (SAR) specifically designed to acquire airborne repeat track SAR data for differential interferometric measurements, and these measurements will allow scientists to study the pressures building up and being released on the fault at depth.
 in flight with the UAVSAR instrument. Credit: NASA")
Shortly before 5 p.m. local time on Jan. 12, 2010, a magnitude 7.0 earthquake struck southern Haiti. The earthquake’s epicenter was about 25 kilometers (15 miles) west-southwest of Port-au-Prince, close to the west (left) edge of this image. The large linear east-west valley in the mountains south of the city is the location of the major active fault zone responsible for the earthquake: the Enriquillo-Plantain Garden fault.
The fault extends from the western tip of Haiti past Port-au-Prince into the Dominican Republic to the east of this image.
Satellite interferometric synthetic aperture radar measurements show that the Jan. 12 earthquake ruptured a segment of the fault extending from the epicenter westward over a length of about 40 kilometers (25 miles), leaving the section of the fault in this image unruptured.
Historical records show that the southern part of Haiti was struck by a series of large earthquakes in the 1700s, and geologists believe those were also caused by ruptures on this fault zone.
The large dark line running east-west near the city is the main airport.
The colors in the image reflect the three different UAVSAR radar polarizations: HH (horizontal transmit, horizontal receive) is colored red; VV (vertical transmit, vertical receive) is colored blue; and HV (horizontal transmit, vertical receive) is colored green. Like a pair of Polaroid sunglasses, these images are sensitive to different parts of the radar signal that is reflected back from Earth’s surface. The HV polarization is sensitive to volume scattering that typically occurs over vegetation—this gives hills a greenish color. VV polarization is sensitive to surface scattering such as that returned from bare surfaces or water—this gives water a bluish tint. Finally, HH polarization is sensitive to corner-like objects—this gives some urban areas and vegetated regions a reddish tint. The image is roughly 20 kilometers (12.5 miles) wide in the northwest-southeast direction. North is up and radar illumination is from the southeast.
Source: NASA