
The Sun isn’t the only star in this galactic neighbourhood. Other stars also call this neighbourhood home. But what’s the neighbourhood’s history? What triggered the birth of all those stars?
A team of astronomers say they’ve pieced the history together and identified the trigger: a series of supernovae explosions that began about 14 million years ago.
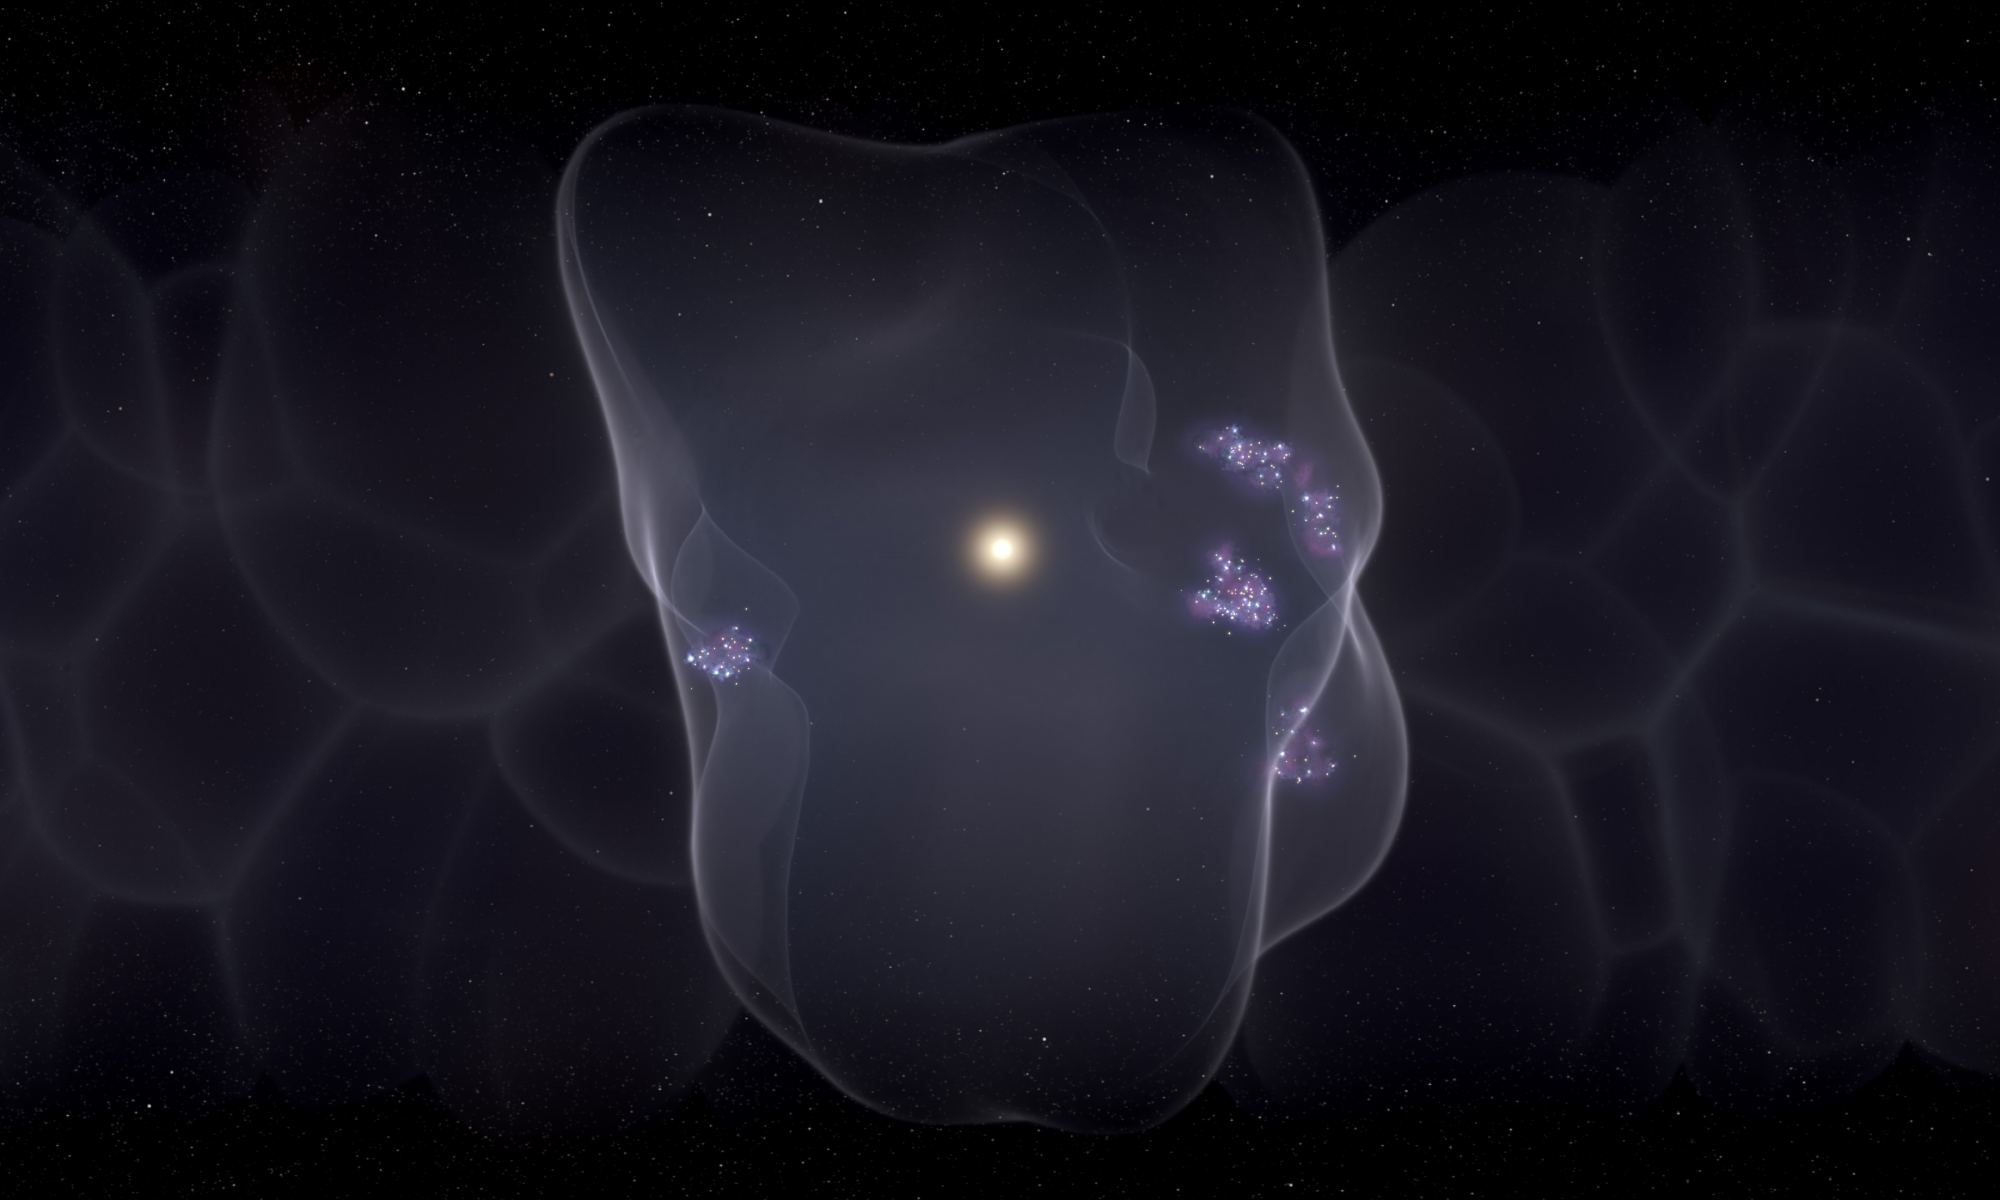
A series of stars in our neighbourhood exploded as supernovae starting about 14 million years ago. They created a vast bubble of gas about 1,000 light-years across called the Local Bubble. In the middle of that void sits the Sun. The Sun’s neighbours formed on the edge of that bubble, and the preceding supernova explosions were the catalyst for their formation.
A new study published in the journal Nature presents the findings. The title is “Star formation near the Sun is driven by expansion of the Local Bubble.” Catherine Zucker is the lead author and she’s an astronomer and data visualization expert.
“We’ve calculated that about 15 supernovae have gone off over millions of years to form the Local Bubble that we see today.”
Catherine Zucker, lead author, NASA Hubble Fellow at STScI.
Stars form from clouds of hydrogen gas called Giant Molecular Clouds (GMC.) For a star to form, enough of the gas has to gather in one spot. This happens when the density of the gas varies. Due to gravity, density begets more density, and if enough time passes and if conditions are right, sufficient gas clumps together to trigger fusion, and a star is born.
But stars can also form when supernovae explode. Supernova explosions release a tremendous amount of energy, and that energy travels outward in a shockwave. The shockwave pushes gas together into clouds and creates greater density. That can lead to new stars.
That’s what happened in our neighbourhood, and it formed stars on the edge of the Local Bubble, which is also the edge of supernova shockwaves. Inside the Local Bubble, the density of the Interstellar Medium (ISM) is much lower than the density of the ISM throughout the Milky Way. The series of supernovae explosions pushed the gas aside, forming the edge of the bubble of dense ISM and driving star formation there.
“This is an incredible detective story, driven by both data and theory.”
Alyssa Goodman, study co-author, CfA Professor.
The edge of the bubble has fragmented and collapsed over time into star-forming clouds. Its once-smooth edge is gone. The team reports that there are seven star-forming regions on the bubble’s surface in the form of molecular clouds. These include Orion A and Orion B, both prominent parts of the Orion Molecular Cloud Complex. “Remarkably, we find that every well-known molecular cloud within ~200 pc of the Sun lies on the surface of the Local Bubble,” the paper says. The exception might be the Perseus Molecular Cloud.
The star formation didn’t happen all at once. In their paper, the authors point out that it happened in four distinct epochs: 10 Myr ago, 6 Myr ago, 4 Myr ago, and in the present age. They don’t know exactly how many supernovae exploded to create the bubble, but they’ve constrained it between 8 and 26, settling on 15 as the most likely number. “We’ve calculated that about 15 supernovae have gone off over millions of years to form the Local Bubble that we see today,” said Zucker, who is now a NASA Hubble Fellow at STScI.

“This is really an origin story; for the first time we can explain how all nearby star formation began,” said Zucker, who completed the work during a fellowship at the CfA.
Zucker is a data visualization specialist, and visualizations are prominent in the study. Zucker and her colleagues created an interactive tool to explore the Local Bubble and its surroundings.

Universe Today readers might recognize some of the stars on the edge of the Local Bubble. For example, the red supergiant Antares is the brightest and most massive star in the Sco-Cen (Scorpius-Centaurus) association. Antares is the 15th brightest star in the sky, and one of the largest stars visible with the naked eye.
Zucker and her colleagues also created a video explaining their work.
The Local Bubble isn’t a static object: it’s still slowly growing, like a car after you take your foot off the gas. “It’s coasting along at about 4 miles per second,” Zucker said. “It has lost most of its oomph though and has pretty much plateaued in terms of speed.”
Like many other discoveries about our neighbourhood in the Milky Way, this work leaned heavily on the data from the ESA’s Gaia spacecraft. Gaia created an ambitious 3D model of our galaxy based on the position and velocity measurements of about one billion stars.
The team traced back the motions of stars to paint a picture of the bubble’s formation. “The clear implication of the
observed geometry and motions is that all the well-known star-forming regions within 200 pc of the Sun formed
as gas has been swept up by the Local Bubble’s expansion,” they explain in their paper.
“This is an incredible detective story, driven by both data and theory,” said Harvard professor and Center for Astrophysics astronomer Alyssa Goodman, a study co-author and founder of glue, data visualization software that enabled the discovery. “We can piece together the history of star formation around us using a wide variety of independent clues: supernova models, stellar motions and exquisite new 3D maps of the material surrounding the Local Bubble.”
The Sun is in the middle of the Local Bubble, but it hasn’t always been. As Sol travelled through space, it entered the bubble. Now we find ourselves in the middle of it, where we’ve been since the dawn of humanity.

“When the first supernovae that created the Local Bubble went off, our Sun was far away from the action,” says co-author João Alves, a professor at the University of Vienna. “But about five million years ago, the Sun’s path through the galaxy took it right into the bubble, and now the Sun sits — just by luck — almost right in the bubble’s center.”
What does it mean that we find ourselves right in the center of a bubble? That’s statistically unlikely, so it implies that bubbles are not uncommon. In fact, astronomers have theorized for 50 years that these bubbles exist. “Now, we have proof — and what are the chances that we are right smack in the middle of one of these things?” asks Goodman.
What happened to all the supernovae after they exploded? When supernovae explode, the star isn’t completely destroyed. They leave behind remnants. In their paper, the authors say the survivors of all these supernovae are likely contained in the Upper Centaurus Lupus (UCL) and Lower Centaurus Crux (LCC) clusters. “We find that 15-16 Myr ago, the Upper Centaurus Lupus (UCL) and Lower Centaurus Crux (LCC) clusters in the Sco-Cen stellar association were born about 15 pc apart and that the Bubble itself was likely created by supernovae whose surviving members belong to these clusters.”

The discovery implies that the Milky Way has a sort of swiss-cheese morphology, where bubbles of thin ISM are pervasive. Now that the team of researchers has found one bubble they want to find more. Will our Local Bubble be special somehow? Or will it be run-of-the-mill?
There are other questions waiting to be addressed, too. “Where do these bubbles touch?” Zucker asked in a press release. “How do they interact with each other? How do superbubbles drive the birth of stars like our Sun in the Milky Way?”
To answer those questions, the team will have to wait for Gaia’s third data release (Gaia DR3.) The ESA released some of that data already, but not all of it.
The team ends their paper with a look to the future. “The abundance of new stellar radial velocity data expected in Gaia DR3 should not only allow for more refined estimates of the Local Bubble’s evolution but also enable similar studies farther afield, providing further observational constraints on supernova-driven star formation across our Galactic neighbourhood.”
More:
- Press Release: 1,000-Light-Year Wide Bubble Surrounding Earth is Source of All Nearby, Young Stars
- Paper: Star formation near the Sun is driven by expansion of the Local Bubble
- Universe Today: A Supernova Exploded Dangerously Close to Earth 2.5 Million Years Ago
Zucker, C., Goodman, A.A., Alves, J. et al. Star formation near the Sun is driven by expansion of the Local Bubble. Nature (2022). https://doi.org/10.1038/s41586-021-04286-5
The shell expansion could help explain the apparent spike in supernova residue that started around 5 Myrs ago.
Nice early indication that these bubbles may be common – let’s find another one! (And Gaia may help with that as well.)
Here is a larger scale view – the sample section appears to be a ~ 12 klyrs view – and it is consistent with shells of star formation regions:
“Scientists from Cardiff University have helped produce a brand-new, three-dimensional survey of our galaxy, allowing them to peer into the inner structure and observe its star-forming processes in unprecedented detail.
The large-scale survey, called SEDIGISM (Structure, Excitation and Dynamics of the Inner Galactic Interstellar Medium), has revealed a wide range of structures within the Milky Way, from individual star-forming clumps to giant molecular clouds and complexes, that will allow astronomers to start pushing the boundaries of what we know about the structure of our galaxy.”
“”The survey revealed that only a small proportion, roughly 10%, of these clouds have dense gas with ongoing star formation,” said James Urquhart from the University of Kent, the lead author of the third publication.
Similarly, the results from the work led by Dr Duarte Cabral suggest that the structure of the Milky Way is not that well defined and that the spiral arms are not that clear.
They have also shown that the properties of clouds do not seem to be dependent on whether a cloud is located in a spiral arm or an inter-arm region, where they expected very different physics to be playing a role.
“Our results are already showing us that the Milky Way may not be a strong grand design type of spiral galaxy as we thought, but perhaps more flocculent in nature,” Dr Duarte Cabral continued.”
[“Scientists peer into the 3D structure of the Milky Way”, CARDIFF UNIVERSITY, 2020]
“A flocculent spiral galaxy is a type of spiral galaxy. Unlike the well-defined spiral architecture of a grand design spiral galaxy, flocculent (meaning “fluffy”) galaxies are patchy, with discontinuous spiral arms.[1][2] Self-propagating star formation is the apparent explanation for the structure of flocculent spirals.[3] Approximately 30% of spirals are flocculent, 10% are grand design, and the rest are referred to as “multi-armed”.[4] The multiple-arm type is sometimes grouped into the flocculent category.[5]”
[“Flocculent spiral galaxy”, Wikipedia]
Milky Way may be a run-of the mill flocculent galaxy, but that’s because it appears still young. Tortoise versus hare.
Other nearby candidates for flocculence:
“Since the Andromeda Galaxy is seen close to edge-on, it is difficult to study its spiral structure. Rectified images of the galaxy seem to show a fairly normal spiral galaxy, exhibiting two continuous trailing arms that are separated from each other by a minimum of about 13,000 ly (820,000,000 AU) and that can be followed outward from a distance of roughly 1,600 ly (100,000,000 AU) from the core. Alternative spiral structures have been proposed such as a single spiral arm[78] or a flocculent[79] pattern of long, filamentary, and thick spiral arms.”
[“Andromeda galaxy”, Wikipedia]
“The spiral galaxy M33, also known as the Triangulum Galaxy, is one of our closest cosmic neighbours, just three million light-years away. Home to some forty billion stars, it is the third largest in the Local Group of galaxies after the Andromeda Galaxy (M31) and our own Milky Way.”
“The patchy, disorganised structure of M33’s spiral arms resembles a tuft of wool, leading astronomers to classify it as a flocculent spiral galaxy.”
[“Image: Flocculent neighbour spiral galaxy”, Phys Org]
For an example, albeit extreme, of a flocculent galaxy I recommend Universe Today own “NGC 2275: An Absolute Unit of Galactic Flocculence” by Nancy Atkinson: https://www.universetoday.com/146850/ngc-2275-an-absolute-unit-of-galactic-flocculence/ .