
According to multiple sources – which includes NASA, the NOAA, the Berkeley Earth research group, and the Met Office Hadley Centre (UK) – global temperatures over the past few years have been some of the hottest on record. This is the direct result of anthropogenic factors like overpopulation, urbanization, deforestation, and increased greenhouse gas emissions (like carbon dioxide and methane).
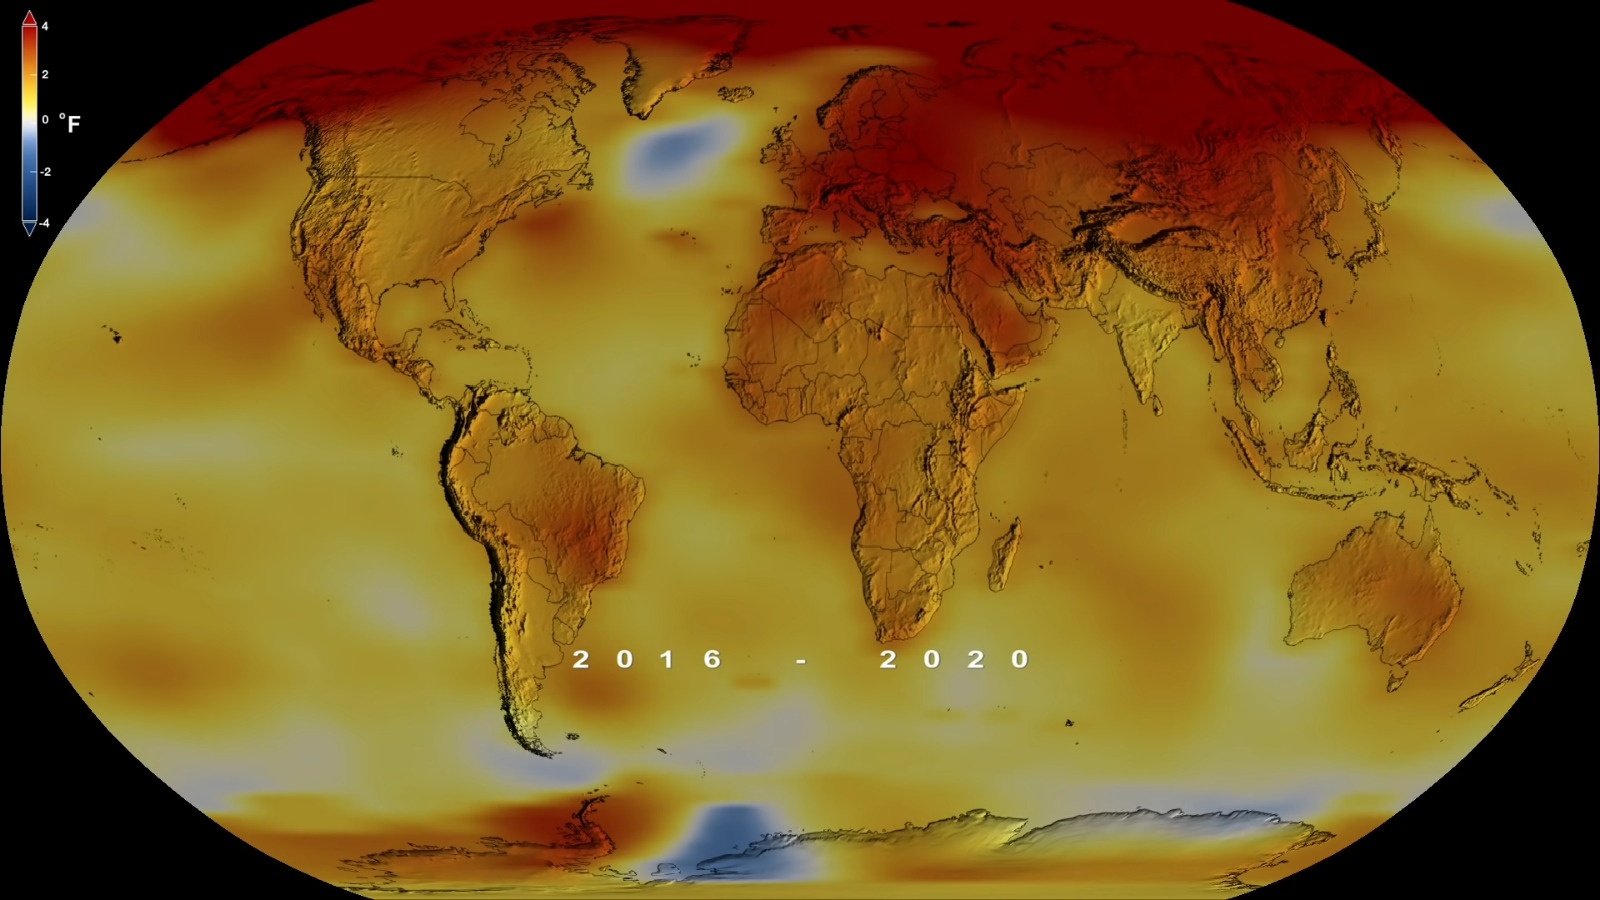
According to a recent press release from NASA, in terms of global temperatures, 2020 was the hottest year on record – effectively tying it with 2016 (the previous record-holder). The release includes a dramatic video that illustrates average temperature increases since 1880 and the ecological crises that have taken place just this past year. This is yet another warning of how human agency is impacting the very systems we depend upon for our continued survival.
Overall, Earth’s average temperature has risen by more than 1.2 °C (2 °F) since the 1880s. According to NASA’s Goddard Institute for Space Studies‘ (GISS) temperature analysis – known as GISTEMP – the average global temperature for 2020 was 1.02 °C (1.84 °F) warmer than the 1951-1980 baseline. This is consistent with the long-term warming trend and places 2020 just slightly ahead of 2016, effectively tying the two for the warmest year on record.
This analysis combines surface and sea temperature measurements by more than 26,000 weather stations and thousands of ship- and buoy-based instruments. Along with an algorithm that corrects for the varied spacing of temperature stations and urban heating effects, the end result is an estimate of global average temperatures from a baseline period of 1951 to 1980 – with a 0.05 °C (0.1 °F) margin of error and a 95% confidence level.
Reason for Concern
As GISS Director Gavin Schmidt explained, annual records are not nearly as long-term trends, which have been worrisome:
“The last seven years have been the warmest seven years on record, typifying the ongoing and dramatic warming trend. Whether one year is a record or not is not really that important – the important things are long-term trends. With these trends, and as the human impact on the climate increases, we have to expect that records will continue to be broken.”
Global temperatures are a critical indicator of how our climate is changing over time as a result of humanity’s impact on the natural environment. Their mean increase over time is what has led to phenomena like diminishing ice sheets, rising sea levels, the disappearance of water tables and drought, wildfires, prolonged heatwaves, increased storm activity, outbreaks of disease, and species extinction.
A separate, independent analysis by the National Oceanic and Atmospheric Administration (NOAA) concluded that 2020 was the second-warmest year in their record, behind 2016. NOAA scientists use much of the same raw temperature data in their analysis, but have a different baseline period (1901-2000) and methodology. Unlike NASA, NOAA also does not infer temperatures in polar regions lacking observations, which accounts for much of the difference between NASA and NOAA records.

Understanding long-term climate trends is not only essential to educating the public on climate change and developing solutions. It’s also crucial to the development of crisis strategies and adapting to changing environmental conditions, which can mean planting different crops, managing water resources, and preparing for extreme weather events.
Annual Trends
While the long-term trend has been consistent (with overall increases), a variety of events will contribute to average temperatures in any given year. For 2020, two events took place that limited the amount of sunlight that reached the Earth’s surface. The first was the Australian bush fires that raged for months and burned 46 million acres of land, releasing smoke and particulates over 30 km (18 mi) high in the atmosphere.
This event limited the amount of sunlight reaching the lower atmosphere and likely resulted in a slight cooling. The second factor was the COVID-19 pandemic, which led to a marked reduction in air pollution in certain parts of the world, which allowed more sunlight to reach the surface (hence, warming it.) At the same time, cumulative CO2 concentrations continued to rise this year, maintaining the long-term trend.
Temperatures also vary year-to-year, thanks to a number of environmental factors. The single-greatest is usually the El Nino-Southern Oscillation (ENSO), a naturally-occurring cycle where heat is exchanged between the ocean and atmosphere in the central and eastern Pacific Ocean. This allows warm water and air to move from the western Pacific toward the Americas and reduces the upwelling of cooler, nutrient-rich waters from the deep.

This year, the ENSO ended with a cool phase, but began with a slightly warm phase that resulted in a slight overall increase in average temperatures. Said Schmidt:
“The previous record warm year, 2016, received a significant boost from a strong El Nino. The lack of a similar assist from El Nino this year is evidence that the background climate continues to warm due to greenhouse gases.”
Regional Variances
It’s also important to recognize that the GISS data represents surface temperatures averaged over the entire planet for the entire year. This is to say that regional weather patterns have an effect and that temperature variances in 2020 were different depending on location. It also means that in the long-term, certain parts of the globe are warming faster than others.
For example, the GISTEMP analysis shows that the Arctic region has been warming three times faster than the rest of the globe over the past 30 years, which has led to greater levels of melting sea ice. The minimum area of sea ice in the Arctic is currently declining by about 13% annually, which leads to the region becoming less reflective and to the ocean absorbing more sunshine.
This is what drives “Arctic amplification,” a process where the oceans absorb more sunlight, causing temperatures to increase further still, which leads to even more melting, rising sea levels, the loss of permafrost in the Arctic Circle, and more intense Arctic wildfires. It is therefore important to understand that a global average increase of just a few degrees does not mean that the warming trend is inconsequential.
For more information about NASA’s full surface temperature data set and the methodology they employ, check out NASA’s GISS Surface Temperature Anaylsis site.
Further Reading: NASA
2 things are equally true:
1. I am as pro-environment as they come. I compost, worm compost, plant trees, recycle, etc.
2. I worry that this is less about science, and more about political powers pushing an agenda for a “New Green Deal”, “Great Reset”, etc.
While the graphs, etc. initially look alarming, an examination of the Y-axis shows that these are overall very small temperature changes- despite the gas-lit graphic Universe Today used to headline the article. Plus, as I tell my students, due to the presence of the Milankovitch Cycles, the Earth was far warmer (Mesozoic Era) millions of years before humans were even here to mess it up.
As a civilization, we need to do a better job protecting our jewel of a planet. But it would be nice if we could separate the true science from politics, and understand that long-term changes to the Earth are going to affect climate regardless of what we as a species do.
During the Mesozoic Era, conditions were generally warmer, but like all previous epochs, the changes happened gradually over the course of eons. The current trend is unprecedented, in that it is happening in a matter of decades and producing massive feedbacks we are seeing all around us. Also, as it states, these are average overall increases, they are not the same in all regions of the world or at all times of the year.
Politics are already separate from the science being conducted. The research of NASA, the NOAA, the UGS, and other scientific organizations has been consistent over the past four decades. Their results have pointed to the same conclusion: Earth is warming at an unprecedented rate, and human agency is the direct cause.