
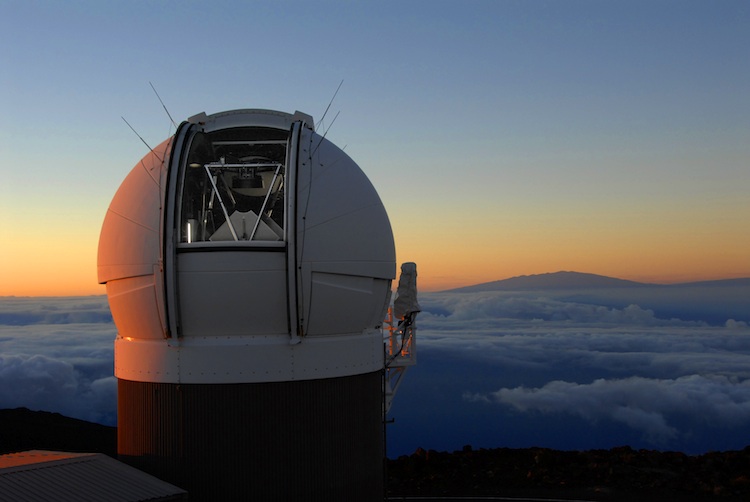
Atop the summit of Haleakala on the Hawaiian island of Maui sits the Panoramic Survey Telescope and Rapid Response System, or Pan-STARRS1 (PS1). As part of the Haleakala Observatory overseen by the University of Hawaii, Pan-STARRS1 relies on a system of cameras, telescopes, and a computing facility to conduct an optical imaging survey of the sky, as well as astrometry and photometry of know objects.
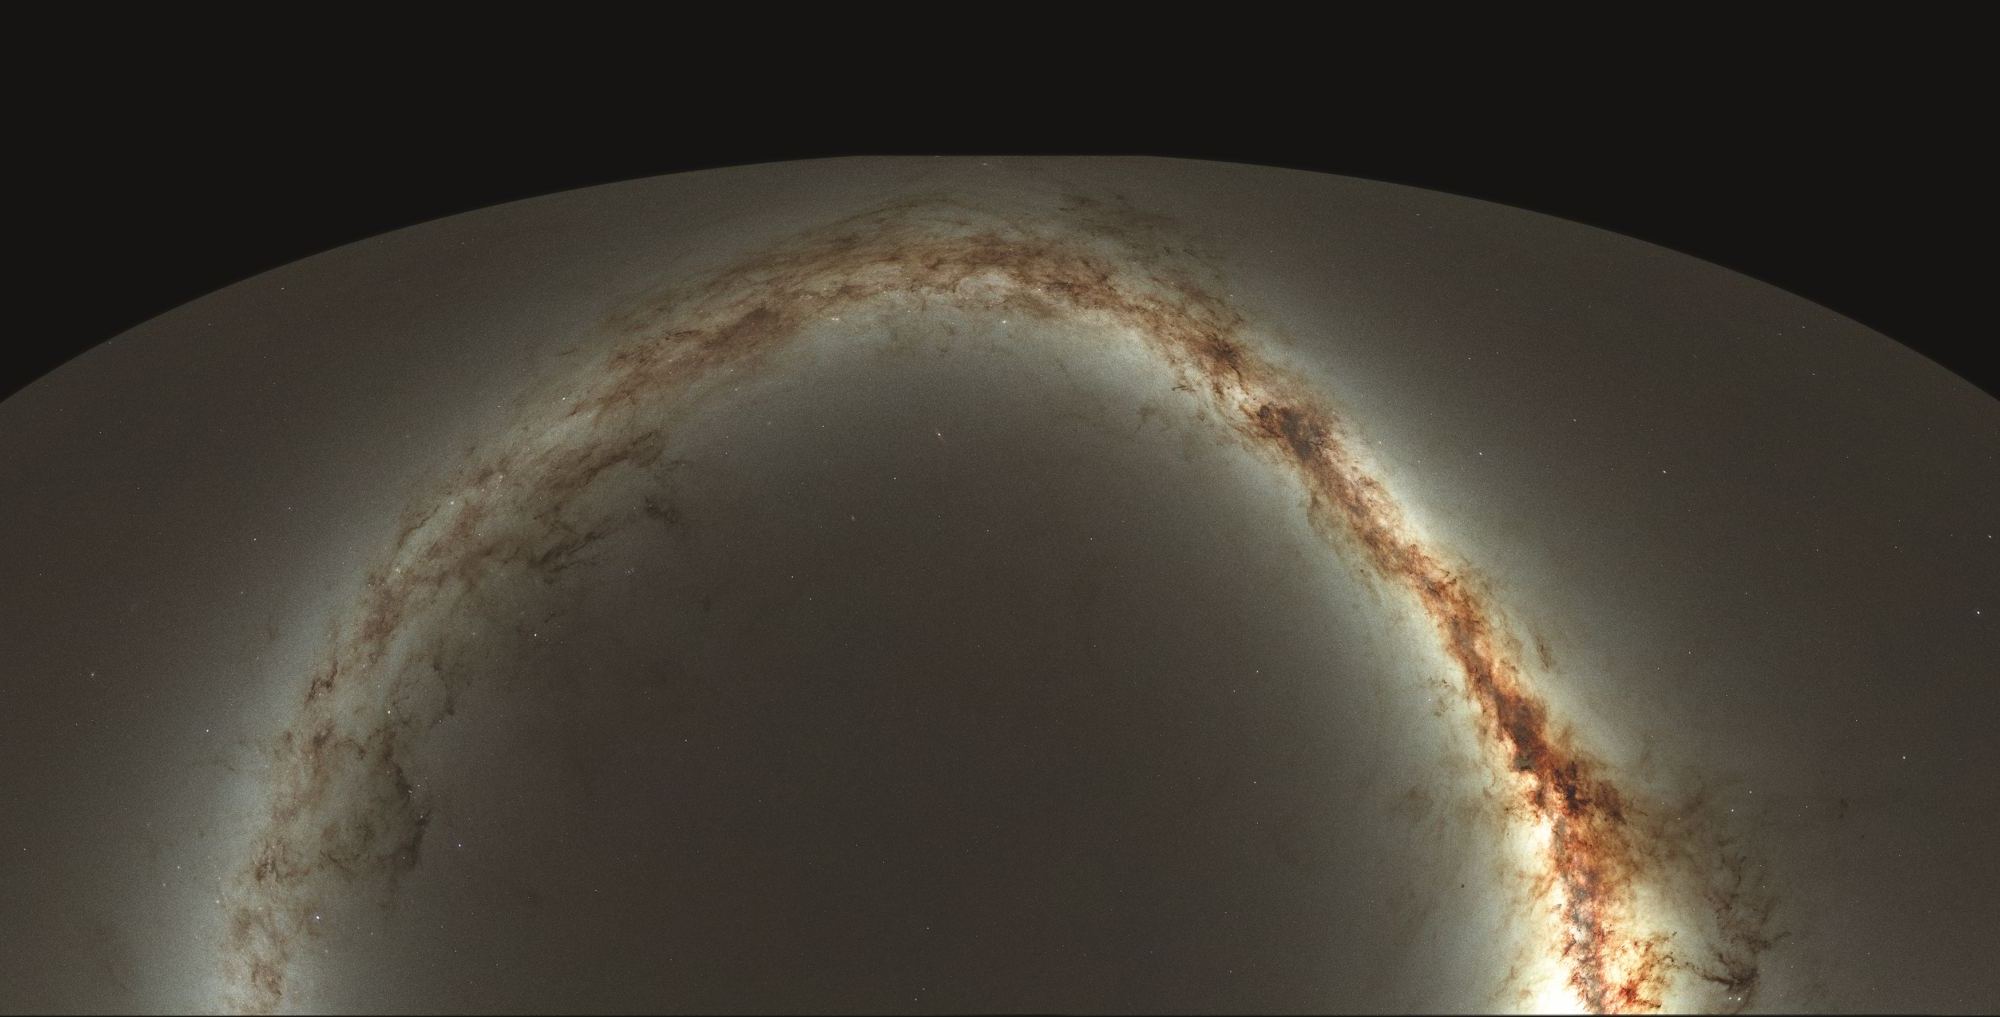
In 2018, the University of Hawaii at Manoa’s Institute for Astronomy (IfA) released the PS1 3pi survey, the world’s largest digital sky survey that spanned three-quarters of the sky and encompassed 3 billion objects. And now, a team of astronomers from the IfA have used this data to create the Pan-STARRS1 Source Types and Redshifts with Machine Learning (PS1-STRM), the world’s largest three-dimensional astronomical catalog.
Their work is described in a paper that appeared in the August 31st issue of the Monthly Notices of the Royal Astronomical Society. The study was led by Robert Beck, a former cosmology postdoctoral fellow at the IfA (now a professor at Eötvös Loránd University in Hungary), and included members from both institutions, as well as Stanford Health Care’s Platform Services.
Novel Computational Tools
As they describe in their study, the team began by taking publicly-available spectroscopic measurements of the 2,902,054,648 objects studied in the PS1 3pi survey, which provides them with definitive object classifications and distances. They then fed these to an artificial intelligence algorithm, which sorted them into stars, galaxies, quasars, or unsure (it also derived refined estimates for the galaxies’ distances).
As Beck described the process in a recent University of Hawaii News press release:
“Utilizing a state-of-the-art optimization algorithm, we leveraged the spectroscopic training set of almost 4 million light sources to teach the neural network to predict source types and galaxy distances, while at the same time correcting for light extinction by dust in the Milky Way.”
The machine learning process they employed, known as a “feedforward neural network,” was intrinsic to helping the team accurately determine the properties of different objects and sort them based on their size and photometric redshift. Overall, this process achieved a classification accuracy of 98.1% for galaxies (and distance estimates accurate to almost 3%), 97.8% for stars, and 96.6% for quasars.
Largest 3D Map Ever!
To date, the largest and most detailed 3D maps of the Universe were created by the Sloan Digital Sky Survey (SDSS), which was released in 2012. This survey combines data from the Sloan Foundation 2.5 m Telescope and the NMSU 1-Meter telescope at the Apache Point Observatory (New Mexico), and the Irénée du Pont Telescope at Las Campanas Observatory (Chile).
The most recent data release (DR16), the fourth release of the fourth phase of the SDSS (SDSS-IV), contains SDSS observations through to August 2018. The final release (DR17) is scheduled for July 2021 and will include all new spectra observations, as well as all final data products and catalogs. However, the SDSS catalog covers one-third of the sky and contains spectra for over 3 million objects.
In comparison, the PS1-STRM doubles the area surveyed, increases the number of objects tenfold, and covers specific areas that the SDSS missed. As István Szapudi, an IfA astronomer and co-author on the study, noted :
“[A]lready, a preliminary version of this catalog, covering a much smaller area, facilitated the discovery of the largest void in the universe, the possible cause of the Cold Spot. The new, more accurate, and larger photometric redshift catalog will be the starting point for many future discoveries.”
This latest map of the Universe is a testament to the way astronomical instruments and methods have matured in a short space of time. In particular, it has shown how big data sets obtained by multiple telescopes can be multiplied with the addition of machine learning techniques, improved data sharing, and complementary observations.
Ken Chambers, the Pan-STARRS Director and an IfA Associate Astronomer who was also a co-author on the study, indicated that this is just the beginning. “As Pan-STARRS collects more and more data,” he said, “we will use machine learning to extract even more information about near-Earth objects, our Solar System, our Galaxy and our Universe.”
The Pan-STARRS 3D catalog (approx. 300 GB in size) is now available at the Mikulski Archive for Space Telescopes. Science users can query the catalog through the Space Telescope Science Institute’s (STScI) MAST CasJobs SQL interface, or download the entire package as a computer-readable table.
Further Reading: University of Hawaii News, MNRAS