
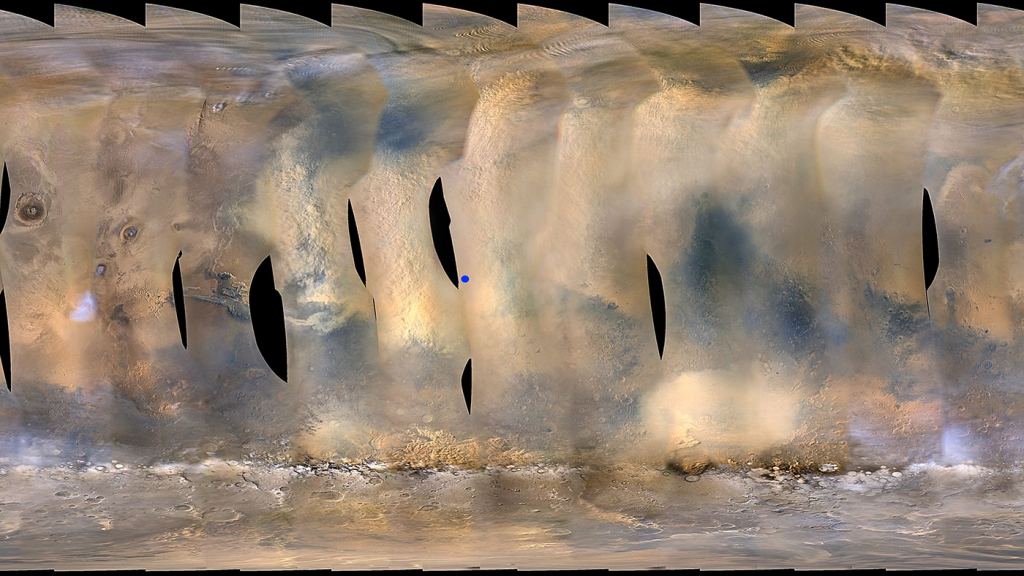
In 2018, Mars experienced one of its global dust storms, a phenomenon seen nowhere else. As science would have it, there were no fewer than six spacecraft in orbit around Mars at the time, and two surface rovers. This was an unprecedented opportunity to watch and study the storm.
Martian Global Dust Storms (GDS) occur only in the latter half of the Martian year. But other than that, they’re unpredictable. They vary widely inside that time frame, and their origin, onset, and diminishment are not well understood.
They’re hard to study because they occur only once or twice every Earth decade. In June of 2018, Mars had a GDS, and this time, human spacecraft and rovers were ready for it. Unfortunately, NASA’s Opportunity rover succumbed to this storm, after over 5,000 days on Mars.
The Journal of Geophysical Research: Planets published a collection of papers from the 2018 GDS. They all stem from climate models and from the wealth of data that was collected during the storm. Observations extended from the beginning of the storm, to when it was global in June 2018, to when the atmosphere cleared again in early October.
These studies use the term Solar Longitude to mark time. It’s denoted as Ls.
One study used thermal mapping from orbit to track the onset of the storm, and its eventual ebbing. It’s data came from the Mars Climate Sounder instrument on the Mars Reconnaissance Orbiter.
The 2018 GDS was one of the earliest ever observed on Mars, starting just after the southern spring equinox. It had two very intense periods of dust loading, with a lull in between, before eventually decaying, though slowly.
![Mars Year 34 zonally averaged 9.3µm absorption dust opacities at 610Pa, as a function of latitude and time of year, produced using gridded and interpolated maps of Mars Climate Sounder dust retrievals. The global dust storm begins shortly after southern spring equinox at Ls~185° and opacities have returned to seasonal levels when a regional storm begins at Ls~315°. Credit: Montabone et al. [2020].](https://www.universetoday.com/wp-content/uploads/2020/06/2019JE006111-Figure-9-lower-panel-new-labels-sized-for-Eos-800-wide.png)
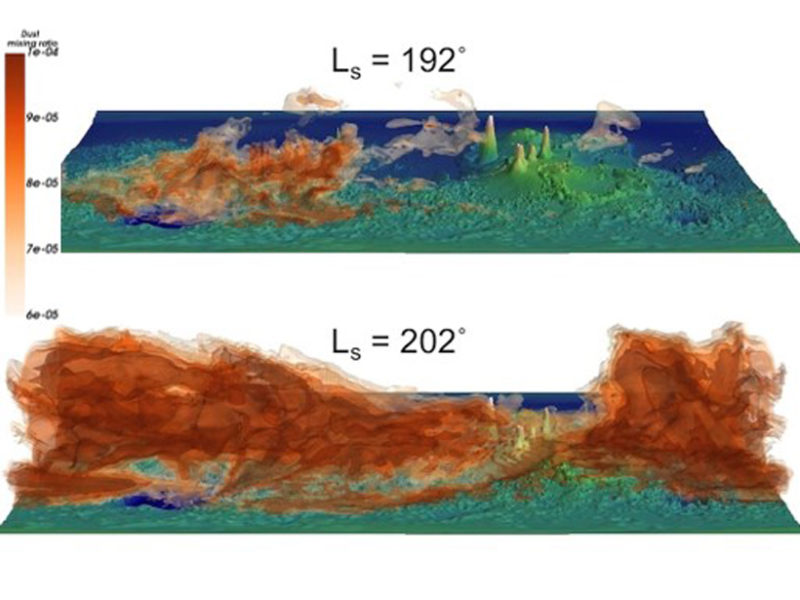
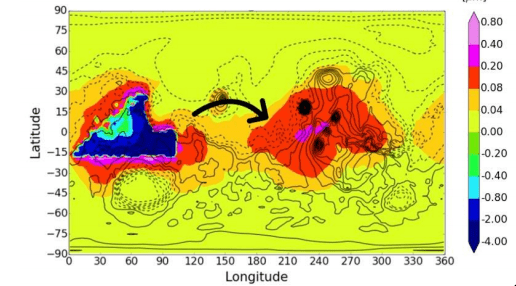
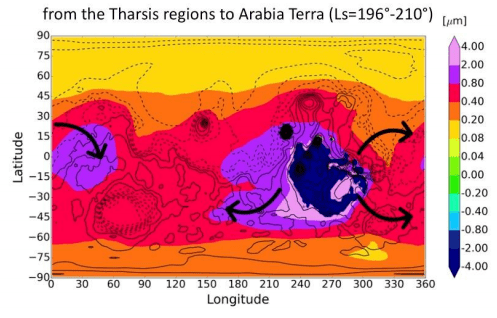
Another study highlighted how GDSs transport dust around Mars. In the equatorial regions, dust is lofted into the atmosphere and rapidly transported in an easterly direction. This cycle of replenishment may contribute to the development of storms.
This study used the Mars Global Climate Simulator to compare simulations of the storm with observations of the storm.
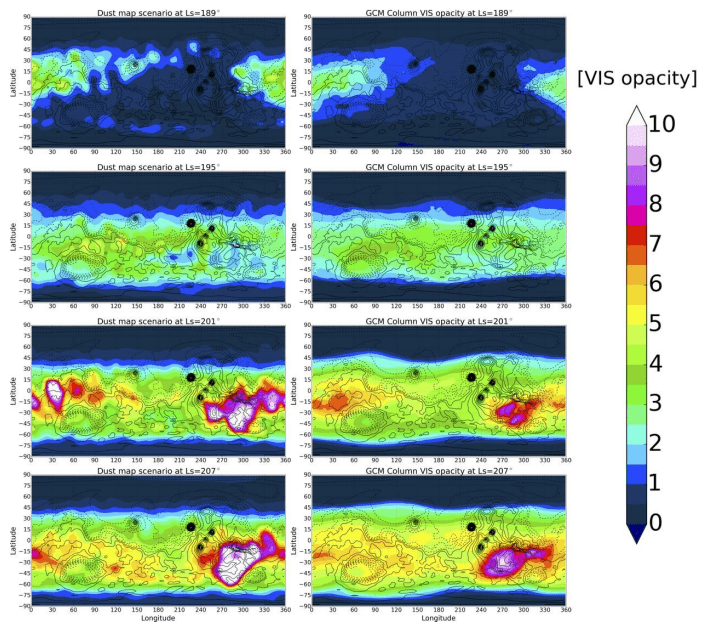
Martian GDSs are not easy to understand. There may be complex feedback processes involved in their formation, growth, and evolution. For example, while the Tharsis region, a massive volcanic plateau on the equatorial region, didn’t contribute much dust in the early part of the storm, it played a critical role later. Once the storm deposited dust on Tharsis, it later became a major dust source that contributed to the global growth of the storm.
This is just a taste of the data uncovered during this storm. You can look at the studies at the American Geophysical Union website.
With increased exploration of Mars in the future, an understanding of Martian dust storms is not a luxury, but a necessity. It was a dust storm that finally felled the Opportunity rover, even though that mission had long outlasted its planned length. A better understanding of these massive storms might lead to a better understanding of how to prepare for them.
Our machines won’t be alone on Mars forever. One day, it’ll be humans exploring the surface. (And we’ve all seen “The Martian” right?) It would be foolhardy and full of hubris to try setting foot on Mars without having a solid understanding of how these storms work.
More:
- Press Release: Lifting the Veil on Martian Dust Storms
- Research Papers: Studies of the 2018/Mars Year 34 Planet-Encircling Dust Storm
- Universe Today: Mars’ North Pole is Doing the Dust Storms Thing Again