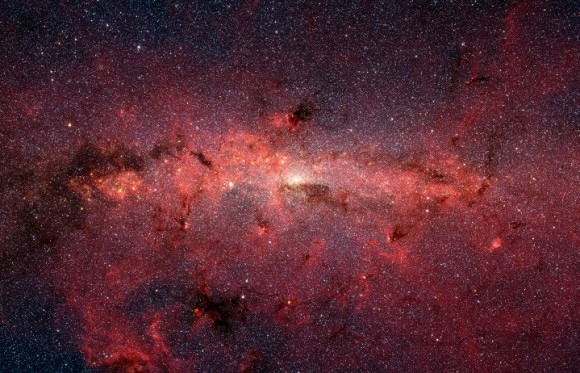
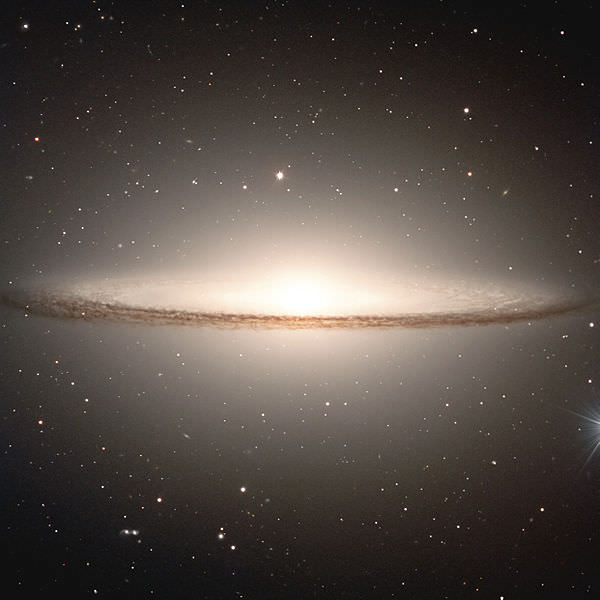
Maybe we take our beloved Milky Way galaxy for granted. As far as humanity is concerned, it’s always been here. But how did it form? What is its history?
Our Milky Way galaxy has three recognized stellar components. They are the central bulge, the disk , and the halo. How these three were formed and how they evolved are prominent, fundamental questions in astronomy. Now, a team of researchers have used the unique property of a certain type of star to help answer these fundamental questions.
The type of star in question is called the blue horizontal-branch star (BHB star), and it produces different colors depending on its age. It’s the only type of star to do that. The researchers, from the University of Notre Dame, used this property of BHB’s to create a detailed chronographic (time) map of the Milky Way’s formation.
This map has confirmed what theories and models have predicted for some time: the Milky Way galaxy formed through mergers and accretions of small haloes of gas and dust. Furthermore, the oldest stars in our galaxy are at the center, and younger stars and galaxies joined the Milky Way over billions of years, drawn in by the galaxy’s growing gravitational pull.
The team who produced this study includes astrophysicist Daniela Carollo, research assistant professor in the Department of Physics at the University of Notre Dame, and Timothy Beers, Notre Dame Chair of Astrophysics. Research assistant professor Vinicius Placco, and other colleagues rounded out the team.
“We haven’t previously known much about the age of the most ancient component of the Milky Way, which is the Halo System,” Carollo said. “But now we have demonstrated conclusively for the first time that ancient stars are in the center of the galaxy and the younger stars are found at longer distances. This is another piece of information that we can use to understand the assembly process of the galaxy, and how galaxies in general formed.”

The Sloan Digital Sky Survey (SDSS) played a key role in these findings. The team used data from the SDSS to identify over 130,000 BHB’s. Since these stars literally “show their age”, mapping them throughout the Milky Way produced a chronographic map which clearly shows the oldest stars near the center of the galaxy, and youngest stars further away.
“The colors, when the stars are at that stage of their evolution, are directly related to the amount of time that star has been alive, so we can estimate the age,” Beers said. “Once you have a map, then you can determine which stars came in first and the ages of those portions of the galaxy. We can now actually visualize how our galaxy was built up and inspect the stellar debris from some of the other small galaxies being destroyed by their interaction with ours during its assembly.”
Astronomers infer, from various data-driven approaches, that different structural parts of the galaxy have different ages. They’ve assigned ages to different parts of the galaxy, like the bulge. That makes sense, since everything can’t be the same age. Not in a galaxy that’s this old. But this map makes it even clearer.
As the authors say in their paper, “What has been missing, until only recently, is the ability to assign ages to individual stellar populations, so that the full chemo-dynamical history of the Milky Way can be assessed.”
This new map, with over 130,000 stars as data points, is a pretty important step in understanding the evolution of the Milky Way. It takes something that was based more on models and theory, however sound they were, and reinforces it with more constrained data.
Update: The chronographic map, as well as a .gif, can be viewed here.

