An Enormous Arctic Spiral

Satellite image of a cloud vortex off the coast of Greenland (NASA/MODIS/Chelys)

Looking south across the southern tip of Greenland, this satellite image shows an enormous cloud vortex spiraling over the northern Atlantic ocean on January 26, 2013. An example of the powerful convection currents in the upper latitudes, these polar low cyclones are created when the motion of cold air is energized by the warmer ocean water beneath.

Sometimes referred to as Arctic cyclones, these spiraling storms can bring gale-force winds and heavy snowfall over a wide area of ocean during their 12- to 36-hour lifespans. Hurricane-type storms don’t only form in the tropics!

This image was captured by the MODIS instrument on NASA’s Aqua satellite from its polar orbit 705 km (438 miles) above the Earth. The view has been rotated so south is up; the southernmost tip of Greenland can be seen at lower right. Click for an impressive high-resolution view.

Image via EOSNAP/Chelys

NASA Satellite Snaps Winter Storm “Nemo”

GOES-13 satellite view of the eastern US on Feb. 8 (NASA)

Captured by NASA’s GOES-13 weather satellite on Friday, Feb. 8, this image shows the convergence of two massive low-pressure systems that are expected to bring high winds and up to 2–3 feet of snowfall across much of New England over the next 24 hours. This is the second and most powerful “nor’easter” of the season, and states in the region are preparing for the worst.

Acquired at 9:01 a.m. EST, the GOES image shows clouds associated with the western frontal system stretching from Canada through the Ohio and Tennessee valleys and down into the Gulf of Mexico. The comma-shaped low pressure system located over the Atlantic, east of Virginia, is forecast to merge with the front and create a powerful nor’easter, which The Weather Channel (in a recent move to name winter storms) has dubbed “Nemo.”

Watch a video of this process in action below.

Snowfall forecasts for New England states (Weather Channel)

At the time of this writing, the snow has begun to fall outside this writer’s house. Accumulations are less than an inch — but that’s soon to change! Many cancellations and closings have already been announced across the region, with people making apprehensive associations with the infamous Blizzard of ’78. It’s unlikely that as many people will be caught unprepared, though, especially since modern forecasting methods have dramatically improved over the past 35 years — due in no small part to space technology like NASA’s GOES (Geostationary Operational Environment Program) satellites.

Orbiting Earth at an altitude of 35,790 km (22,240 miles) the 4 operational GOES satellites keep a constant eye on the globe, providing the NOAA with accurate, real-time measurements of water vapor and land and sea temperature variations. See more GOES image data here.

In the path of Nemo? Here’s some tips on how to be prepared.

Clouds of Sand and Iron Swirl in a Failed Star’s Extreme Atmosphere

This artist's conception illustrates the brown dwarf named 2MASSJ22282889-431026. NASA's Hubble and Spitzer space telescopes observed the object to learn more about its turbulent atmosphere. Brown dwarfs are more massive and hotter than planets but lack the mass required to become sizzling stars. Their atmospheres can be similar to the giant planet Jupiter's. Spitzer and Hubble simultaneously observed the object as it rotated every 1.4 hours. The results suggest wind-driven, planet-size clouds. Image credit:
This artist's conception illustrates what a "hot jupiter" might look like.

Artist’s concept of brown dwarf  2MASSJ22282889-431026 (NASA/JPL-Caltech)

The complex weather patterns within the atmosphere of a rapidly-rotating brown dwarf have been mapped in the highest detail ever by researchers using the infrared abilities of NASA’s Spitzer and Hubble space telescopes… talk about solar wind!

Sometimes referred to as failed stars, brown dwarfs form from condensing gas and dust like regular stars but never manage to gather enough mass to ignite full-on hydrogen fusion in their cores. As a result they more resemble enormous Jupiter-like planets, radiating low levels of heat while possessing bands of wind-driven eddies in their upper atmospheric layers.

Although brown dwarfs are by their nature very dim, and thus difficult to observe in visible wavelengths of light, their heat can be detected by Hubble and the Spitzer Space Telescope — both of which can “see” just fine in near- and far-infrared, respectively.

Led by researchers from the University of Arizona, a team of astronomers used these orbiting observatories on July 7, 2011 to measure the light curves from a brown dwarf named 2MASSJ22282889-431026 (2M2228 for short.) What they found was that while 2M2228 exhibited periodic brightening in both near- and far-infrared over the course of its speedy 1.43-hour rotation, the amount and rate of brightening varied between the different wavelengths detected by the two telescopes.

ssc2013-01a_Inline

“With Hubble and Spitzer, we were able to look at different atmospheric layers of a brown dwarf, similar to the way doctors use medical imaging techniques to study the different tissues in your body.”

– Daniel Apai, principal investigator, University of Arizona

This unexpected variance — or phase shift — most likely indicates different layers of cloud material and wind velocities surrounding 2M2228, swirling around the dwarf star in very much the same way as the stormy cloud bands seen on Jupiter or Saturn.

But while the clouds on Jupiter are made of gases like ammonia and methane, the clouds of 2M2228 are made of much more unusual stuff.

ssc2013-01b_Inline“Unlike the water clouds of Earth or the ammonia clouds of Jupiter, clouds on brown dwarfs are composed of hot grains of sand, liquid drops of iron, and other exotic compounds,” said Mark Marley, a research scientist at NASA’s Ames Research Center and co-author of the paper. “So this large atmospheric disturbance found by Spitzer and Hubble gives a new meaning to the concept of extreme weather.”

While it might seem strange to think about weather on a star, remember that brown dwarfs are much more gas planet-like than “real” stars. Although the temperatures of 1,100–1,600 ºF (600–700 ºC) found on 2M2228 might sound searingly hot, it’s downright chilly compared to even regular stars like our Sun, which has an average temperature of nearly 10,000 ºF (5,600 ºC). Different materials gather at varying layers of its atmosphere, depending on temperature and pressure, and can be penetrated by different wavelengths of infrared light — just like gas giant planets.

“What we see here is evidence for massive, organized cloud systems, perhaps akin to giant versions of the Great Red Spot on Jupiter,” said Adam Showman, a theorist at the University of Arizona involved in the research. “These out-of-sync light variations provide a fingerprint of how the brown dwarf’s weather systems stack up vertically. The data suggest regions on the brown dwarf where the weather is cloudy and rich in silicate vapor deep in the atmosphere coincide with balmier, drier conditions at higher altitudes — and vice versa.”

The team’s results were presented today, January 8, during the 221st meeting of the American Astronomical Society in Long Beach, CA.

Read more on the Spitzer site, and find the team’s paper in PDF form here.

Inset image: the anatomy of a brown dwarf’s atmosphere (NASA/JPL).

Hurricane Sandy Barreling to Eastern Seaboard Menacing Millions

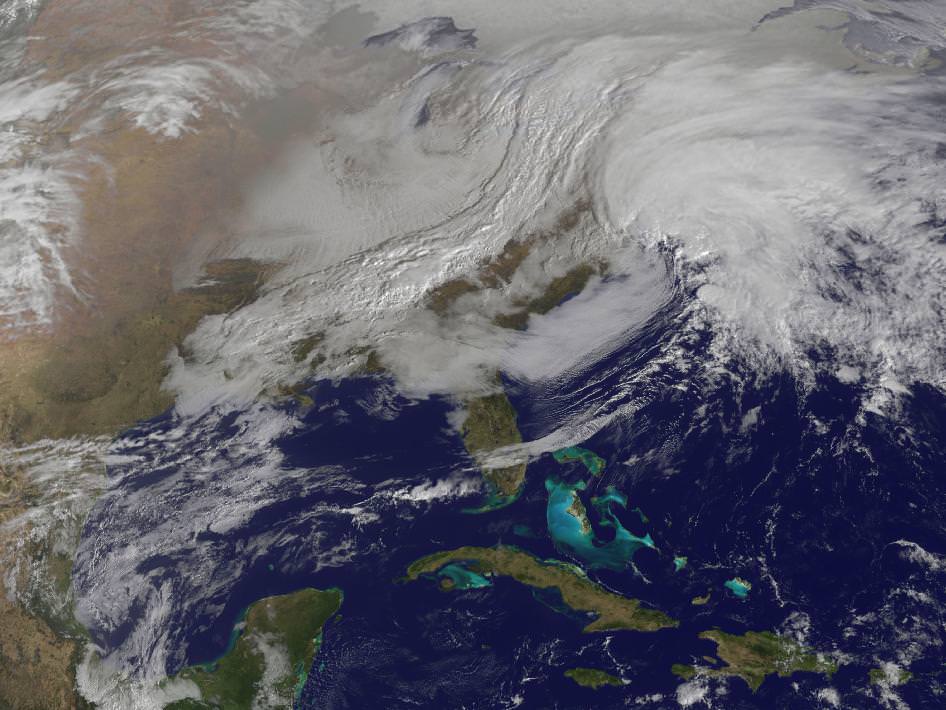
Image Caption: NOAA Satellite image of Hurricane Sandy threatening millions of people living along US Eastern Seaboard. See NASA satellite imagery below. Credit: NOAA

Hurricane Sandy, a powerfully monstrous and unprecedented late season storm, is barreling mightily towards the US Eastern Seaboard, menacing tens of millions of residents living in the path of her sustained destructive winds, rains and life threatening storm surges.

Mandatory mass evacuations involving hundreds of thousands of people are already in progress in anticipation of a devastating storm strike on Monday (Oct 29).

First effects from Sandy are expected on Sunday night (Oct 28) in the New York/ New Jersey/Connecticut/Pennsylvania metropolitan area. Wind gusts are already exceeding 40 MPH as of Sunday afternoon, here in New Jersey – and steadily worsening.

Coastal Wave heights of 6 to 11 feet are predicted – possibly breaking records.

Public transit systems in New York City/New York, New Jersey, Philadelphia, Pennsylvania, Connecticut and Washington, D.C. have been ordered to shut down later today – Sunday – by the Governors’ of the affected states. Most schools and government offices will also be closed on Monday.

Amtrak has just announced it will shutdown trains in the Northeast Corridor.

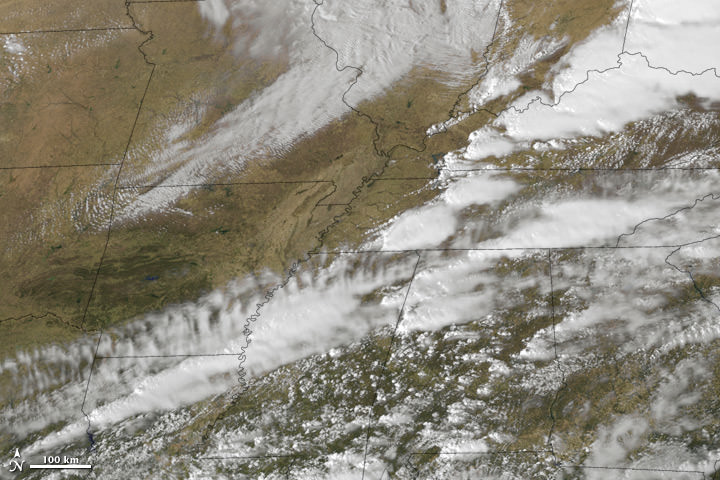
Image Caption: Hurricane Sandy off the southeastern United States was imaged at noon Eastern Daylight Time (16:00 UT) on October 28, 2012, acquired by the Moderate Resolution Imaging Spectroradiometer (MODIS) on NASA’s Terra satellite. Credit: NASA Terra satellite

As of Sunday afternoon (Oct. 28) Sandy is predicted to make a dramatic, sharp left hook on Monday morning and most likely will make a violent direct hit slamming somewhere along the Jersey shore which borders from Maryland to New York City and beyond – sending high waves surging into coastal towns and cities overwhelming protective barriers.

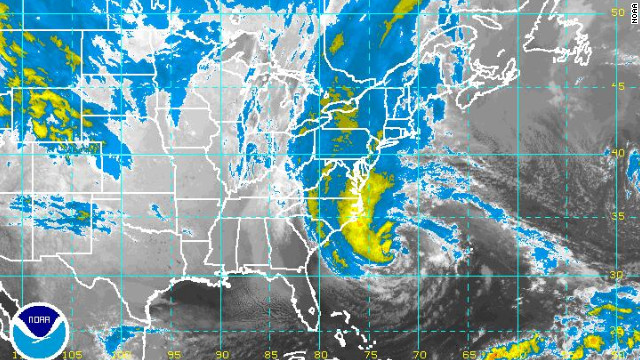
Image Caption: Predicted path of Hurricane Sandy. Credit: NOAA

Inland areas will also suffer widespread destruction and power losses as Sandy slowly moves onshore and lingers over an extraordinarily wide path spanning several hundred miles in diameter.

Heavy rains and hurricane force wind gusts will soak the ground, taking down trees and power lines. Leaves may block storm drains.

Hurricane Sandy is currently classified as a Category 1 Hurricane. Its effects could be catastrophic and should not be taken lightly.

Making matters even worse, Sandy will hit during a full moon and the astronomical highest tides.

The National Hurricane Service warns that major flooding effecting millions of homes and businesses is expected along the US East Coast stretching from North Carolina to New England.

Millions and millions of people have more than a 50% chance of losing power.

Local power companies learned hard lessons from the devastating effects of Hurricane Irene just 1 year ago, which caused widespread and serious misery, flooding and deaths throughout the Northeast. Some people went without power for more than 2 weeks in the aftermath of Hurricane Irene in 2011. This author lost power for several days and now we are in for another direct hit.

Additional Power crews have been called in from across the country and prepositioned as a precautionary measure. NEVER touch any downed power lines.

States of Emergency have been declared in 9 eastern States from North Carolina to Maine as well as the District of Columbia.

Mandatory evacuations of low lying coastal areas have been ordered by the Governors’ of New Jersey, New York and Connecticut. State Shelters are being opened now.

Ocean wave heights of 20 to 50 feet have already been reported near the Hurricane’s eye.

Even the US Presidential election is being affected by Hurricane Sandy. Campaign events by both candidates Obama and Romney have been cancelled in several key battleground states. It is possible that polling stations may lose power – and the consequences are unknown on the closely contested election that could hinge on a handful of votes !

Stay tuned to NOAA, NASA and local and national news for continuing Hurricane updates.

Ken Kremer

Bolt from the Blue: Giant Flash of Lightning Seen in Saturn’s Storm

An enormous storm that wrapped its way around Saturn’s northern hemisphere during the first half of 2011 wasn’t just a churning belt of high-speed winds; it also generated some monster flashes of lightning as well — one of which was captured on camera by the Cassini spacecraft!

Check it out…


The image above was created from Cassini raw images acquired in red, green, and blue color channels and assembled to create a somewhat “true-color” image of Saturn. The image shows the storm as it looked on February 25, 2011, a couple of months after it was first noticed by amateur astronomers on the ground. (The circle at upper left illustrates the comparative size of Earth.)

Read: Studying Saturn’s Super Storm

These images were acquired by Cassini almost two weeks later, on March 6, the first showing a bright blue flash of lightning within the storm, along the eastern edge of a large eddy. The second image, taken 30 minutes later, does not have any visible flash.

Because the flash was only visible in blue light (and there was no red channel data) the images are false color. Near-infrared replaced the visible red channel.

Based on the image resolution (12 miles/20 km per pixel) the size of the lightning flash is estimated to be about 120 miles (200 km) wide — as large as the strongest lightning seen on Earth. And like on Earth, Saturn’s lightning is thought to originate deeper in the atmosphere, at the level where water droplets freeze.

Although the 2011 northern storm was a great feature to observe, this wasn’t the first time lightning had been spotted on Saturn. Cassini had observed flashes on the ringed planet in August of 2009 as well, allowing scientists to create the first movie of lightning flashing on another planet.

Since its arrival at Saturn in 2004, Cassini has detected 10 lightning storms on Saturn — although with up to 10 flashes per second and eventually covering an area of 2 billion square miles (4 billion sq. km) the 2011 storm was by far the largest ever seen.

Image credits: NASA / JPL-Caltech / Space Science Institute. Top composite by J. Major. Video: JPL

New Gigantic Tornado Spotted on Mars

[/caption]

Last month, we were excited to share an image of a twister on Mars that lofted a twisting column of dust more than 800 meters (about a half a mile) high. We now know that’s nothin’ — just peanuts, chump change, hardly worth noticing. The Mars Reconnaissance Orbiter has now spotted a gigantic Martian dust devil roughly 20 kilometers (12 miles) high, churning through the Amazonis Planitia region of northern Mars. The HiRISE camera (High Resolution Imaging Science Experiment) captured the event on March 14, 2012. Scientists say that despite its height, the plume is just 70 meters (70 yards) wide.

Yikes! After seeing trucks thrown about by the tornadoes in Dallas yesterday, it makes you wonder how the MER rovers and even the Curiosity rover would fare in an encounter with a 20-km high twister.

The image was taken during late northern spring, two weeks short of the northern summer solstice, a time when the ground in the northern mid-latitudes is being heated most strongly by the sun.

Dust devils are spinning columns of air, made visible by the dust they pull off the ground. Unlike a tornado, a dust devil typically forms on a clear day when the ground is heated by the sun, warming the air just above the ground. As heated air near the surface rises quickly through a small pocket of cooler air above it, the air may begin to rotate, if conditions are just right.

Obviously, conditions were more than just right to create such a whopper.

Source: JPL

Clouds Get in the Way on Mars

Clouds give a fuzzy view of ice-topped dunes on Mars. Credit: NASA/JPL/University of Arizona

[/caption]

The science team from the HiRISE camera on the Mars Reconnaissance Orbiter wanted to take another look at a region of icy sand dunes on Mars to look for seasonal changes as spring is now arriving on the Red Planet’s northern hemisphere. But the view was obstructed by clouds, creating this unusual hazy view.

“This happens occasionally. We’ve found that weather forecasting on Mars is just as challenging — if not more — than on Earth,” said HiRISE team member Candy Hansen, who I nabbed in the hallway during the Lunar and Planetary Science Conference today, to ask about this unique image. “The clouds are likely made of water ice crystals, and the dunes have a coating of CO2 ice that is just starting to sublimate away as the Sun’s rays are getting stronger in this region.”

Hansen said these are dark barchan, or crescent-shaped dunes. During the winter, this region was completely covered with carbon dioxide ice, but now just the the tops of the dune have ice; also visible are what looks like white cracks, which is ice protected in shallow grooves on the ground. HiRISE will likely check back on this region later during the Martian summer to provide the science team with a seasonal sequence portfolio of images of the region, a benefit of having a mission in orbit for several years. MRO and HiRISE are workhorses, having been in orbit since March of 2006.

See the original image on the HiRISE website.

Fears of Tornado Catastrophes Due to Global Warming Unfounded

Tornadoes in the Midwest US, March 2, 2012 Tornadoes swept the Midwest US on March 2, 2012. In this image, clouds are rendered using thermal infrared (heat) and visible imagery from the Geostationary Operational Environmental Satellite-East (GOES-East). Background land information is from the Moderate Resolution Imaging Spectroradiometer (MODIS). Image credit: NOAA-NASA GOES Project/NASA Earth Observatory.

[/caption]

The 2012 tornado season got off to a rousing start. Between February 28th and March 3rd, two deadly storm systems developed in the southern United States. The storms spawned numerous tornadoes that together killed at least 52 people. This kind of extreme tornado activity, so early in the year, has fueled fears that global warming will increase the severity and duration of the tornado season. But, scientific studies show that this is not necessarily to be expected.

Early tornadoes are not unheard of. For example, on February 29 in 1952, two tornadoes caused severe damage in the south-eastern US. But this year, the number of early tornadoes has been much higher. The National Oceanic and Atmospheric Administration reported that in January of 2012, the tornado total was 95, much higher than the 1991–2010 average of 35. And the five-day total for February 28 to March 3 could rank as the highest ever since record-keeping began in 1950, according to meteorologist Dr. Jeff Masters, co-founder of the Weather Underground. With such a record-breaking start, it is not surprising people worry that a more severe 2012 storm season is ahead, and that global warming is to blame.

Tornadoes form when warm and moist air from the Gulf of Mexico meets with very cold and dry air above, which was brought south from the arctic. The collision of these air masses, which have different densities, as well as speeds and directions of motion, forces them to want to switch places very rapidly. This creates updrafts of warm and wet air, which produce thunderstorms. And, as the updrafts climb through the atmosphere, they encounter fast- moving jet stream winds, which change speed and direction with altitude. These changes give the updraft a strong twisting motion that spawns tornadoes.

The severity of tornadoes is rated on the Fujita Scale, which examines how much damage is left after a tornado has passed: F0-F1 tornadoes produce minor damage and so are considered weak, F2-F3 tornadoes produce significant damage and are considered strong, and F4-F5 tornadoes produce severe damage and are considered violent. The problem with this ranking is that it is related to a human-based assessment of damage; you need something (buildings, vegetation, etc.) to be destroyed and someone to see the damage. So, a severe tornado that occurs somewhere where there is nothing to be destroyed would be classed as weak, and one that occurs where there is no-one to see the damage wouldn’t even be counted.

National Oceanic and Atmospheric Administration's VORTEX-99 team observed several tornadoes on May 3, 1999, in central Oklahoma. The tube-like funnel is attached at the top to a rotating cloud base and surrounded by a translucent dust cloud near the ground. Image credit: NOAA.

Still, tornado awareness and volunteer reporting programs, along with good record-keeping, have significantly improved our understanding of tornadoes and their frequency. Surprisingly, the Storm Prediction Center’s tornado database, which goes back to 1950, does not show an increasing trend in recent tornadoes. This finding is confirmed by Dr. Stanley Changnon from the University of Illinois at Urbana-Champaign, whose study of insurance industry records was published last year. Dr. Changnon’s work shows that tornado catastrophes and their losses peaked in the years between 1966 and 1973, but have shown no upward trend since that time. In fact, the number of the most damaging storms, those rated as F2 to F5 has actually decreased over the past 5 decades. So, it does not appear that global warming is increasing the number of tornadoes that occur.

This is actually not as surprising as it seems. While a local increase in temperature and humidity, whether caused by global warming or not, would be expected to create more thunderstorms, it is not clear that these thunderstorms would spawn tornadoes. The reason is that global warming does not increase temperatures the same everywhere. Warming at the poles is expected to exceed warming at more southern latitudes. This means that cold polar air will be much less colder than before and warm Gulf of Mexico air will only be slightly warmer. When these two air masses meet above the southern US, the temperature difference between them will not be so great and their drive to swap places will be much less intense. The result will be a significantly slower moving updraft of warm air that is not expected to produce as many extreme thunderstorms or spawn as many tornadoes.

So, global warming is not expected to increase the total frequency of tornado activity. However, warming global temperatures will mean an earlier spring and the potential for earlier tornadoes. In fact, the early tornado numbers we’ve seen so far this year may be a sign of a global warming-induced shift in the tornado season, according to Dr. Masters. If this is the case, the tornado season may start earlier, but it will also end earlier. As meteorologist Harold Brooks from the National Severe Storms Laboratory in Norman, Oklahoma, points out, this record start to the 2012 tornado season does not necessarily mean the rest of the season will be severe.

Sources:
Recap of deadly U.S. tornado outbreak February 28-March 3, 2012, M. Daniel, EarthSky Mar 5, 2012.
NASA Earth Observatory, March 5, 2012.
Temporal distribution of weather catastrophes in the USA, S.A. Changnon, Climatic Change 106 (2), 129-140, 2011, doi: 10.1007/s10584-010-9927-1.
Does Global Warming Influence Tornado Activity? Diffenbaugh et al., EOS 89 (53), 553-554, 2008.

Today’s Martian Weather: Partly Cloudy

Clouds obscure the surface of Mars (NASA/JPL/ASU)

[/caption]

Changing seasons in Mars’ northern hemisphere brings a change in the weather, and the clouds have rolled in to cover part of the polar surface in this intriguing image from the Mars Odyssey spacecraft.

Mars Odyssey’s THEMIS visual imager (VIS) captured this image on Jan. 24, 2012, as it passed over the Red Planet’s northern pole during one of its 2-hour-long orbits.

Clouds on Mars have been seen before, both from orbit and from the surface. They are made up of fine water ice particles and are usually at altitudes of 10 to 15 km high. Read more about Martian weather here.

The full THEMIS scan of the area is below.

Martian polar clouds as seen by THEMIS

The area imaged is about 21 km wide by 73 km high  (13 x 45 miles).

Image credit: NASA / JPL / Arizona State University. Hat-tip to Mr. Bill Dunford at Riding With Robots (@ridingrobots). 

Getting to the Core of Earth’s Falling Snow

Visualization of the GPM Core Observatory and Partner Satellites. Credit: NASA

[/caption]

An international plan is unfolding that will launch satellites into orbit to study global snowfall precipitation with unprecedented detail. With the upcoming Global Precipitation Measurement (GPM) satellites, for the first time we will know when, where and how much snow falls on Earth, allowing greater understanding of energy cycles and how best to predict extreme weather.

Snow is more than just a pretty winter decoration… it’s also a very important contributor to fresh water supply in many regions around the world, especially those areas that rely on spring runoff from mountains.

The snowmelt from the Sierra Nevadas, for example, accounts for a third of the water supply for California.

But changing climate and recent drought conditions have affected how much snow the mountains receive in winter… and thus how much water is released in the spring. Unfortunately, as of now there’s no reliable way to comprehensively detect and measure falling snow from space… whether in the Sierras or the Andes or the Alps.

Engineers are building and testing the GPM Core Observatory at Goddard Space Flight Center. (NASA/GSFC)

The GPM Core satellite, slated to launch in 2014, will change that.

“The GPM Core, with its ability to detect falling snows, it’s one of the very first times that we’ve put sensors in space to specifically look at falling snow,” said GPM Deputy Project Scientist Gail Skofronick-Jackson in an online video. “We’re at that edge where rain was fifty years ago. We’re still figuring out how to measure snow.”

And why is snow such a difficult subject to study?

“Rain tends to be spherical like drops,” says Skofronick-Jackson. “But if you’ve ever been out in a snowfall and you’ve looked at your shirt, you see the snow comes in all different forms.”

Once GPM scientists calculate all the various types of snowflake shapes, the satellite will be able to detect them from orbit.

“The GPM Core, with its additional frequencies and information on the sensors, is going to be able to provide us for the first time a lot more information about falling snow than we’ve ever done before.”

Knowing where and how much snow and rain falls globally is vital to understanding how weather and climate impact both our environment and Earth’s energy cycles, including effects on agriculture, fresh water availability, and responses to natural disasters.

Snowfall is a missing part of the puzzle, and GPM will fill those pieces in.

Find out more about the GPM program at pmm.nasa.gov/GPM.

GPM Core is currently being assembled at NASA’s Goddard Space Flight Center and scheduled to launch in 2014 on a Japanese H-IIA rocket.  Initiated by NASA and the Japanese Aerospace Exploration Agency (JAXA), GPM consists of a consortium of international agencies, including the Centre National d’Études Spatiales (CNES), the Indian Space Research Organization (ISRO), the National Oceanic and Atmospheric Administration (NOAA), the European Organization for the Exploitation of Meteorological Satellites (EUMETSAT), and others.