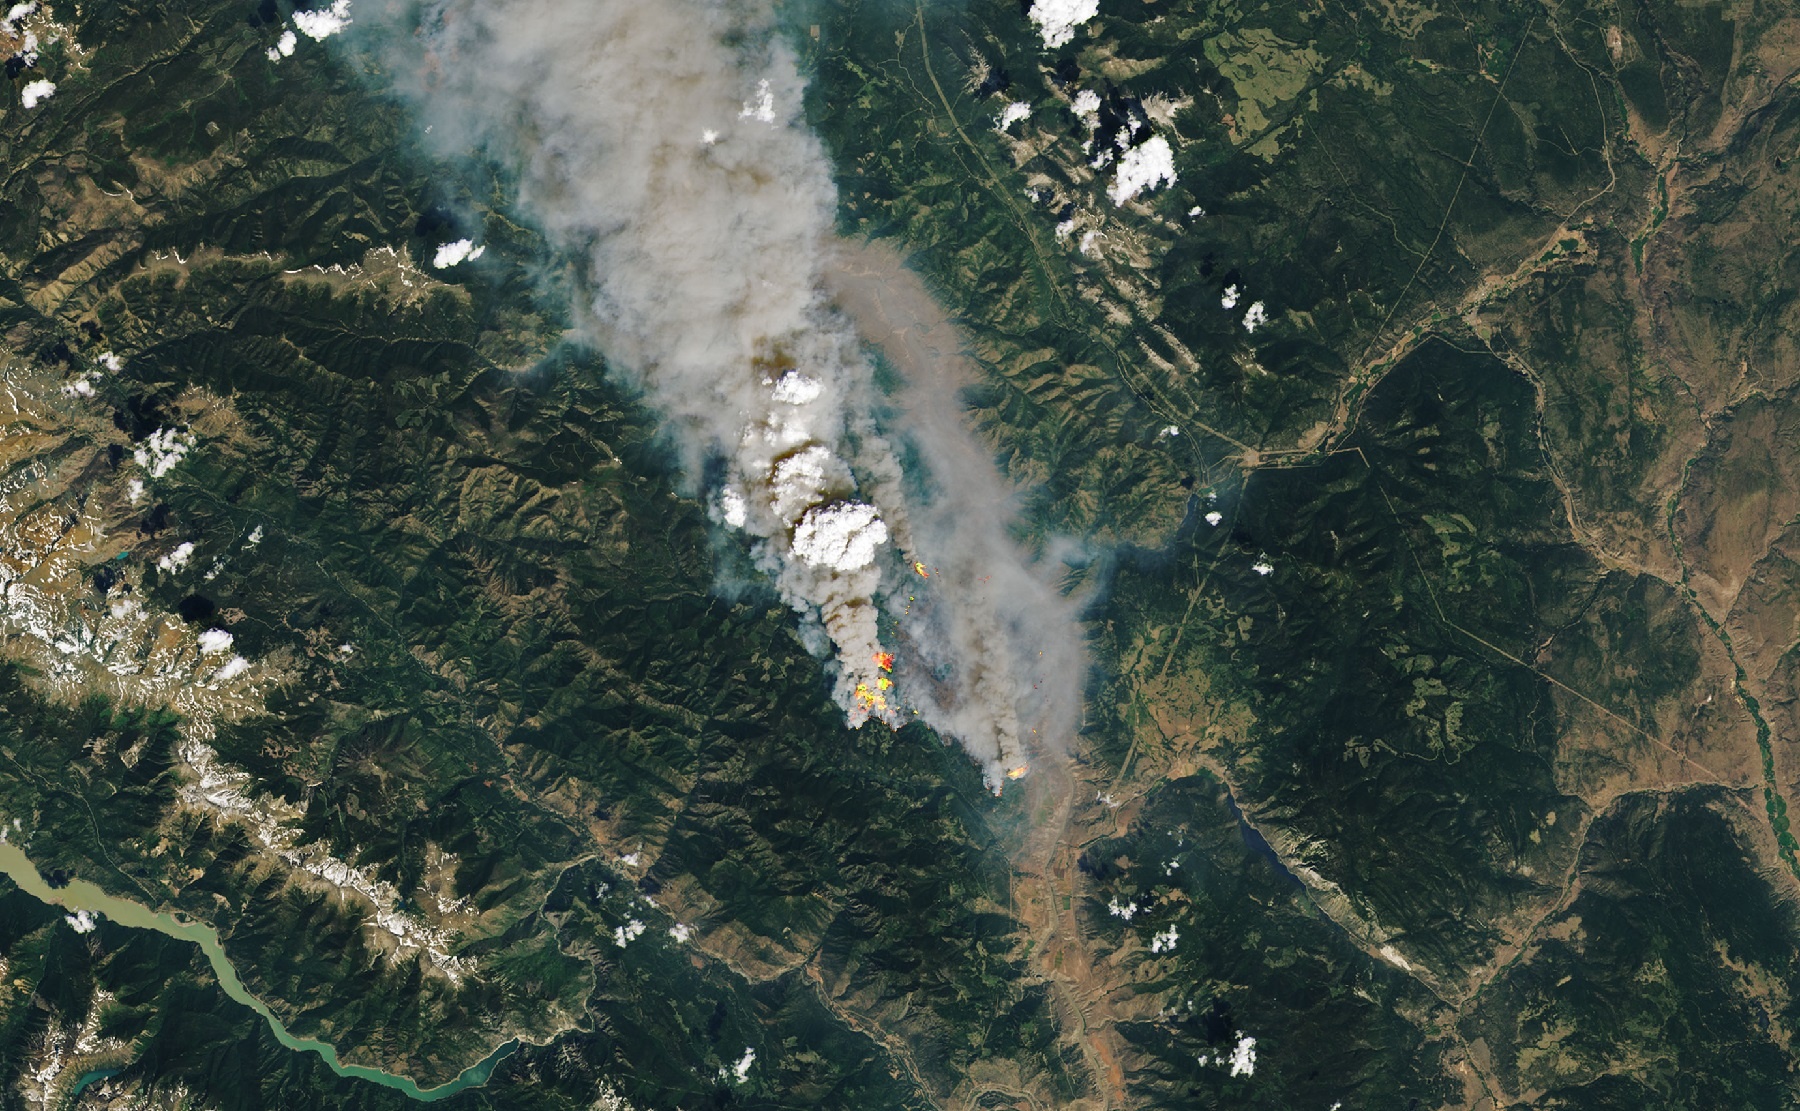
Image taken by the Landsat 8 OLI on June 30th, 2021. Credit: NASA EO
Every day, there are more indications that show how anthropogenic factors are causing uncomfortable changes in our climate. Here in beautiful British Columbia, this means that wildfires are once again threatening countless acres of forests, communities, and wildlife. By the end of June 2021, more than 40 wildfires were raging across the province, including a rather substantial cluster around the town of Lytton.
Located just 150 km (about 93 mi) northeast of the city of Vancouver, Lytton, had to be evacuated on June 30th after an extreme heatwave led to wildfire sweeping through the area. These wildfires and the impact they were having at the time was being monitored by some of NASA’s Earth Observatory satellites. In a series of images recently shared on their website, they show the fires that were raging near Lytton just hours before the evacuation.
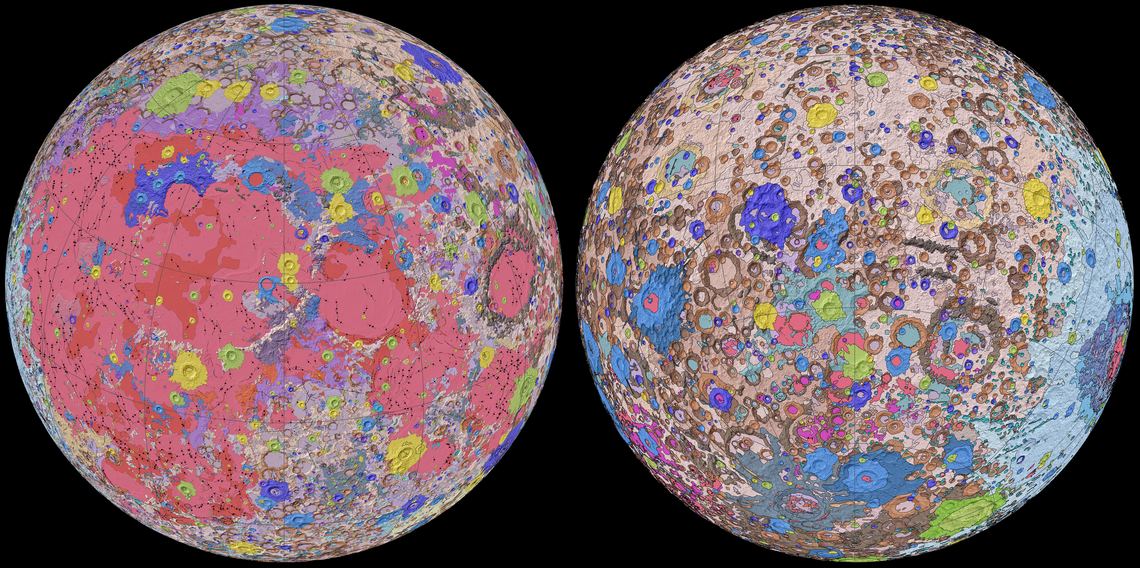
A geological map of the Moon showing different formations and mineral deposits. Credit: NASA/GSFC/USGS
The prospect of mining asteroids and the Moon is on a lot of peoples’ minds lately. Maybe it’s all the growth that’s happened in the commercial aerospace industry in the past few decades. Or perhaps it’s because of Trump’s recent executive order to allow for asteroid and lunar mining. Either way, there is no shortage of entrepreneurs and futurists who can’t wait to start prospecting and harvest the natural bounty of space!
Coincidentally enough, future lunar miners now have a complete map of the lunar surface, which was created by the US Geological Society’s (USGS) Astrogeology Science Center, in collaboration with NASA and the Lunar Planetary Institute (LPI). This map shows the distribution and classification of the mineral deposits on the Moon’s surface, effectively letting us know what its familiar patchwork of light and dark patches the really are.
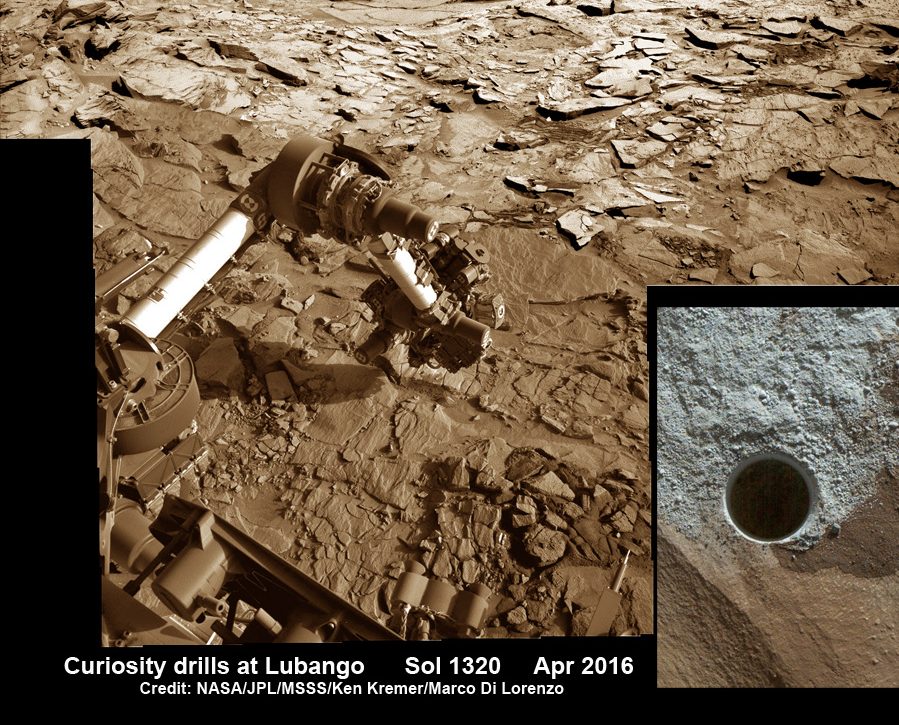
Curiosity rover reached out with robotic arm and drilled into ‘Lubango’ outcrop target on Sol 1320, Apr. 23, 2016, in this photo mosaic stitched from navcam camera raw images and colorized. Lubango is located in the Stimson unit on the lower slopes of Mount Sharp inside Gale Crater. MAHLI camera inset image shows drill hole up close on Sol 1321. Credit: NASA/JPL/MSSS/Ken Kremer/kenkremer.com/Marco Di Lorenzo
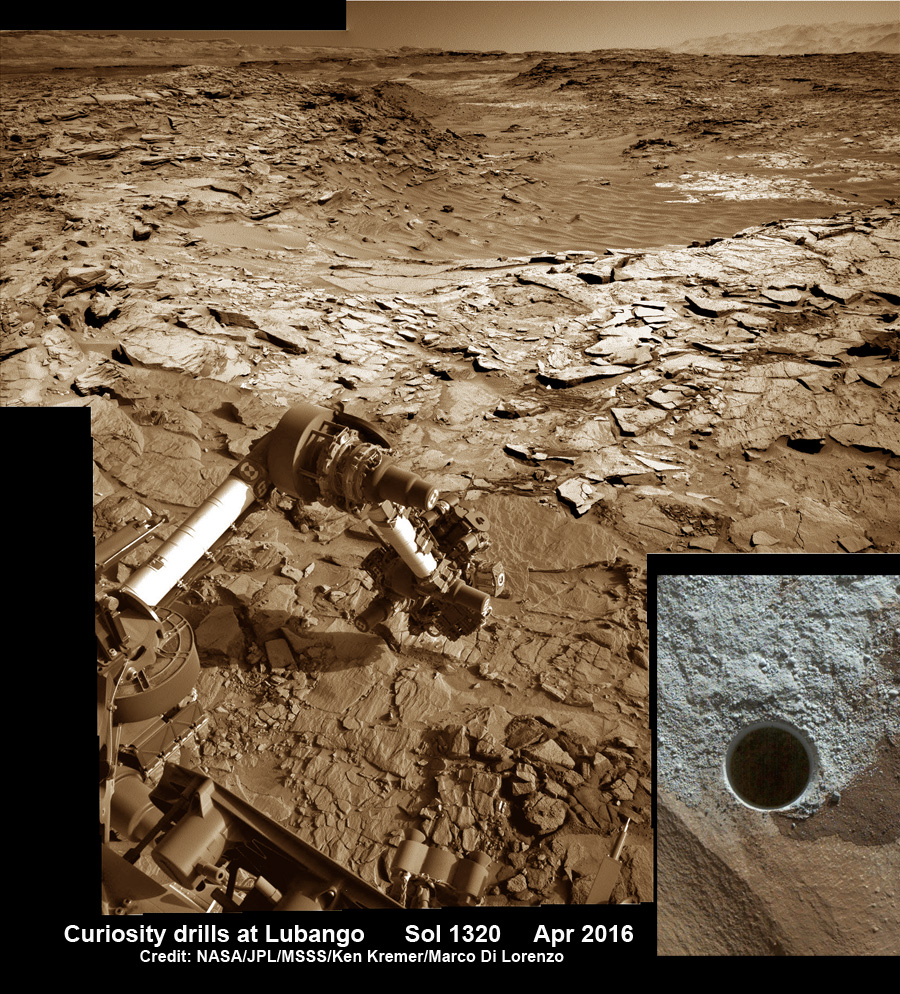
Curiosity rover reached out with robotic arm and drilled into ‘Lubango’ outcrop target on Sol 1320, Apr. 23, 2016, in this photo mosaic stitched from navcam camera raw images and colorized. Lubango is located in the Stimson unit on the lower slopes of Mount Sharp inside Gale Crater. MAHLI camera inset image shows drill hole up close on Sol 1321. Credit: NASA/JPL/MSSS/Ken Kremer/kenkremer.com/Marco Di Lorenzo
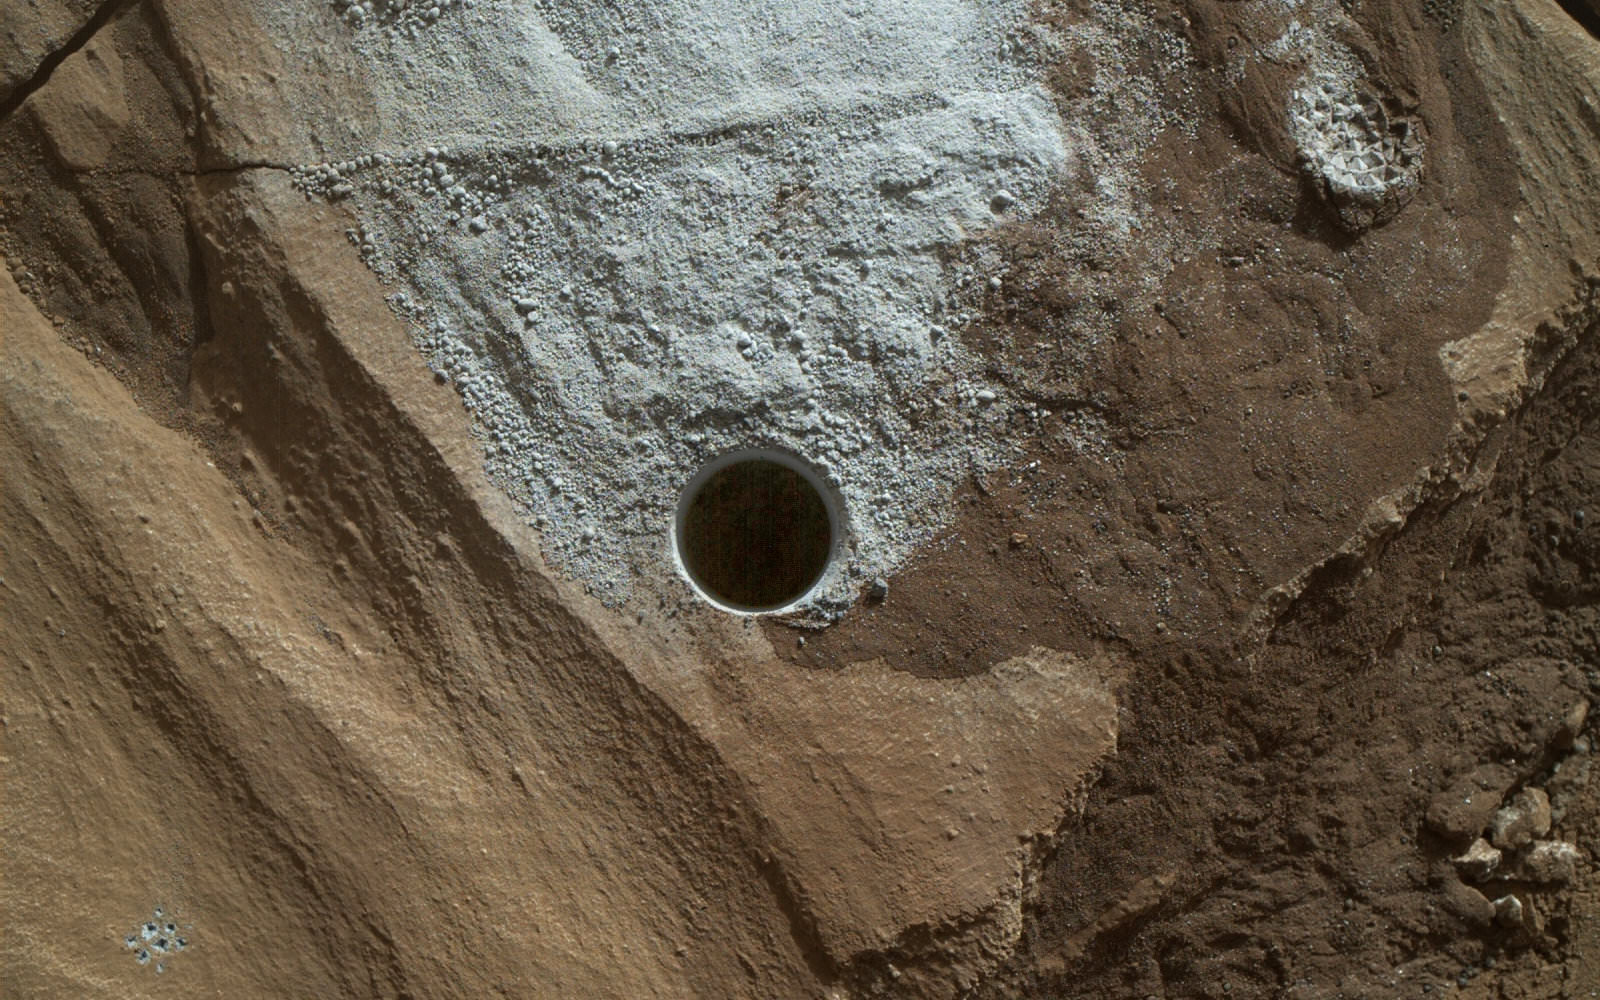
NASA’s CuriosityMars Science Laboratory (MSL) rover successfully bored a brand new hole in Mars at a tantalizing sandstone outcrop in the ‘Lubango’ fracture zone this past weekend on Sol 1320, Apr. 23, and is now carefully analyzing the shaken and sieved drill tailings for clues to Mars watery past atop the Naukluft Plateau.
“We have a new drill hole on Mars!” reported Ken Herkenhoff, Research Geologist at the USGS Astrogeology Science Center and an MSL science team member, in a mission update.
“All of the activities planned for last weekend have completed successfully.”
“Lubango” counts as the 10th drilling campaign since the one ton rover safely touched down on the Red Planet some 44 months ago inside the targeted Gale Crater landing site, following the nailbiting and never before used ‘sky crane’ maneuver.
After transferring the cored sample to the CHIMRA instrument for sieving it, a portion of the less than 0.15 mm filtered material was successfully delivered this week to the CheMin miniaturized chemistry lab situated in the rovers belly.
CheMin is now analyzing the sample and will return mineralogical data back to scientists on earth for interpretation.
The science team selected Lubango as the robots 10th drill target after determining that it was altered sandstone bedrock and had an unusually high silica content based on analyses carried out using the mast mounted ChemCam laser instrument.
Indeed the rover had already driven away for further scouting and the team then decided to return to Lubango after examining the ChemCam results. They determined the ChemCam and other data observation were encouraging enough – regarding how best to sample both altered and unaltered Stimson bedrock – to change course and drive backwards.
Lubango sits along a fracture in an area that the team dubs the Stimson formation, which is located on the lower slopes of humongous Mount Sharp inside Gale Crater.
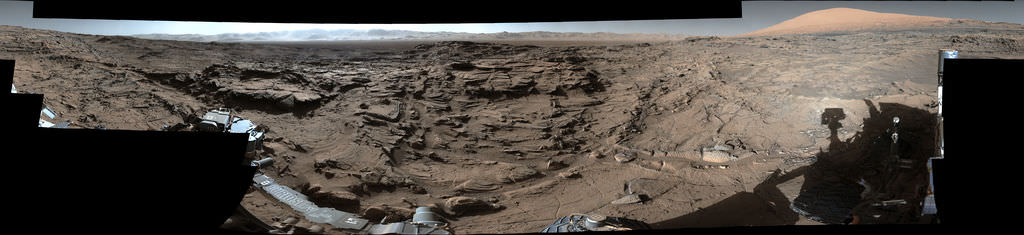
This mid-afternoon, 360-degree panorama was acquired by the Mast Camera (Mastcam) on NASA’s Curiosity Mars rover on April 4, 2016, as part of long-term campaign to document the context and details of the geology and landforms along Curiosity’s traverse since landing in August 2012. Credit: NASA/JPL-Caltech/MSSS
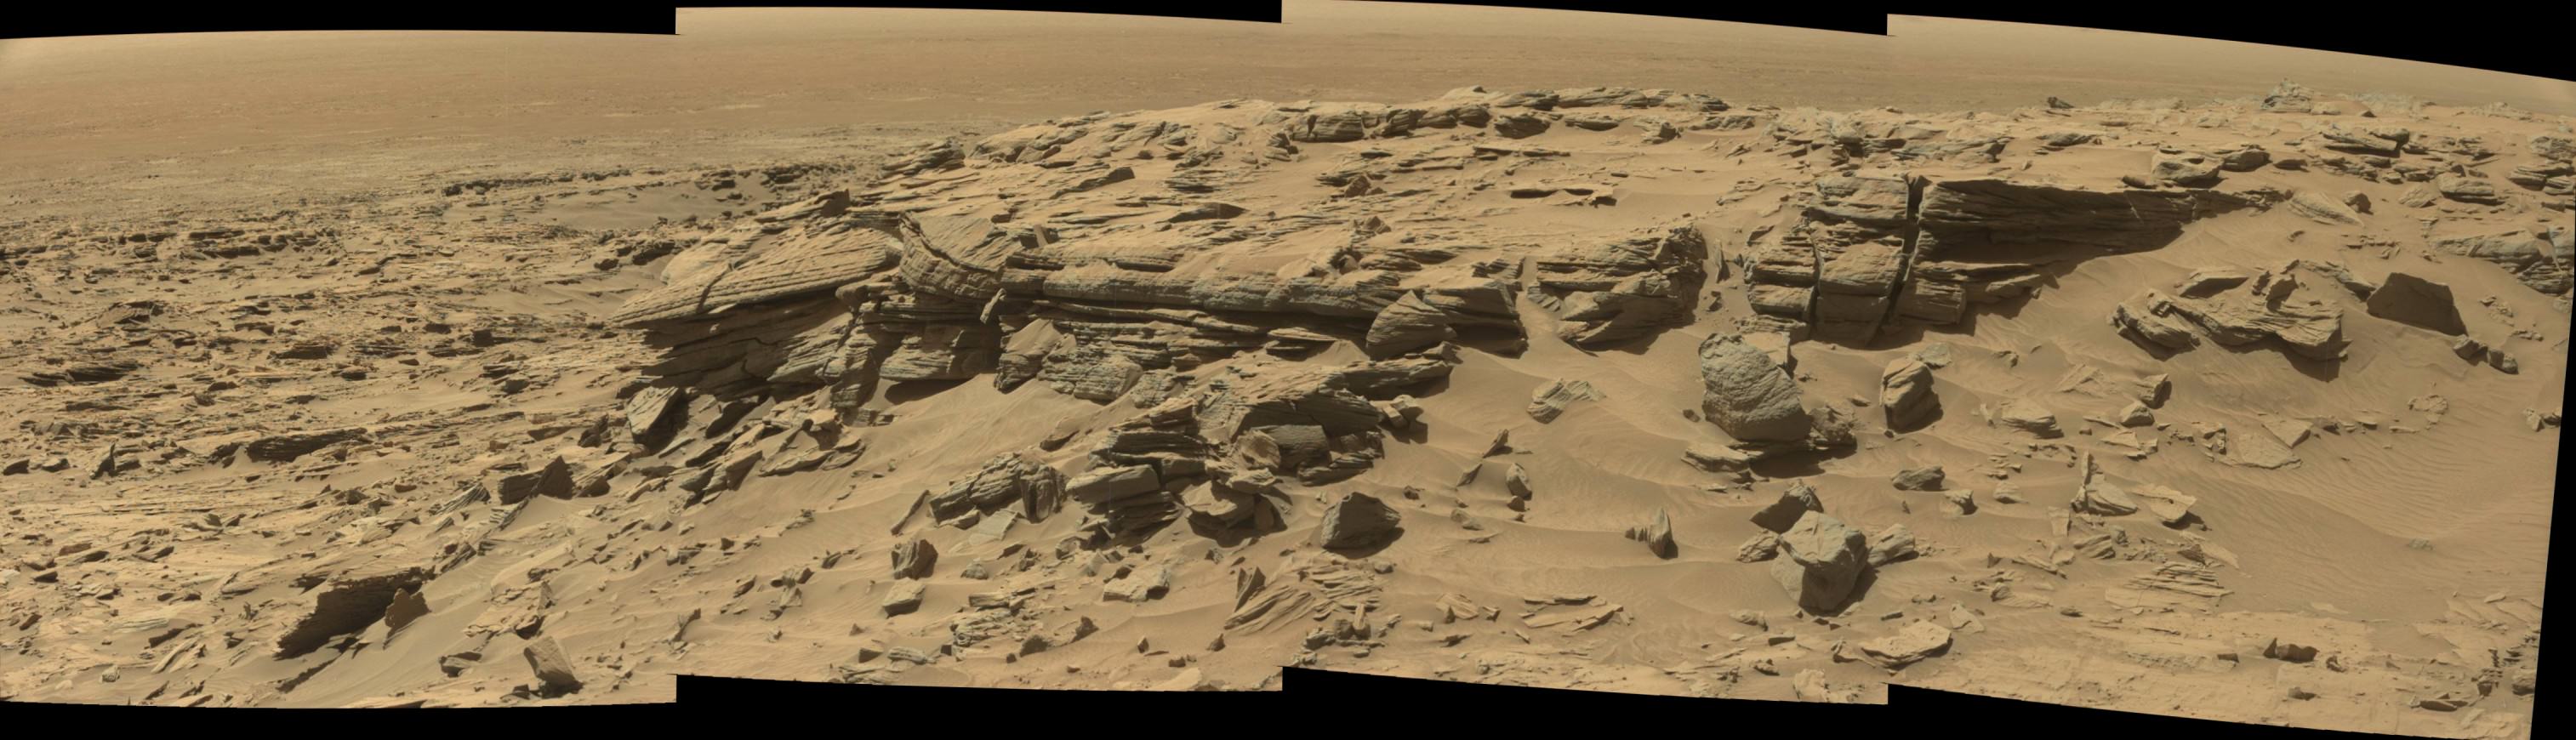
Since early March, the rover has been traversing along a rugged region dubbed the Naukluft Plateau.
“The team decided to drill near this fracture to better understand both the altered and unaltered Stimson bedrock,” noted Herkenhoff.
See our photo mosaic above showing the geologically exciting terrain surrounding Curiosity with its outstretched 7-foot-long (2-meter-long) robotic arm after completing the Lubango drill campaign on Sol 1320. The mosaic was created by the imaging team of Ken Kremer and Marco Di Lorenzo.
Its again abundantly clear from the images that beneath the rusty veneer of the Red Planet lies a greyish interior preserving the secrets of Mars ancient climate history.
Curiosity rover views ‘Lubango’ drill target up close in this MAHLI camera image taken on Sol 1321, Apr. 24, 2016, processed to enhance details. Credit: NASA/JPL/MSSS/Marco Di Lorenzo/Ken Kremer/kenkremer.com
The team then commanded Curiosity to dump the unsieved portion of the sample onto the ground and examine the leftover drill tailing residues with the Mastcam, Navcam, MAHLI multispectral characterization cameras and the APXS spectrometer. ChemCam is also being used to fire laser shots in the wall of the drill hole to make additional chemical measurements.
To complement the data from Lubango, scientists are now looking around the area for a suitable target of unaltered Stimson bedrock as the 11th drill target.
“The color information provided by Mastcam is really helpful in distinguishing altered versus unaltered bedrock,” explained MSL science team member Lauren Edgar, Research Geologist at the USGS Astrogeology Science Center, in a mission update.
The ChemCam laser has already shot at the spot dubbed “Oshikati,” a potential target for the next drilling campaign.
“On Sunday we will drive to our next drilling location, which is on a nearby patch of normal-looking Stimson sandstone,” wrote Ryan Anderson, planetary scientist at the USGS Astrogeology Science Center and a member of the ChemCam team on MSL in today’s (Apr. 28) mission update.
As time permits, the Navcam imager is also being used to search for dust devils.
As I reported here, Opportunity recently detected a beautiful looking dust devil on the floor of Endeavour crater on April 1. Dust devil detections by the NASA rovers are relatively rare.
Curiosity has been driving to the edge of the Naukluft Plateau to reach the interesting fracture zone seen in orbital data gathered from NASA’s Mars orbiter spacecraft.
Curiosity images Naukluft Plateau in this photo mosaic stitched from Mastcam camera raw images taken on Sol1296. Credit: NASA/JPL/MSSS/Marco Di Lorenzo/Ken Kremer/kenkremer.com
The rover is almost finished crossing the Naukluft Plateau which is “the most rugged and difficult-to-navigate terrain encountered during the mission’s 44 months on Mars,” says NASA.
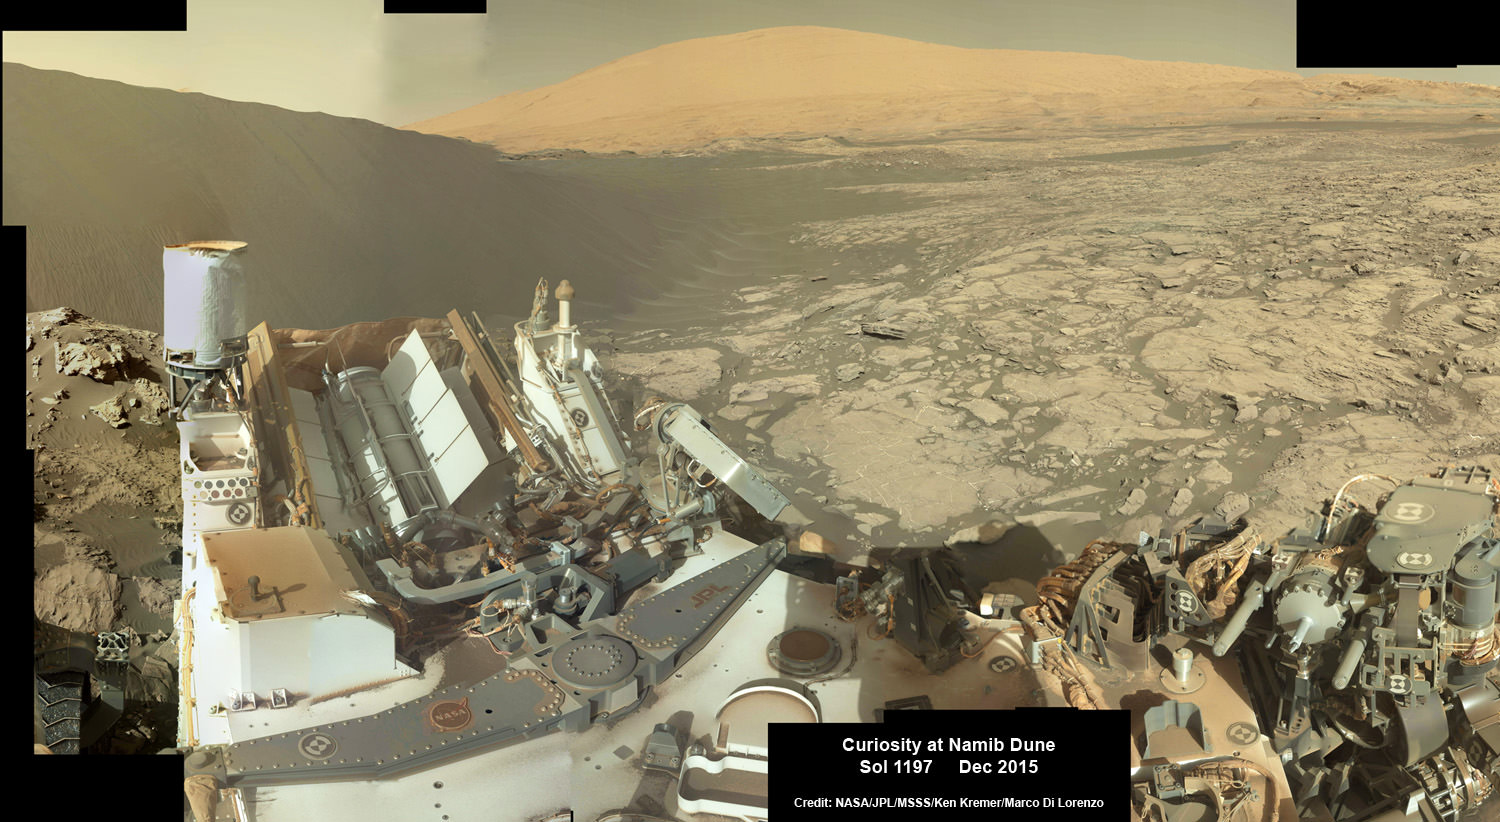
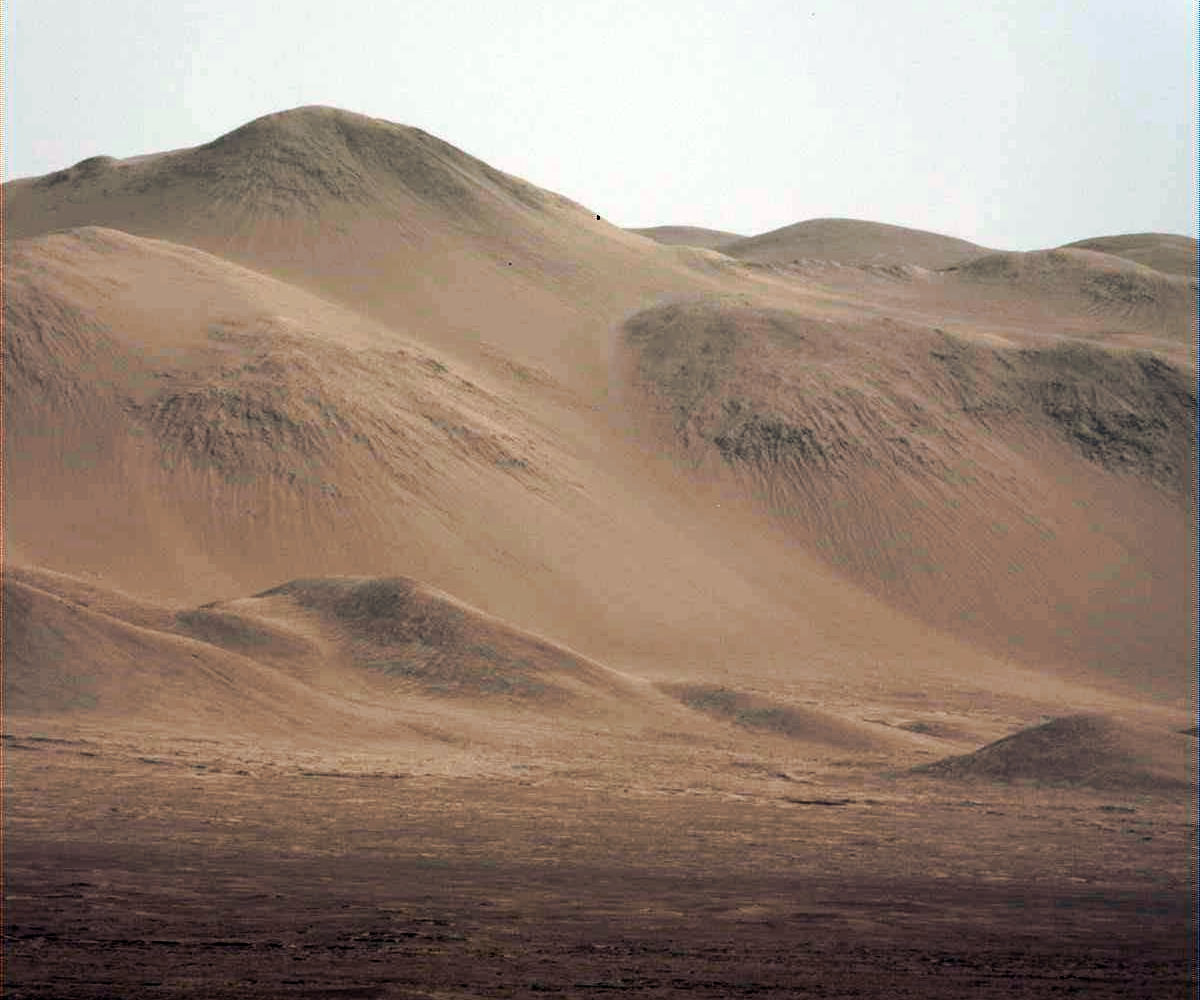
Curiosity explores Red Planet paradise at Namib Dune during Christmas 2015 – backdropped by Mount Sharp. Curiosity took first ever self-portrait with Mastcam color camera after arriving at the lee face of Namib Dune. This photo mosaic shows a portion of the full self portrait and is stitched from Mastcam color camera raw images taken on Sol 1197, Dec. 19, 2015. Credit: NASA/JPL/MSSS/Ken Kremer/kenkremer.com/Marco Di Lorenzo
As of today, Sol 1325, April 28, 2016, Curiosity has driven over 7.9 miles (12.7 kilometers) since its August 2012 landing, and taken over 320,100 amazing images.
Spectacular Mastcam camera view of Gale Crater rim from Curiosity on Sol 1302 enhanced to bring out detail. Credit: NASA/JPL/MSSS/Marco Di Lorenzo/Ken Kremer/kenkremer.com
Stay tuned here for Ken’s continuing Earth and planetary science and human spaceflight news.
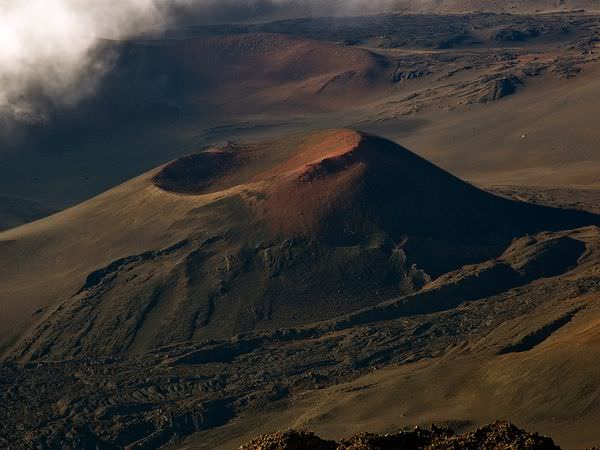
Haleakala, a giant shield volcano, forms the eastern bulwark of the island of Maui. Any volcanoes on an asteroid would not form large cones like this. Credit: National Geographic/Cathy Roberts
Hawaii is famous for its lovely mountains, tropical climate, and majestic oceanfront vistas. Another thing it is famous for is the string of volcanoes that dot its islands. As a land that sits atop a geographic hot spot – i.e. an area deep within the Earth’s mantle from which heat rises, forming magma that is then pushed to the surface – the island is also home to some serious volcanic activity.
Consider Haleakala, the massive shield volcano that constitutes more than 75% of the Hawaiian Island of Maui. The result of volcanic activity that took place roughly 1 million years ago, this volcano has played an active role in the geological and cultural history of the Hawaiian islands. Description and Naming: Like all shield volcanoes, Haleakala was formed from a series of highly fluid magma flows. This is the reason for its general appearance, as well as the designation – i.e. it resembles a broad shield lying on the ground. It’s tallest peak, which is named is Pu’u ‘Ula’ula (“Red Hill”) in native Hawaiian, measures 3,055 m (10,023 ft) tall.
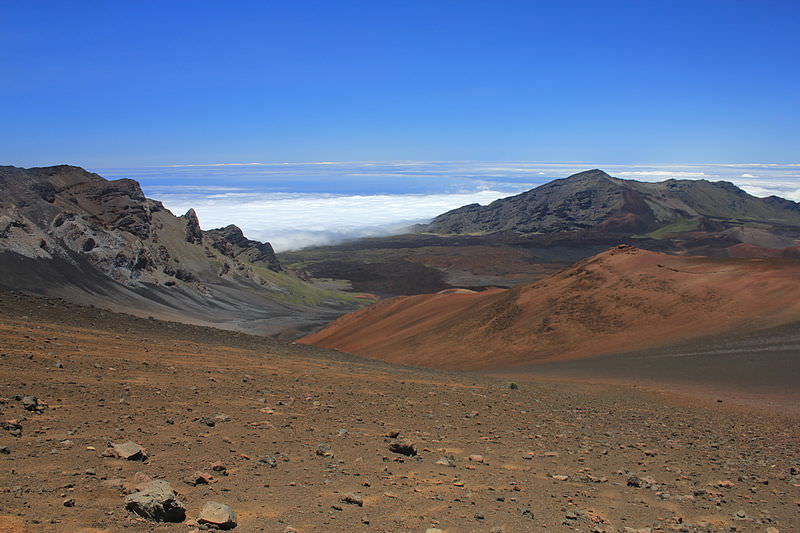
At Haleakala’s summit lies a massive depression (crater) that measures some 11.25 km (7 miles) in diameter and nearly 800 m (2,600 ft) deep. The name Haleakala means literally “House of the Sun”, which was given to the general mountain area by the early Hawaiian people.
Sliding sands trail in the Haleakala Crater, Maui. Credit: Haleakala National Park
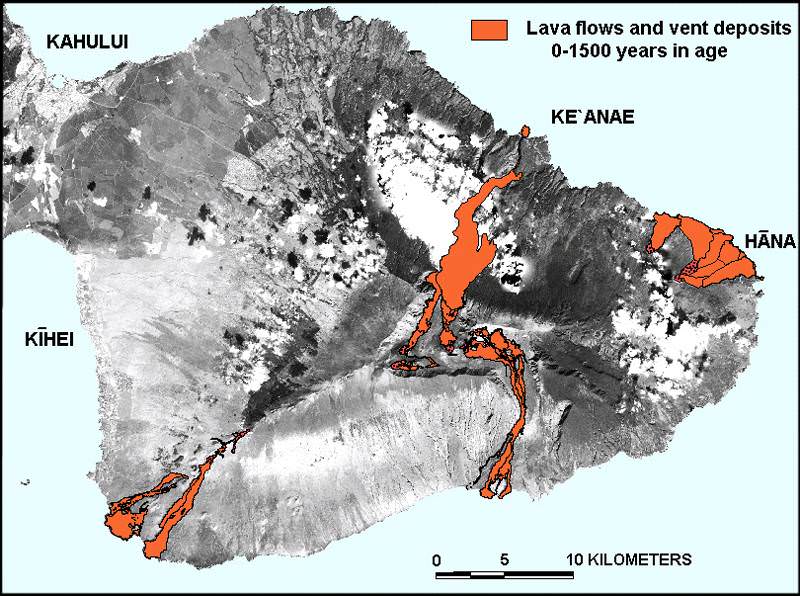
Geology: Haleakala is part of a sequence of lava flows that emerged near the end of East Maui. This region is believed to have begun experiencing lava flows about 2.0 million years ago, and it is estimated that the volcano formed from the ocean floor to its current shield-like shape over the course of the ensuing 600,000 years. The oldest exposed lava flow on East Maui is dated to 1.1 million years ago.
In the past 30,000 years, the volcanism on East Maui has been focused along the southwest and east rift zones. These two volcanic axes together form one gently curving arc that passes from La Perouse Bay (southwest flank of East Maui) through Haleakala Crater to Hana on the east flank.
The alignment of these axes continues east beneath the ocean as Haleakala Ridge, one of the longest rift zones along the Hawaiian Islands volcanic chain. The on-land segment of this lengthy volcanic line of vents is the zone of greatest hazard for future lava flows and cindery ash.
Contrary to popular belief, the Haleakala “crater” is not volcanic in origin, nor can it accurately be called a caldera (which is formed when the summit of a volcano collapses to form a depression). Scientists believe instead that the depression was formed when the headwalls of two large erosional valleys merged at the summit of the volcano.
Modern techniques have allowed geologists to accurately date the lava flows on Maui. Credit: D. Sherrod/USGS
History: Haleakala has produced numerous eruptions in the last 30,000 years, including in the last 500 years. The volcano has figured prominently in the island’s history of human occupation. In Hawaiian folklore, the crater at the summit was home to the grandmother of the demigod Maui. According to the legend, Maui’s grandmother helped him capture the sun and force it to slow its journey across the sky in order to lengthen the day.
Until recently, the East Maui Volcano was thought to have last erupted around 1790, based largely on comparisons of maps made during the voyages of the explorers La Perouse and George Vancouver. Recent advanced dating tests, however, have shown that the last eruption was more likely to have taken place in the 17th century.
Modern geologic mapping efforts began in 1997, which yielded the most detailed and accurate picture of Haleakala’s volcanic history to date. In addition, there are fears that the volcano is not extinct, but just currently dormant, and may erupt again within the next 500 years.
For these reasons, the U.S. Geological Survey maintains a sparse seismic network on Haleakala volcano and conducts periodic surveys, using GPS receivers that gather data about the volcano’s surface deformation or lack thereof.
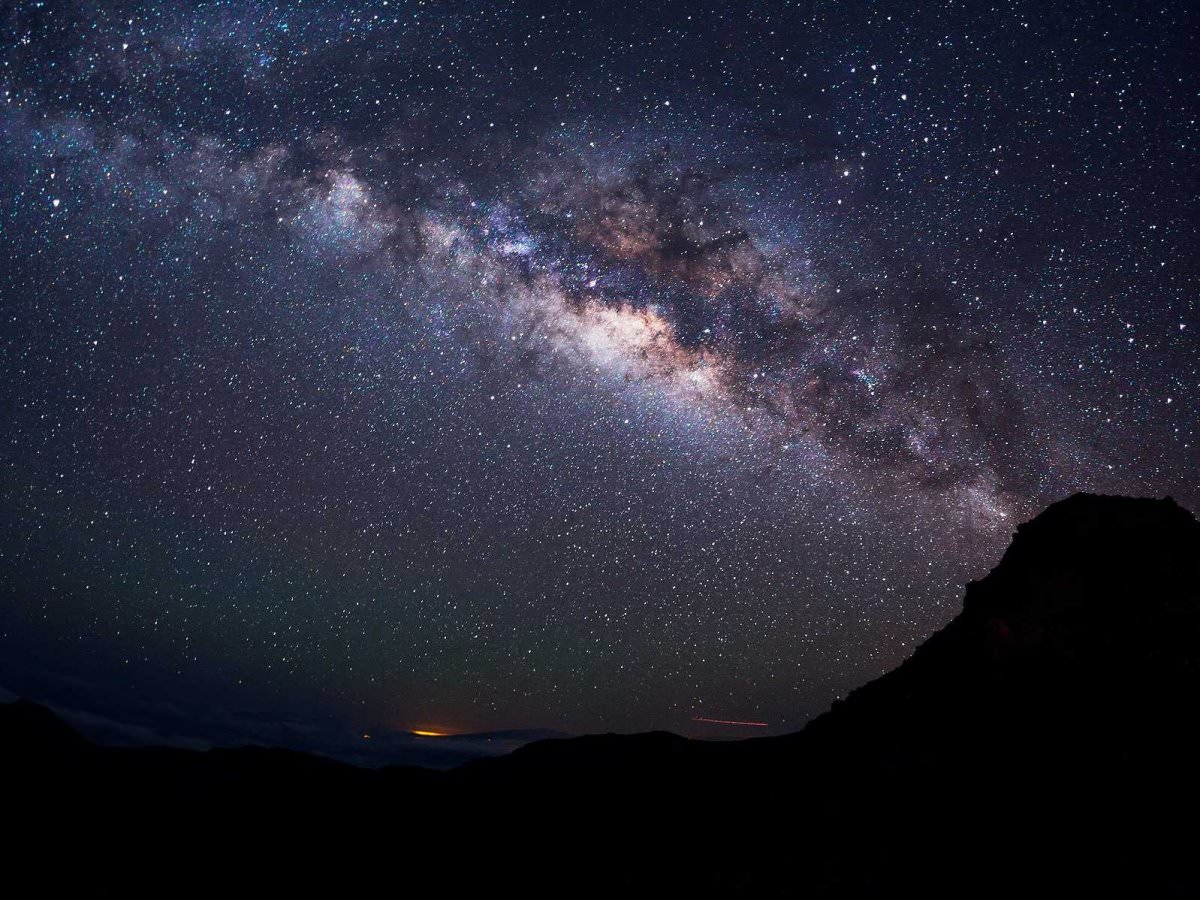
The view from Haleakala at night, Haleakala National Park. Credit: travelbloggerbuzz.com
Modern Uses: In 1916, Haleakala National Park was created, a 30,183-acre (122.15 km2) park surrounding the summit depression, Kipahulu Valley on the southeast, and ‘Ohe‘o Gulch (and pools), extending to the shoreline in the Kipahulu area. Within the park, 19,270 acres (77.98 km2) is a wilderness area, which is why the park area was designated an International Biosphere Reserve in 1980.
The main feature of this part of the park is the famous Haleakala Crater. Two main trails lead into the crater from the summit area – the Halemau’u and Sliding Sands trails. Haleakala is popular with tourists and locals alike, who often venture to its summit – or to the visitor center just below the summit – to view the sunrise. There is lodging in the crater in the form of a few simple cabins.
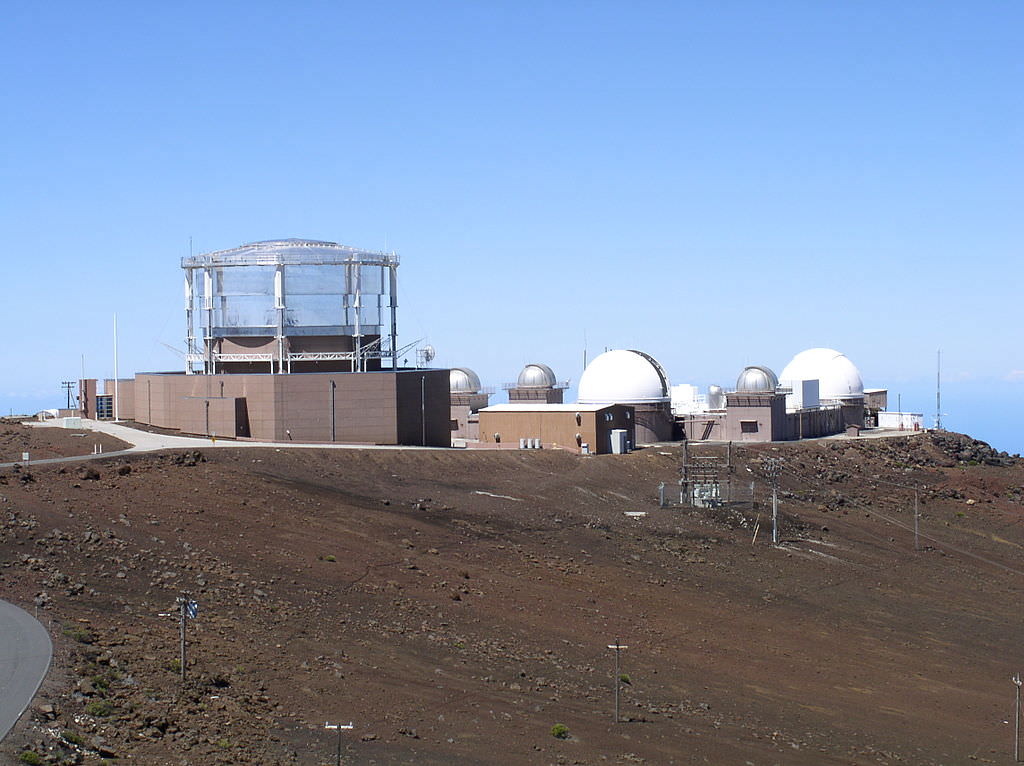
Because of the clarity and stillness of the air, the summit of Haleakala is one of the most valuable spots for observatories. It is also far enough away from the city lights to avoid light pollution, and above one-third of the planet’s atmosphere. Hence why the summit is the location of an astrophysical research facility – known as “Science City” – which is operated by a number of U.S. government and academic organizations.
These include the U.S. Department of Defense, the University of Hawaii, the Smithsonian Institution, the US Air Force, the Federal Aviation Administration (FAA), and others. Some of the telescopes operated by the US Department of Defense are involved in researching man-made (e.g. spacecraft, monitoring satellites, rockets, and laser technology) rather than celestial objects.
The Science City research faciltiy, located at the summit of the Haleakala volcano. Credit: Wikipedia Commons/Tawker
The scientific program is run in collaboration with defense contractors in the Maui Research and Technology Park in Kihei. Despite concerns that Maui’s growing population will mean increased incidents of light pollution, new telescopes are being added – such as the Pan-STARRS in 2006.
Although another 500 years or more may pass before Haleakala erupts again, it’s also possible that new eruptions will begin in the near future. However, according to the United States Geological Survey (USGS) Volcano Warning Scheme for the United States, the Volcanic-Alert Level as of June 2013 was “normal”. Given the likelihood of significant environmental and property damage, not to mention the potential loss of life, one can only hope this holds true for the foreseeable future.
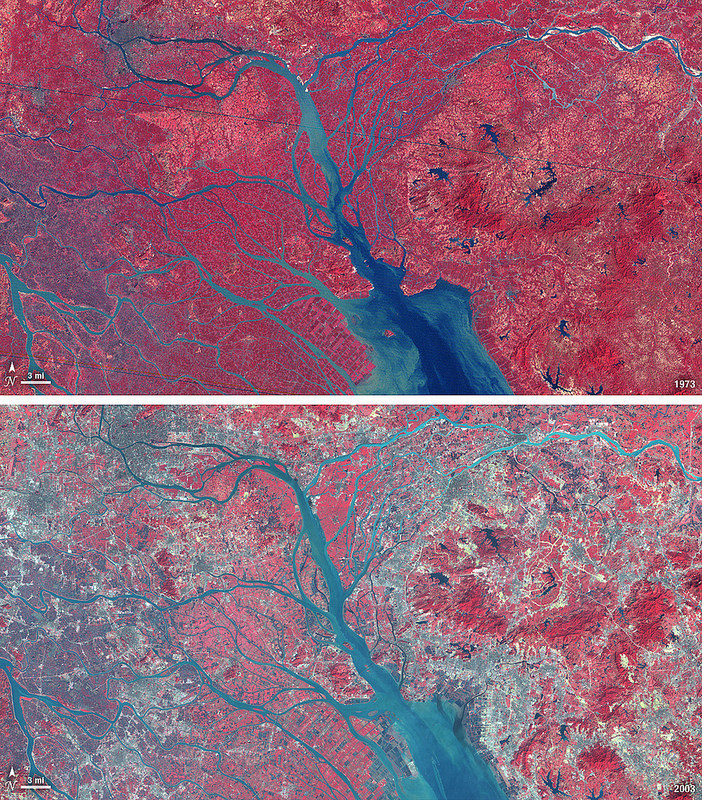
China's now-industrialized Pearl River Delta, seen in October 1973 (top) and January 2003 (bottom)
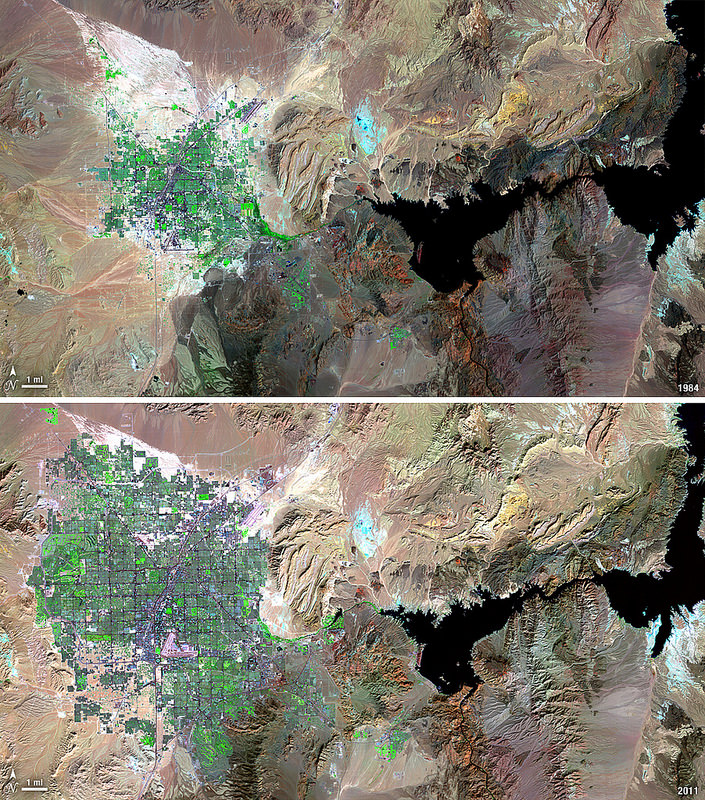
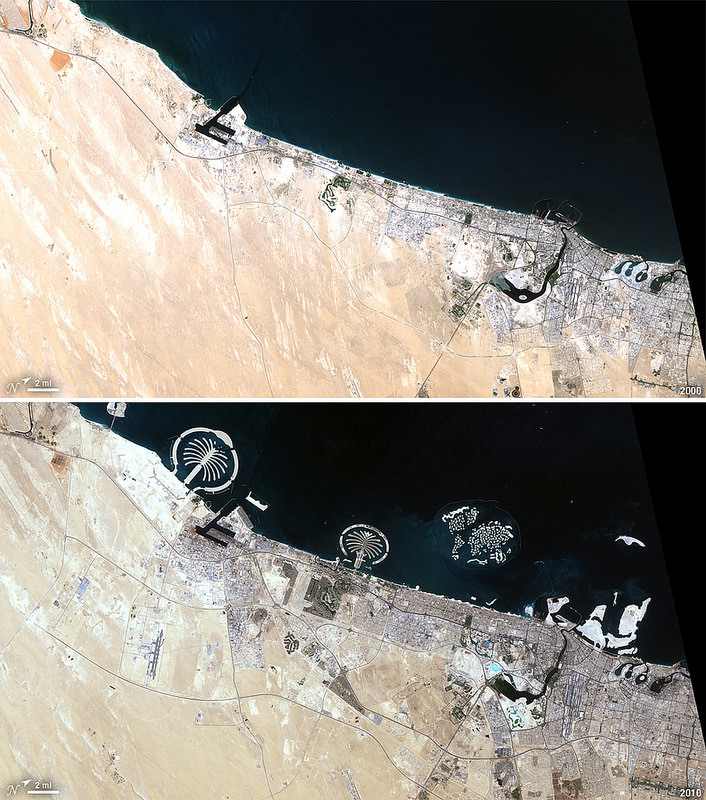
Since the launch of its first satellite in 1972, the eight NASA/USGS Landsat satellites have made the longest continuous observations of Earth’s surface, providing invaluable data for research in agriculture, geology, forestry, regional planning, education, mapping, global change research, as well as important emergency response and disaster relief information. In addition, having such a long span of data allows us to easily see the expansion of human development in many areas — unprecedented before-and-after views of city growth seen from space.
These images, taken over the course of the Landsat program, illustrate the visible impact of over three decades of human development:
Chandler, Arizona imaged in 1985 (top) and 2011 (bottom.) As its economy shifted from agriculture to manufacturing and electronics, Chandler’s population multiplied 8 times to over 236,000.
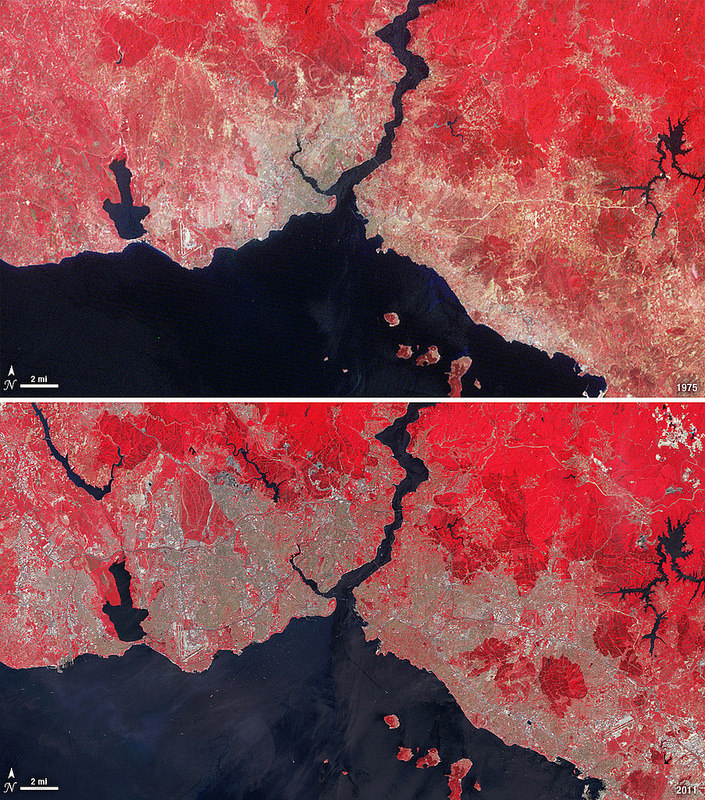
The explosion of Istanbul’s population from 2 to 13 million people is evident in these Landsat images, comparing 1975 to 2011. Vegetation appears red in the imaging wavelengths used here.
A few years ago one of the fastest-growing cities in the US, Las Vegas is seen here in images taken in 1984 (top) and 2011 (bottom.) The sprawling development — as well as the decrease in water level of Lake Mead — is evident.
Some of the most dramatic — and rapid — changes have occurred in Dubai, whose palm- and continent-shaped artificial islands suddenly appear between images taken in 2000 (top) and 2010 (bottom.) Once barely visible against the desert landscape, Dubai is now an international center of business, tourism, and oil production.
The Landsat Program is a series of Earth-observing satellite missions jointly managed by NASA and the U.S. Geological Survey. In 1972, the launch of ERTS-1 (Earth Resources Technology Satellite, later renamed Landsat 1) started the era of a series of satellites that have since continuously acquired space-based land remote sensing data.
The latest satellite in the Landsat series, the Landsat Data Continuity Mission (LDCM) — now named Landsat 8 — was launched on February 11, 2013. Landsat 8 data is now available free to the public online here.
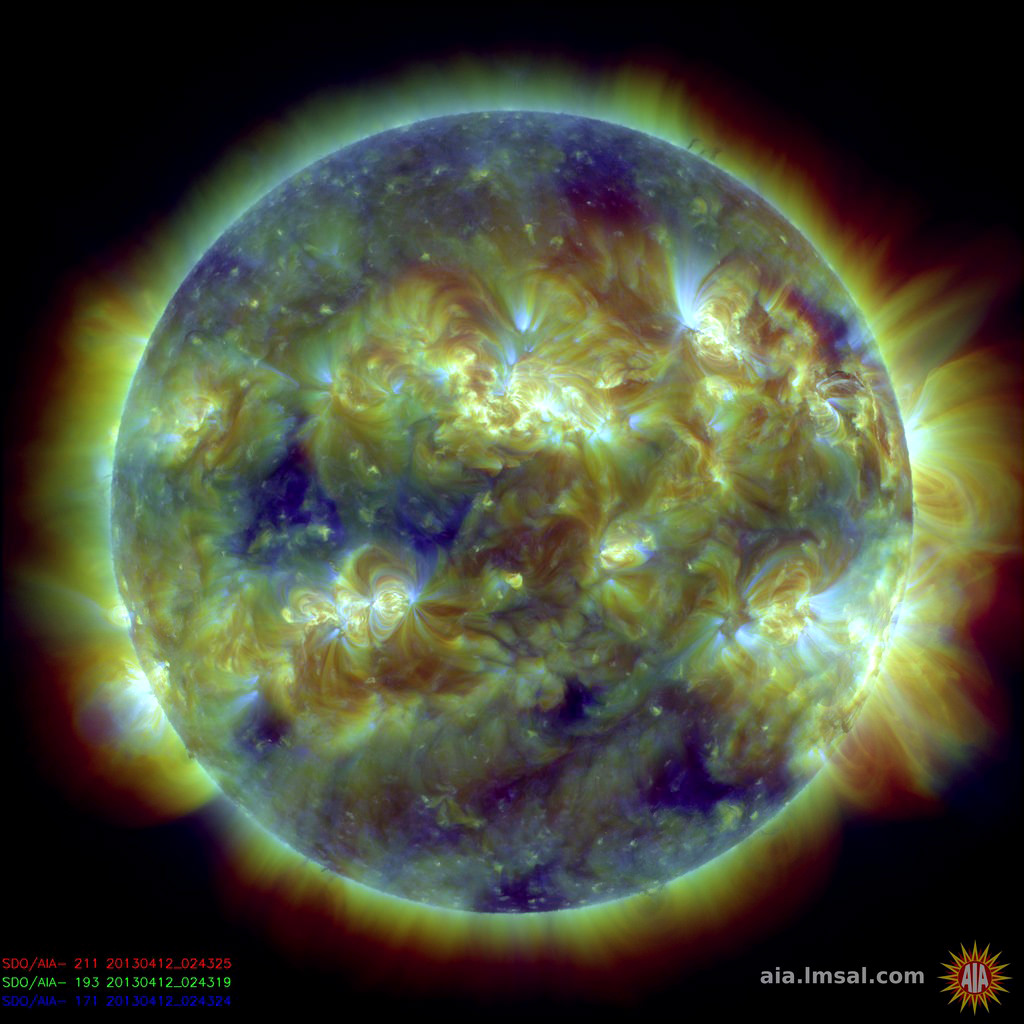
If that title seems like an obvious statement to you, it’s ok… it seems pretty obvious to me too. But there are those who have been suggesting — for quite some time, actually — that earthquakes can be triggered or strengthened by solar activity; that, in fact, exceptionally powerful solar flares, coronal mass ejections, and other outpourings from our home star can cause the planet’s crust to shift, shake, and shudder.
Except that that’s simply not true — at least, not according to a recent study by researchers from the USGS.
“Recently there’s been a lot of interest in this subject from the popular press, probably because of a couple of larger and very devastating earthquakes. This motivated us to investigate for ourselves whether or not it was true.”
– Jeffrey Love, USGS Research Geophysicist
Even when an earthquake may have been found to occur on the same day as increased solar activity, at other times during even stronger quakes the Sun may have been relatively quiet, and vice versa.
Damage in Anchorage from an earthquake on March 27, 1964. Solar activity at the time was unexceptional. (U.S. Army photo)
“There have been some earthquakes like the 9.5 magnitude Chile quake in 1960 where, sure enough, there were more sunspots and more geomagnetic activity than on average,” said Dr. Love. “But then for the Alaska earthquake in 1964 everything was lower than normal. There’s no obvious pattern between solar activity and seismicity, so our results were inconclusive.”
Basically, even though our planet orbits within the Sun’s outer atmosphere and we are subject to the space weather it creates — and there’s still a lot to be learned about that — observations do not indicate any connection between sunspots, flares, and CMEs and the shifting of our planet’s crust (regardless of what some may like to suggest.)
“It’s natural for scientists to want to see relationships between things,” said Love. “Of course, that doesn’t mean that a relationship actually exists!”
The team’s findings were published in the March 16, 2013 online edition of Geophysical Research Letters.
All the water on Earth would fit into a sphere 860 miles (1,385 km) wide. (Jack Cook/WHOI/USGS)
[/caption]
If you were to take all of the water on Earth — all of the fresh water, sea water, ground water, water vapor and water inside our bodies — take all of it and somehow collect it into a single, giant sphere of liquid, how big do you think it would be?
According to the U. S. Geological Survey, it would make a ball 860 miles (1,385 km) in diameter, about as wide edge-to-edge as the distance between Salt Lake City to Topeka, Kansas. That’s it. Take all the water on Earth and you’d have a blue sphere less than a third the size of the Moon.
Feeling a little thirsty?
And this takes into consideration all the Earth’s water… even the stuff humans can’t drink or directly access, like salt water, water vapor in the atmosphere and the water locked up in the ice caps. In fact, if you were to take into consideration only the fresh water on Earth (which is 2.5% of the total) you’d get a much smaller sphere… less than 100 miles (160 km) across.
Even though we think of reservoirs, lakes and rivers when we picture Earth’s fresh water supply, in reality most of it is beneath the surface — up to 2 million cubic miles (8.4 million cubic km) of Earth’s available fresh water is underground. But the vast majority of it — over 7 million cubic miles (29.2 cubic km) is in the ice sheets that cover Antarctica and Greenland.
Of course, the illustration above (made by Jack Cook at the Woods Hole Oceanographic Institution) belies the real size and mass of such a sphere of pure liquid water. The total amount of water contained within would still be quite impressive — over 332.5 million cubic miles (1,386 cubic km)! (A single cubic mile of water equals 1.1 trillion gallons.) Still, people tend to be surprised at the size of such a hypothetical sphere compared with our planet as a whole, especially when they’ve become used to the description of Earth as a “watery world”.
Makes one a little less apt to take it for granted.
Read more on the USGS site here, and check out some facts on reducing your water usage here.
Water, water, every where,
And all the boards did shrink;
Water, water, every where,
Nor any drop to drink.
– from The Rime of the Ancient Mariner, Samuel Taylor Coleridge