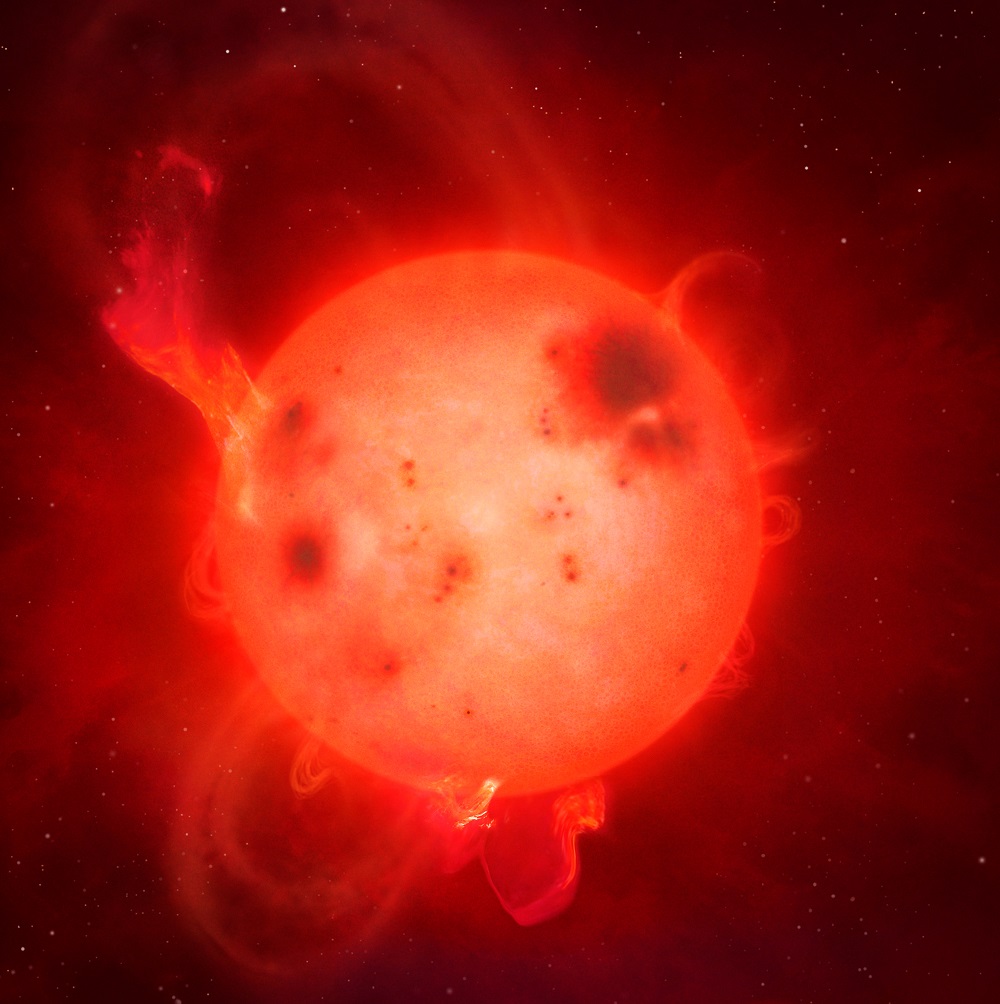
An artist's conception of a superflare event, on a dwarf star. Image credit: Mark Garlick/University of Warwick
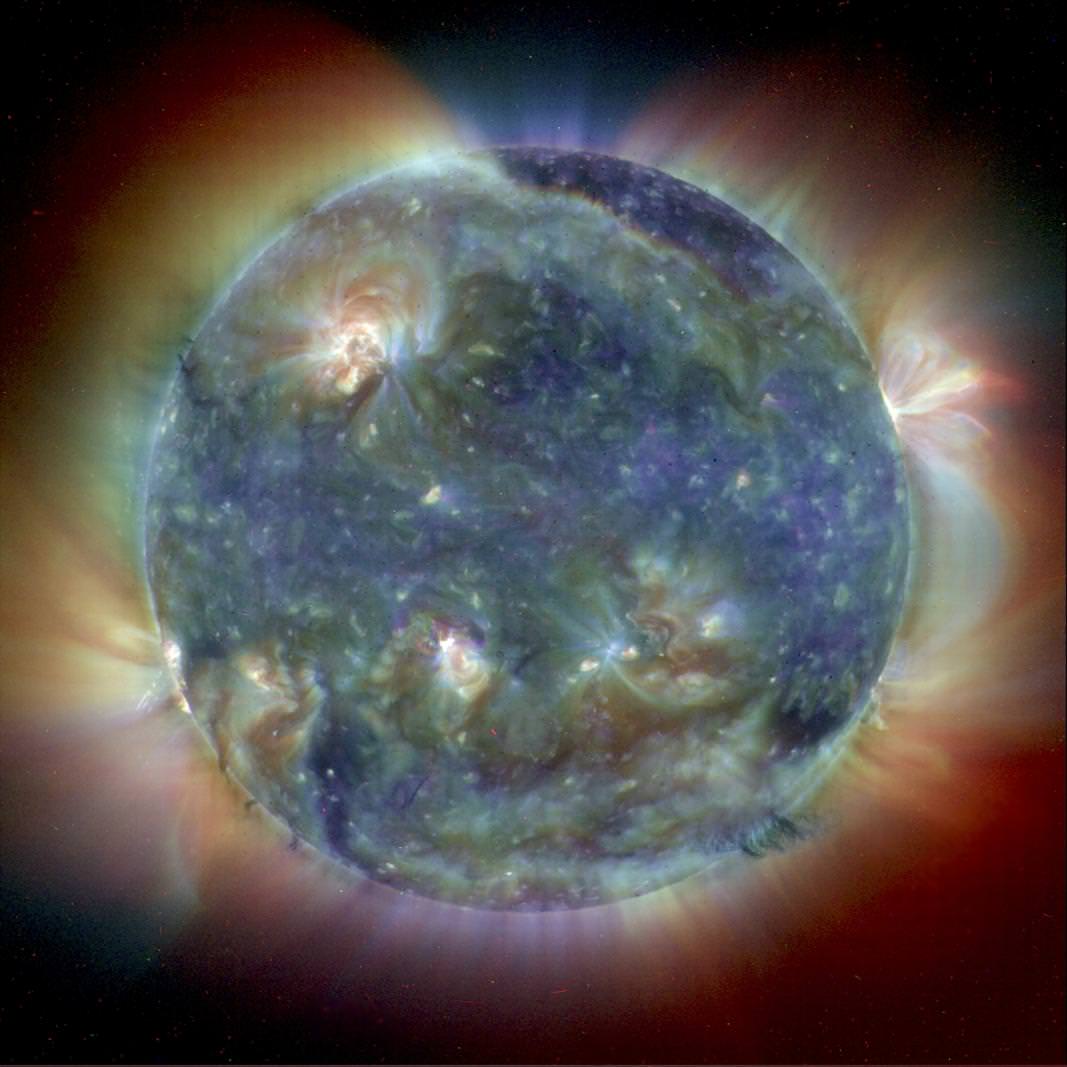
Star’s can be full of surprises; some of them nasty. While our own Sun appears pretty placid, science has shown us that’s not the case. Coronal mass ejections and solar flares are the Sun’s angry side.
And the Sun has only a mild case of the flares, compared to some other stars.
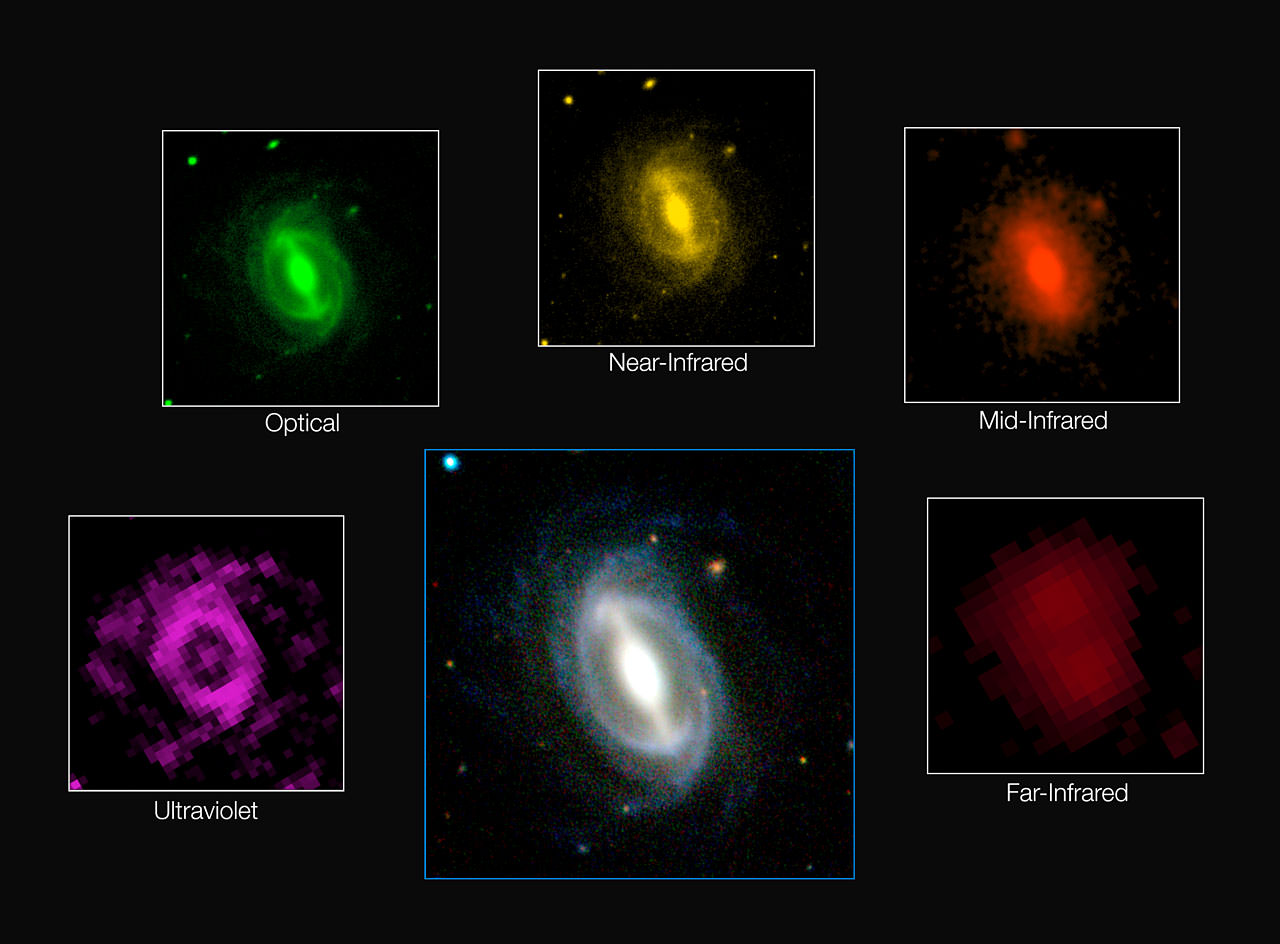
How a galaxy appears in different wavelengths of light. Based on the results of a recent study light from the nearby Universe is fading across all of these wavelengths. Credit: ICRAR/GAMA and ESO
Brace yourselves: winter is coming. And by winter I mean the slow heat-death of the Universe, and by brace yourselves I mean don’t get terribly concerned because the process will take a very, very, very long time. (But still, it’s coming.)
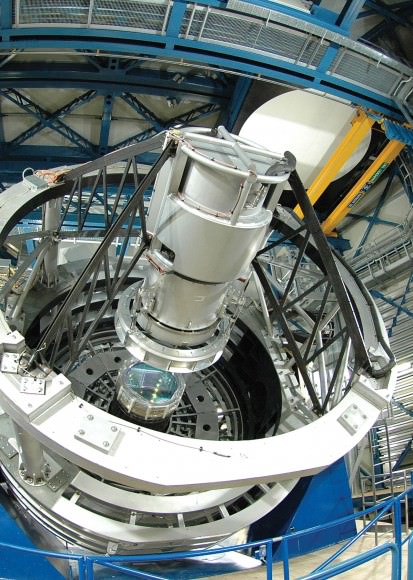
Part of ESO’s VISTA telescope in Chile, one of seven telescopes used in the GAMA survey (ESO)
Based on findings from the Galaxy and Mass Assembly (GAMA) project, which used seven of the world’s most powerful telescopes to observe the sky in a wide array of electromagnetic wavelengths, the energy output of the nearby Universe (currently estimated to be ~13.82 billion years old) is currently half of what it was “only” 2 billion years ago — and it’s still decreasing.
“The Universe has basically plonked itself down on the sofa, pulled up a blanket and is about to nod off for an eternal doze,” said Professor Simon Driver from the International Centre for Radio Astronomy Research (ICRAR) in Western Australia, head of the nearly 100-member international research team.
As part of the GAMA survey 200,000 galaxies were observed in 21 different wavelengths, from ultraviolet to far-infrared, from both the ground and in space. It’s the largest multi-wavelength galaxy survey ever made.
Of course this is something scientists have known about for decades but what the survey shows is that the reduction in output is occurring across a wide range of wavelengths. The cooling is, on the whole, epidemic.
Watch a video below showing a fly-through 3D simulation of the GAMA survey:
“Just as we become less active in our old age, the same is happening with the Universe, and it’s well past its prime,” says Dr. Luke Davies, a member of the ICRAR research team, in the video.
But, unlike living carbon-based bags of mostly water like us, the Universe won’t ever actually die. And for a long time still galaxies will evolve, stars and planets will form, and life – wherever it may be found – will go on. But around it all the trend will be an inevitable dissipation of energy.
“It will just grow old forever, slowly converting less and less mass into energy as billions of years pass by,” Davies says, “until eventually it will become a cold, dark, and desolate place where all of the lights go out.”
Our own Solar System will be a quite different place by then, the Sun having cast off its outer layers – roasting Earth and the inner planets in the process – and spending its permanent retirement cooling off as a white dwarf. What will remain of Earthly organisms by then, including us? Will we have spread throughout the galaxy, bringing our planet’s evolutionary heritage with us to thrive elsewhere? Or will our cradle also be our grave? That’s entirely up to us. But one thing is certain: the Universe isn’t waiting around for us to decide what to do.
The findings were presented by Professor Driver on Aug. 10, 2015, at the IAU XXIX General Assembly in Honolulu, and have been submitted for publication in the Monthly Notices of the Royal Astronomical Society.
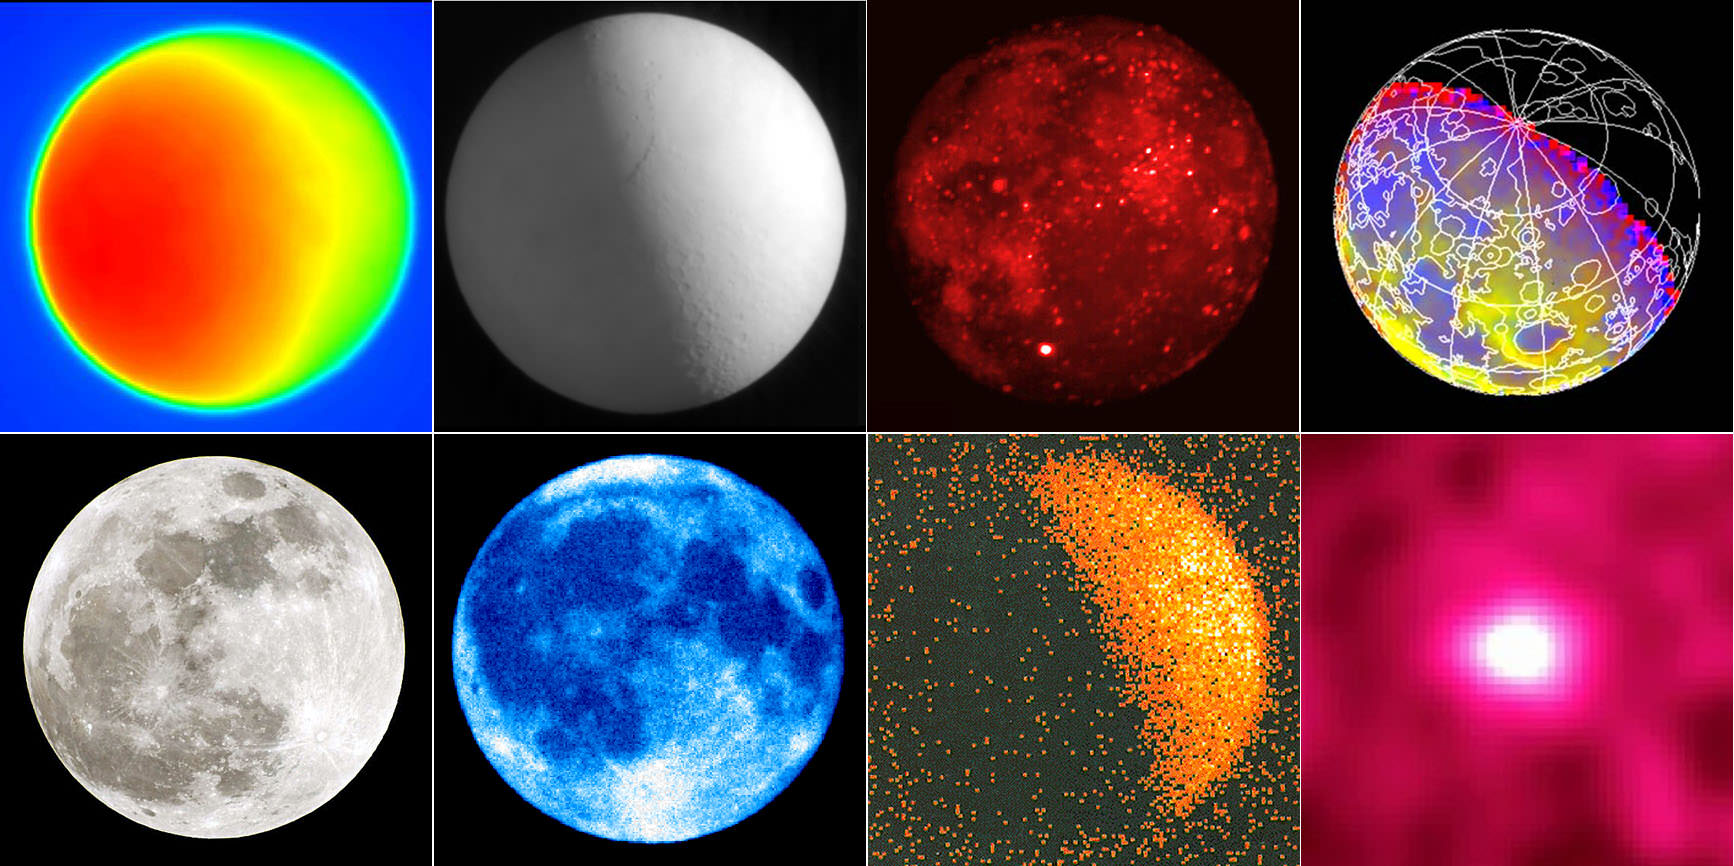
We see the Moon differently depending upon the wavelength in which we view it. Top row from left:
“By the Light of the Silvery Moon” goes the song. But the color and appearance of the Moon depends upon the particular set of eyes we use to see it. Human vision is restricted to a narrow slice of the electromagnetic spectrum called visible light.
With colors ranging from sumptuous violet to blazing red and everything in between, the diversity of the visible spectrum provides enough hues for any crayon color a child might imagine. But as expansive as the visual world’s palette is, it’s not nearly enough to please astronomers’ retinal appetites.
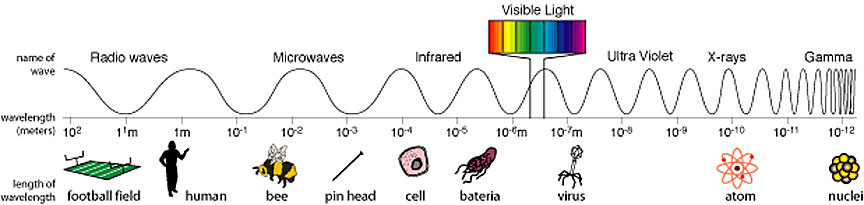
Visible light is a sliver of light’s full range of “colors” which span from kilometers-long, low-energy radio waves (left) to short wavelength, energetic gamma rays. It’s all light, with each color determined by wavelength. Familiar objects along the bottom reference light wave sizes. Visible light waves are about one-millionth of a meter wide. Credit: NASA
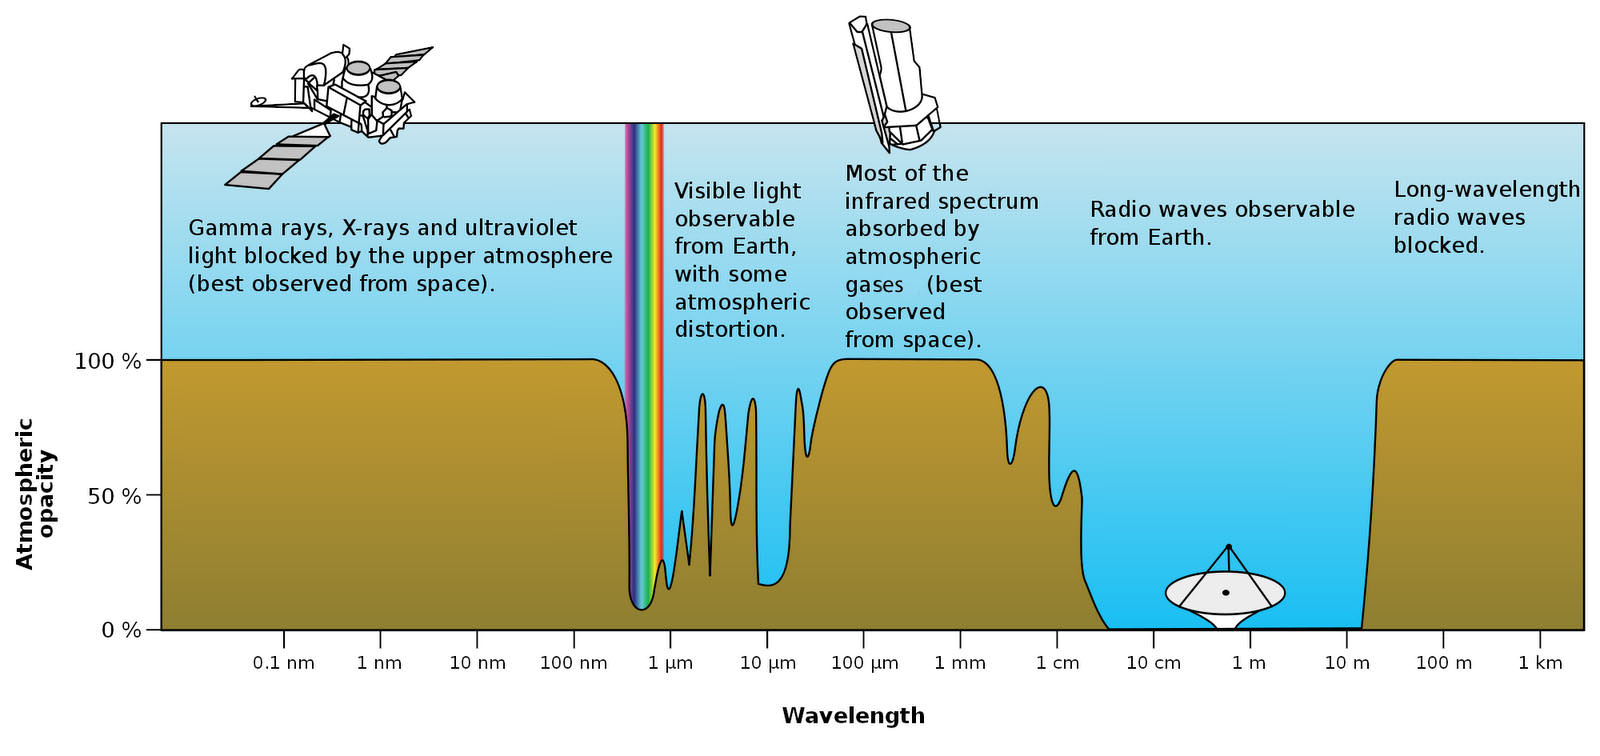
Since the discovery of infrared light by William Herschel in 1800 we’ve been unshuttering one electromagnetic window after another. We build telescopes, great parabolic dishes and other specialized instruments to extend the range of human sight. Not even the atmosphere gets in our way. It allows only visible light, a small amount of infrared and ultraviolet and selective slices of the radio spectrum to pass through to the ground. X-rays, gamma rays and much else is absorbed and completely invisible.
Earth’s atmosphere blocks a good portion of light’s diversity from reaching the ground, the reason we launch rockets and orbiting telescopes into space. Large professional telescopes are often built on mountain tops above much of the denser, lower atmosphere. This expands the viewing “window” into the infrared. Credit: NASA
To peer into these rarified realms, we’ve lofting air balloons and then rockets and telescopes into orbit or simply dreamed up the appropriate instrument to detect them. Karl Jansky’s homebuilt radio telescope cupped the first radio waves from the Milky Way in the early 1930s; by the 1940s sounding rockets shot to the edge of space detected the high-frequency sizzle of X-rays. Each color of light, even the invisible “colors”, show us a new face on a familiar astronomical object or reveal things otherwise invisible to our eyes.
So what new things can we learn about the Moon with our contemporary color vision?
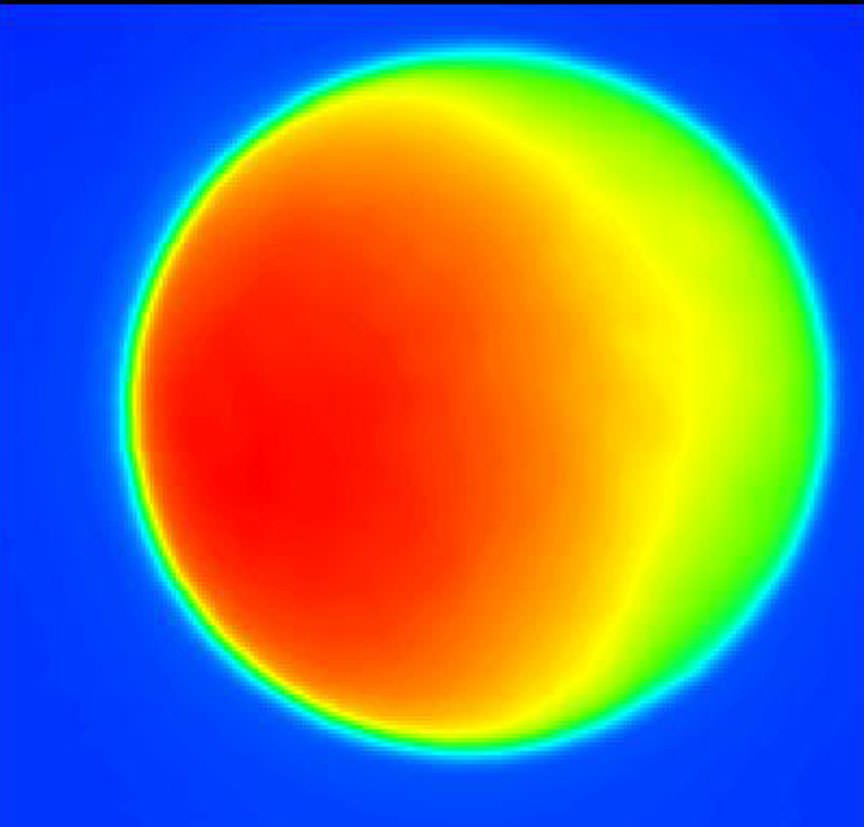
Radio Moon
Radio: Made using NRAO’s 140-ft telescope in Green Bank, West Virginia. Blues and greens represent colder areas of the moon and reds are warmer regions. The left half of Moon was facing the Sun at the time of the observation. The sunlit Moon appear brighter than the shadowed portion because it radiates more heat (infrared light) and radio waves.
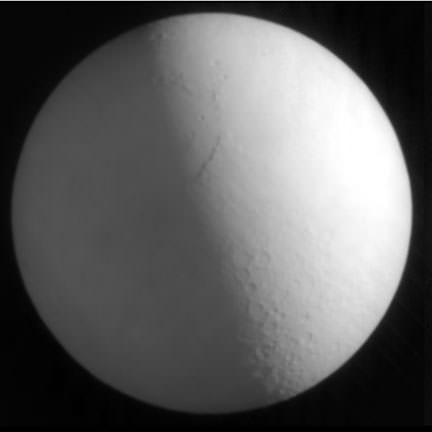
Submillimeter Moon
Submillimeter: Taken using the SCUBA camera on the James Clerk Maxwell Telescope in Hawaii. Submillimeter radiation lies between far infrared and microwaves. The Moon appears brighter on one side because it’s being heated by Sun in that direction. The glow comes from submillimeter light radiated by the Moon itself. No matter the phase in visual light, both the submillimeter and radio images always appear full because the Moon radiates at least some light at these wavelengths whether the Sun strikes it or not.
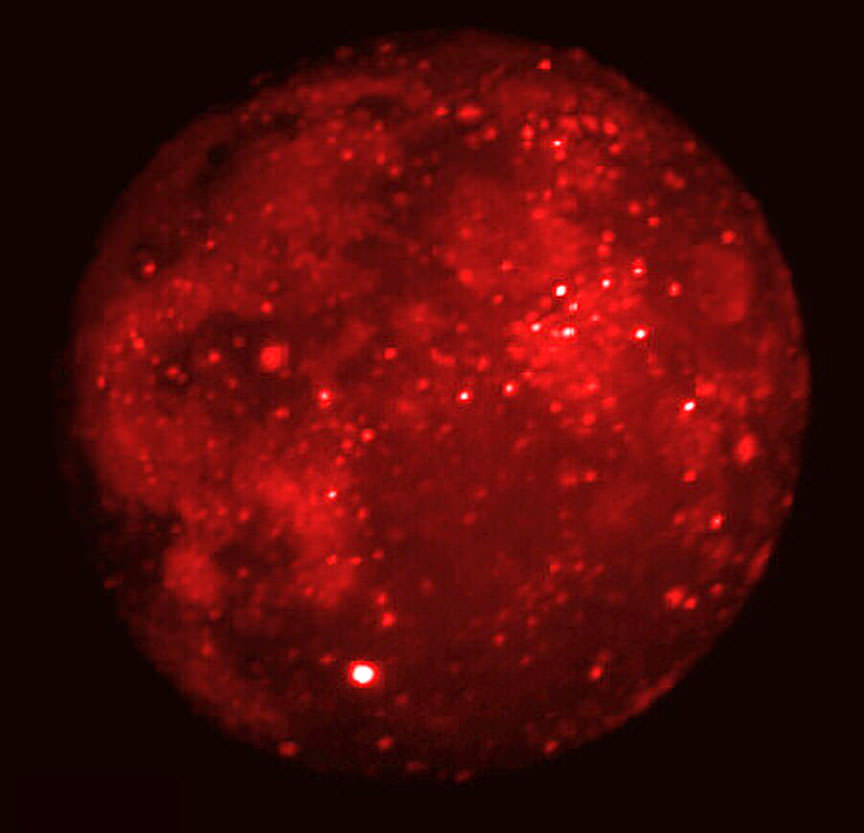
Mid-infrared Moon
Mid-infrared: This image of the Full Moon was taken by the Spirit-III instrument on the Midcourse Space Experiment (MSX) at totality during a 1996 lunar eclipse. Once again, we see the Moon emitting light with the brightest areas the warmest and coolest regions darkest. Many craters look like bright dots speckling the lunar disk, but the most prominent is brilliant Tycho near the bottom. Research shows that young, rock-rich surfaces, such as recent impact craters, should heat up and glow more brightly in infrared than older, dust-covered regions and craters. Tycho is one of the Moon’s youngest craters with an age of just 109 million years.
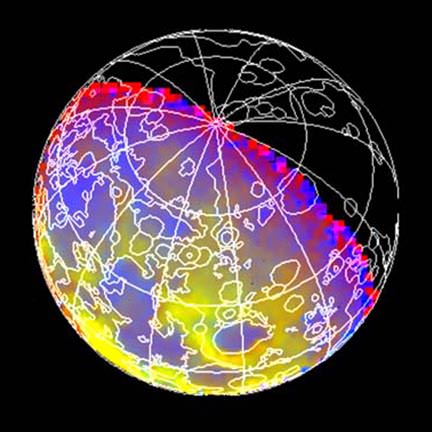
Near-infrared Moon
Near-infrared: This color-coded picture was snapped just beyond the visible deep red by NASA’s Galileo spacecraft during its 1992 Earth-Moon flyby en route to Jupiter. It shows absorptions due to different minerals in the Moon’s crust. Blue areas indicate areas richer in iron-bearing silicate materials that contain the minerals pyroxene and olivine. Yellow indicates less absorption due to different mineral mixes.
Visible light Moon
Visible light: Unlike the other wavelengths we’ve explored so far, we see the Moon not by the light it radiates but by the light it reflects from the Sun.
The iron-rich composition of the lavas that formed the lunar “seas” give them a darker color compared to the ancient lunar highlands, which are composed mostly of a lighter volcanic rock called anorthosite.
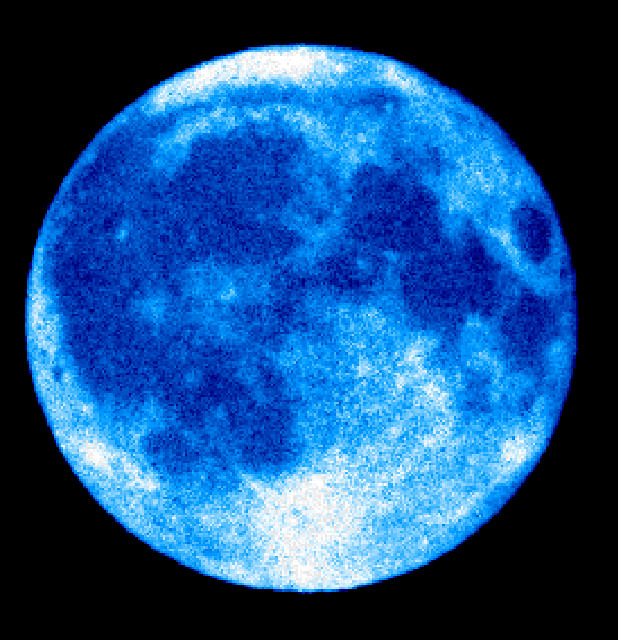
UV Moon
Ultraviolet: Similar to the view in visible light but with a lower resolution. The brightest areas probably correspond to regions where the most recent resurfacing due to impacts has occurred. Once again, the bright rayed crater Tycho stands out in this regard. The photo was made with the Ultraviolet Imaging Telescope flown aboard the Space Shuttle Endeavour in March 1995.
X-ray Moon
X-ray: The Moon, being a relatively peaceful and inactive celestial body, emits very little x-ray light, a form of radiation normally associated with highly energetic and explosive phenomena like black holes. This image was made by the orbiting ROSAT Observatory on June 29, 1990 and shows a bright hemisphere lit by oxygen, magnesium, aluminum and silicon atoms fluorescing in x-rays emitted by the Sun. The speckled sky records the “noise” of distant background X-ray sources, while the dark half of the Moon has a hint of illumination from Earth’s outermost atmosphere or geocorona that envelops the ROSAT observatory.
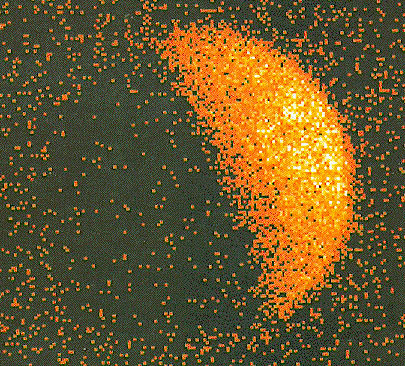
Gamma ray Moon
Gamma rays: Perhaps the most amazing image of all. If you could see the sky in gamma rays the Moon would be far brighter than the Sun as this dazzling image attempts to show. It was taken by the Energetic Gamma Ray Experiment Telescope (EGRET). High-energy particles (mostly protons) from deep space called cosmic rays constantly bombard the Moon’s surface, stimulating the atoms in its crust to emit gamma rays. These create a unique high-energy form of “moonglow”.
Astronomy in the 21st century is like having a complete piano keyboard on which to play compared to barely an octave a century ago. The Moon is more fascinating than ever for it.
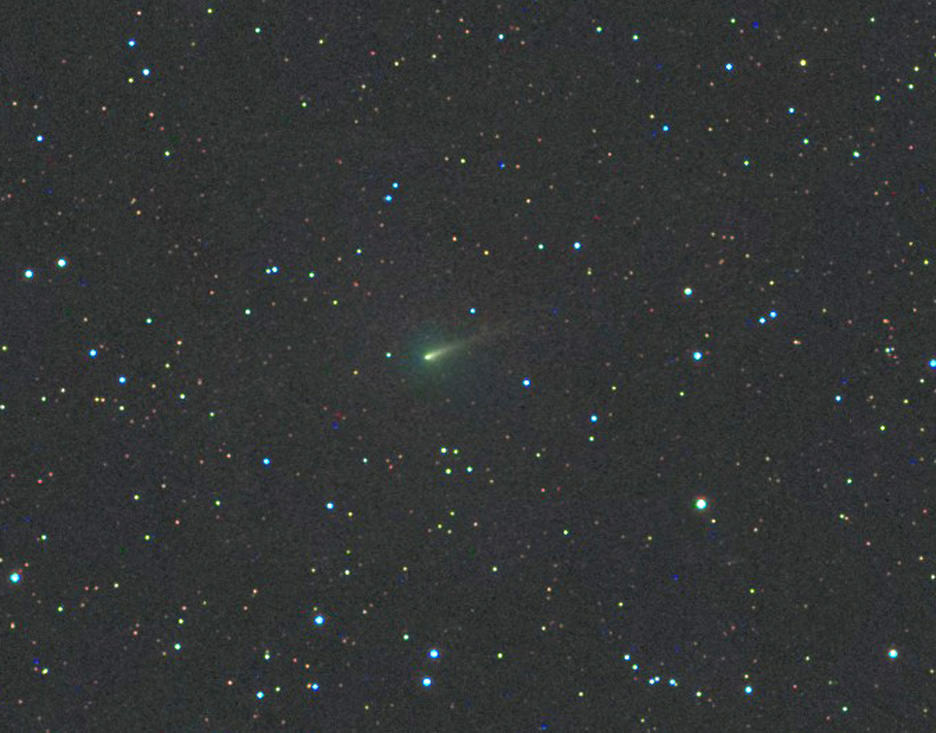
Comet ISON, photographed with a 3-inch (80mm) telescope on this morning Sept. 28 shows a circular green coma and short dust tail pointing northwest. Click to enlarge. Credit: Michael Jaeger
As NASA and the European Space Agency prepare their remote photojournalists – Mars Express, Mars Reconnaissance Orbiter and the Curiosity and Opportunity rovers – to capture photos of Comet ISON’s flyby of Mars early next week, amateur astronomers continue to monitor and photograph the comet from backyard observatories across the blue Earth. Several recent color photos show ISON’s bright head or nucleus at the center of a puffy, green coma. Green’s a good omen – a sign the comet’s getting more active as it enters the realm of the inner solar system and sun’s embrace.
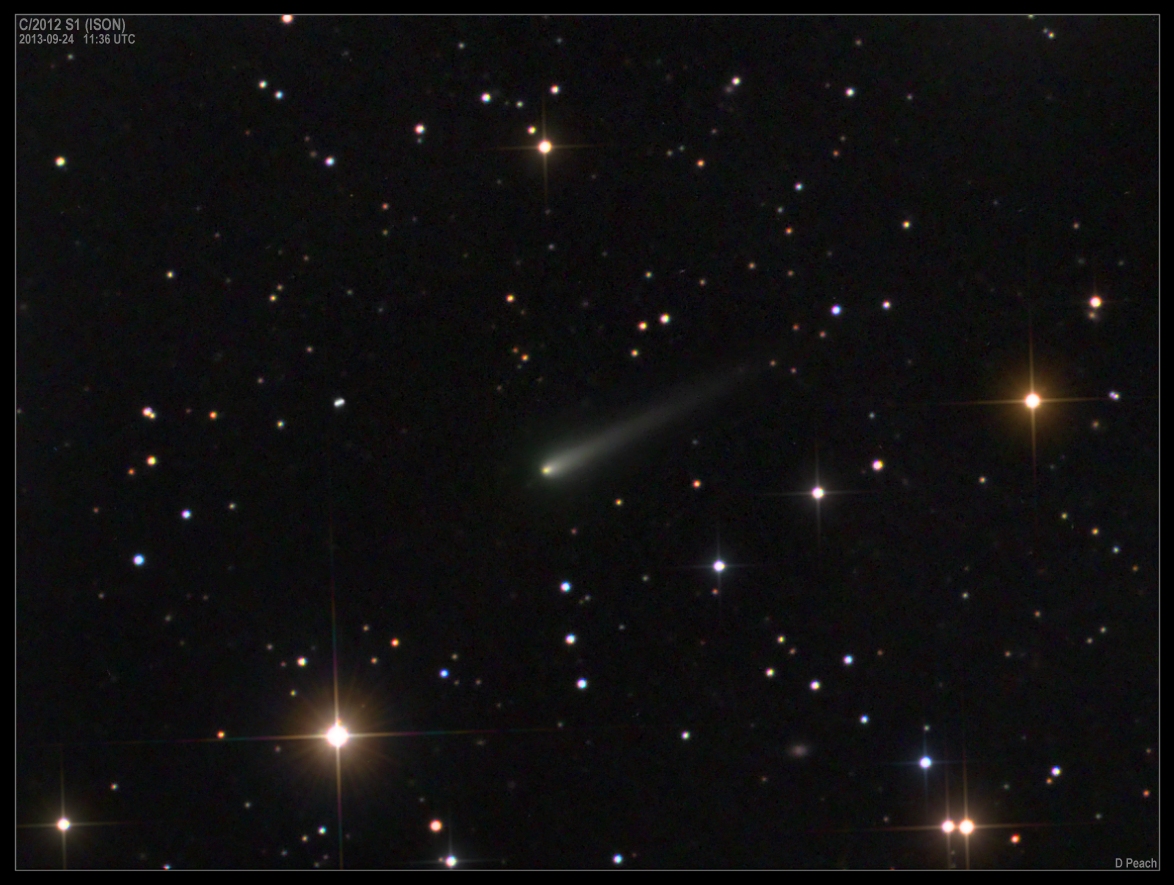
Another great photo of the “greening” of Comet ISON taken on Sept. 24 with a 17-inch (43-cm) telescope. Click to enlarge. Credit: Damian Peach
Sunlight beating down on the comet’s nucleus (core) vaporizes dust-impregnated ice to form a cloud or coma, a temporary atmosphere of water vapor, dust, carbon dioxide, ammonia and other gases. Once liberated , the tenuous haze of comet stuff rapidly expands into a huge spherical cloud centered on the nucleus. Comas are typically hundreds of thousands of miles across but are so rarified you could wave your hand through one and not feel a thing. The Great Comet of 1811 sported one some 864,000 miles (1.4 million km) across, nearly the same diameter as the sun!
Among the materials released by solar heating are cyanogenand diatomic carbon. Both are colorless gases that fluoresce a delicious candy-apple green when excited by energetic ultraviolet light in sunlight.
Sounds like a plan. Newspaper clipping from 1910.
Cyanogen smells pleasantly of almonds, but it’s a poisonous gas composed of one atom each of carbon and nitrogen. Diatomic carbon or C2 is equally unpleasant. It’s a strong, corrosive acid found not only in comets but also created as a vapor in high-energy electric arcs. But nature has a way of taking the most unlikely things and fashioning them into something beautiful. If you’re concerned about the effects of cometary gas and dust on people, rest easy. They’re spread too thinly to touch us here on Earth. That didn’t stop swindlers from selling “comet pills” and gas masks to protect the public from poisoning during the 1910 return of Halley’s Comet. Earth passed through the tail for six hours on May 19 that year. Amazingly, those who took the pills survived … as did everyone else.
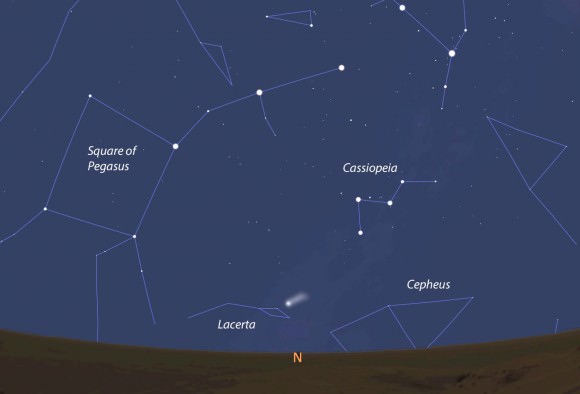
Comet ISON’s location and approximate appearance on October 1 seen from the Curiosity Rover. ISON will pass only 6.7 million miles (10.8 million km) from Mars on Tuesday Oct. 1. Stellarium
While Comet ISON is still too faint for visual observers to discern its Caribbean glow, that will change as it beelines for the sun and brightens. If you could somehow wish yourself to Mars in the next few days, I suspect you’d easily see the green coma through a telescope. The comet – a naked eye object at magnitude 2.5-3 – glows low in the northern sky from the Curiosity rover’s vantage point 4.5 degrees south of the Martian equator.
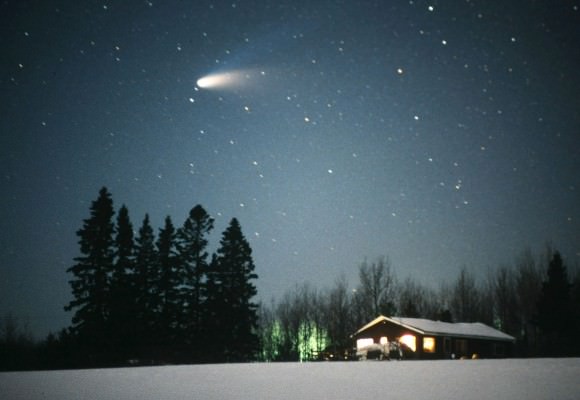
Comet Hale-Bopp shows off its bright dust tail and fainter, blue ion tail in early spring 1997. Credit: Bob King
I’ve noticed that when a comet reaches about 7th magnitude, the green coloration becomes apparent in 8-inch (20 cm) and larger telescopes. Bright naked eye comets often display multiple subtle colors that change chameleon-like over time. Dust tails, formed when sunlight pushes dust particles downwind from the coma, glow pale yellow. Gusty solar winds sweep back molecules from the coma into a second “ion” tail that glows pale blue from jazzed up carbon monoxide ions fluorescing in solar UV.
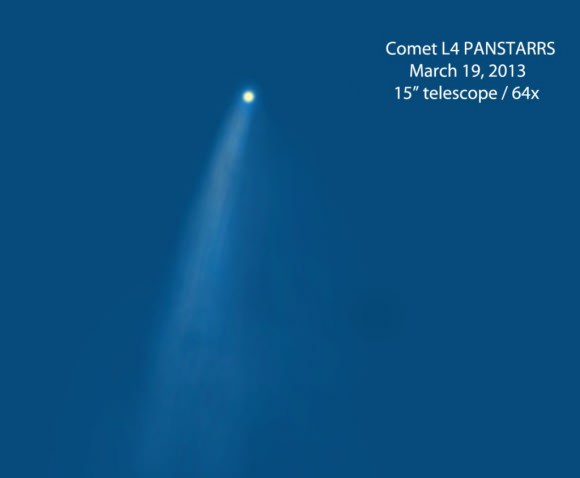
One of the highlights of seeing Comet L4 PANSTARRS through a small telescope was its brilliant, pea-like false nucleus glowing yellow from sunlit dust. The real comet nucleus – the actual comet – lies within the false nucleus and hidden by dust. Drawing: Bob King
During close encounters with the sun, millions of pounds of dust per day boil off a comet’s nucleus, forming a small, intensely bright, yellow-orange disk in the center of the coma called a false nucleus. Earlier this year, when Comet C/2011 L4 PANSTARRS emerged into the evening sky after perihelion, not only was its yellow tail apparent to binocular users but the brilliant false nucleus glowed a lovely shade of lemon in small telescopes.
With ISON diving much closer to the sun than L4 PANSTARRS, expect a full color palette in the coming weeks. While it may not be easy being green for Sesame Street’s Kermit the Frog, comets do it with aplomb.
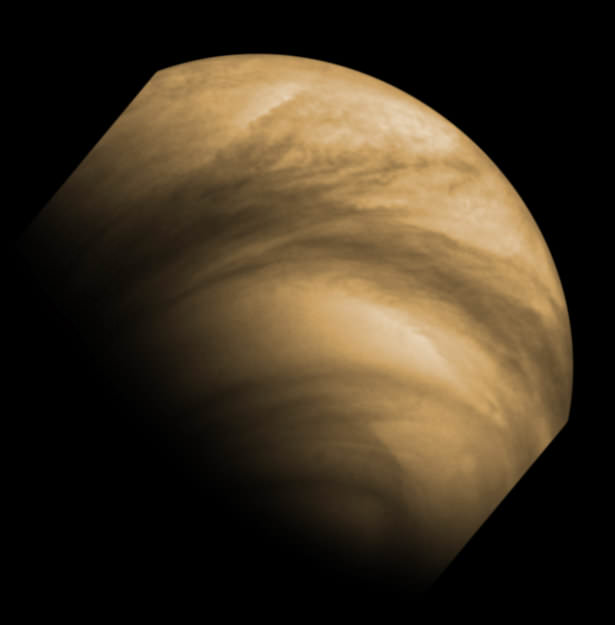
If you’ve ever wanted to see what it’s like to buzz Venus like only a spacecraft can, here’s your chance: this is a video animation of images taken by ESA’s Venus Express as it makes a pole-to-pole orbit of our neighboring world.
Captured in ultraviolet wavelengths, the images were acquired by the spacecraft’s Venus Monitoring Camera last January over a period of 18 hours. It’s truly a “day in the life” of Venus Express!
From ESA’s description of the video:
We join the spacecraft from a staggering 66,000 km above the south pole, staring down into the swirling south polar vortex. From this bird’s-eye view, half of the planet is in darkness, the ‘terminator’ marking the dividing line between the day and night sides of the planet.
Intricate features on smaller and smaller scales are revealed as Venus Express dives to just 250 km above the north pole and clouds flood the field of view, before regaining a global perspective as it climbs away from the north pole.
The observed pattern of bright and dark markings is caused by variations in an unknown absorbing chemical at the Venus cloud tops.
False-color image of cloud features on Venus. Captured by Venus Express from a distance of 30,000 km (18,640 miles) on December 8, 2011. (ESA/MPS/DLR/IDA)
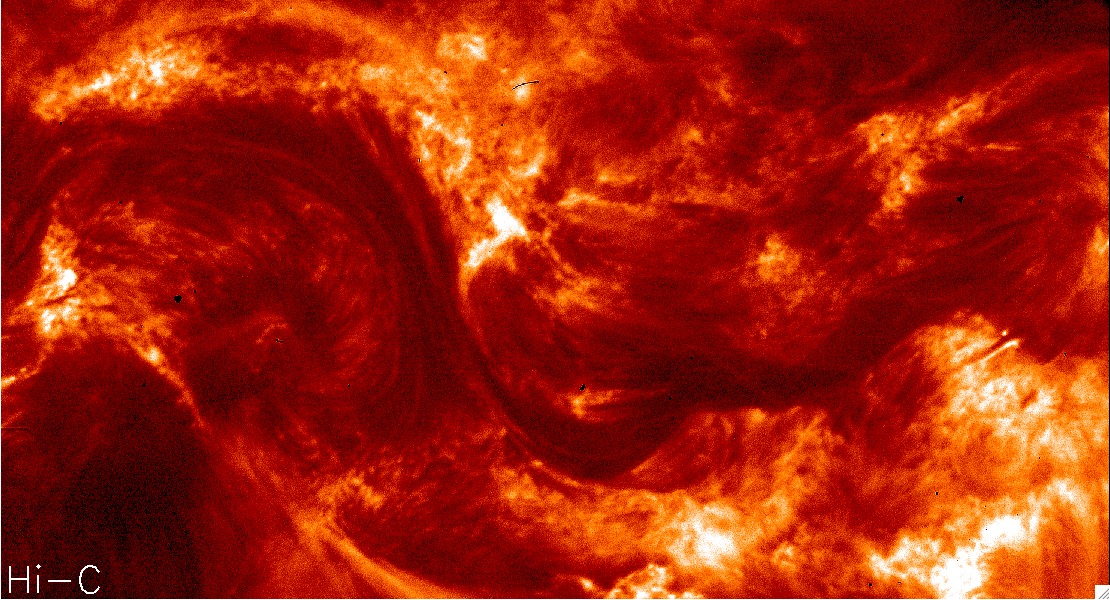
NASA’s High Resolution Coronal Imager (Hi-C) mission, launched Wednesday, July 11 from White Sands Missile Range in New Mexico, successfully returned (as promised!) the highest-resolution images of the Sun’s corona ever acquired. These images of the dynamic million-degree region of the Sun’s atmosphere will provide scientists with more information on the complex activity found near the Sun’s surface and how it affects space weather throughout the Solar System.
Launched aboard a 58-foot-tall (17 meter) Black Brant sounding rocket, Hi-C was equipped with exceptionally well-made mirrors — some of the finest ever made, according to the mission report. These mirrors allowed Hi-C to image a section of the Sun’s corona in extreme ultraviolet light with a resolution of 0.1 arcsec/pixel, distinguishing features as small as 135 miles (217 km) across. That’s five times the resolution of SDO images, or any previous space telescope for that matter.
That’s like the difference between watching a program on a tube television and an HD flatscreen monitor.
The image below shows the same region as seen by SDO’s AIA array and Hi-C’s innovative mirror-and-“light-maze” system:
“These revolutionary images of the sun demonstrate the key aspects of NASA’s sounding rocket program, namely the training of the next generation of principal investigators, the development of new space technologies, and scientific advancements,” said Barbara Giles, director for NASA’s Heliophysics Division at NASA Headquarters in Washington.
During its 620-second suborbital flight, Hi-C took 165 images of a section of the Sun’s corona 135,000 miles (271,000 km) across, capturing wavelengths of light at 193 Angstroms emitted by the Sun’s super-hot 1.5 million kelvin corona. The images were focused on a large sunspot region, whose position was accurately predicted 27 days prior to launch.
“We have an exceptional instrument and launched at the right time,” said Jonathan Cirtain, senior heliophysicist at NASA’s Marshall Space Flight Center in Huntsville. “Because of the intense solar activity we’re seeing right now, we were able to clearly focus on a sizeable, active sunspot and achieve our imaging goals.”
Even though Hi-C’s flight only lasted ten minutes, of which 330 seconds were used for acquiring images, the amount of data gathered will be used by researchers for months.
“Even though this mission was only a few minutes long, it marks a big breakthrough in coronal studies,” said Leon Golub, lead investigator from the Harvard-Smithsonian Center for Astrophysics. “The Hi-C flight might be the most productive five minutes I’ve ever spent.”
Watch a 10-second video of the region shown above, seen from both Hi-C and SDO:
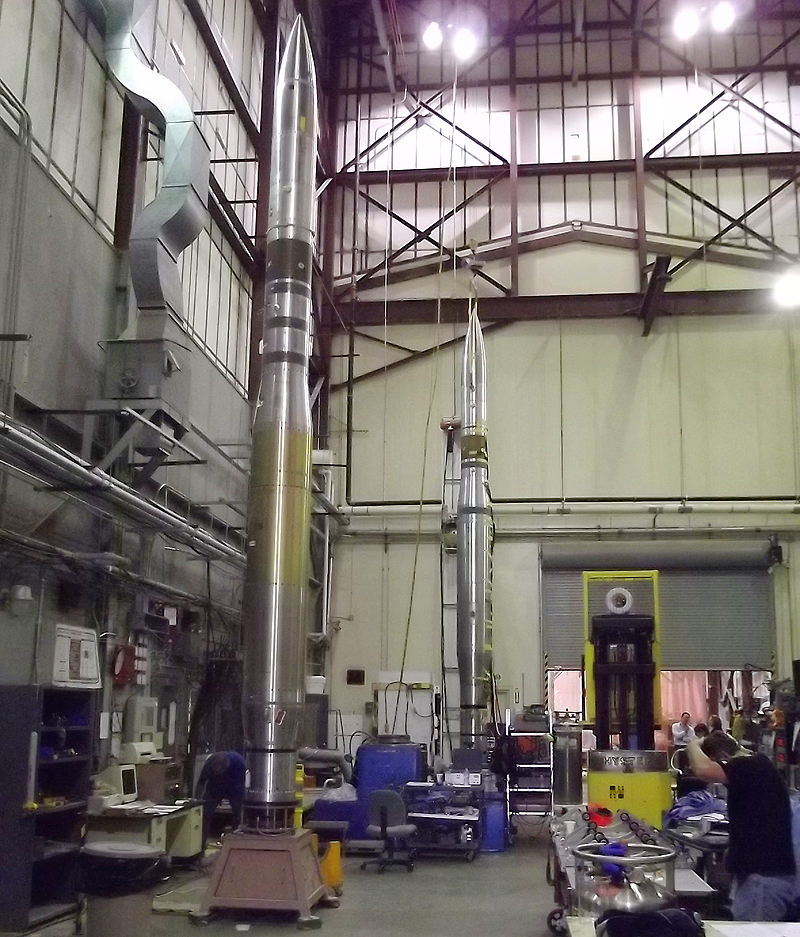
This Wednesday NASA will launch its High Resolution Coronal Imager (HI-C) mission from White Sands Missile Range in New Mexico, sending a sounding rocket above the atmosphere with some of the best mirrors ever made to capture incredibly-detailed ultraviolet images of our Sun.
HI-C will use a state-of-the-art imaging system to focus on a region near the center of the Sun about 135,000 miles (271,000 km) across. During its brief flight — only ten minutes long — HI-C will return some of the most detailed images of the Sun’s corona ever acquired, with a resolution five times that of previous telescopes… including NASA’s Solar Dynamics Observatory.
While SDO collects images in ten wavelengths, however, HI-C will focus on just one: 193 Angstroms, a wavelength of ultraviolet radiation that best reveals the structures of the Sun’s corona present in temperatures of 1.5 million kelvin. And although HI-C’s mirrors aren’t any larger than SDO’s — about 9.5 inches in diameter — they are “some of the finest ever made.” In addition, an interior “maze” between mirrors effectively increases HI-C’s focal length.
Researchers expect HI-C’s super-smooth mirrors to resolve coronal structures as small as 100 miles (160 km) across (0.1 arcsec/pixel).
“Other instruments in space can’t resolve things that small, but they do suggest – after detailed computer analysis of the amount of light in any given pixel – that structures in the sun’s atmosphere are about 100 miles across,” said Jonathan Cirtain, project scientist for HI-C at NASA’s Marshall Space Flight Center. “And we also have theories about the shapes of structures in the atmosphere, or corona, that expect that size. HI-C will be the first chance we have to see them.”
One of the main goals of HI-C will be to place significant new constraints on theories of coronal heating and structuring, by observing the small-scale processes that exist everywhere in hot magnetized coronal plasma and establishing whether or not there are additional structures below what can currently be seen.
“This instrument could push the limits on theories of coronal heating, answering questions such as why the temperature of the sun’s corona is millions of degrees higher than that of the surface,” said Marshall’s Dr. Jonathan Cirtain, heliophysicist and principle investigator on the mission.
Top image: A Black Brant sounding rocket containing NASA’s HI-C mission will launch on July 11, 2012 to observe the sun’s corona. (NASA) Bottom image: TRACE image of the Sun at a resolution of 0.5 arcsec/pixel. HI-C will have a resolution 5 times finer.
NASA’s Solar Dynamics Observatory captured this video on March 27 – 28 of two large areas of “dark” plasma on the Sun’s limb, twisting and spiraling in our star’s complex magnetic field. The southern region bears an uncanny resemblance to three figures swaying to some spooky, unheard music… a real “danse macabre” on the Sun!
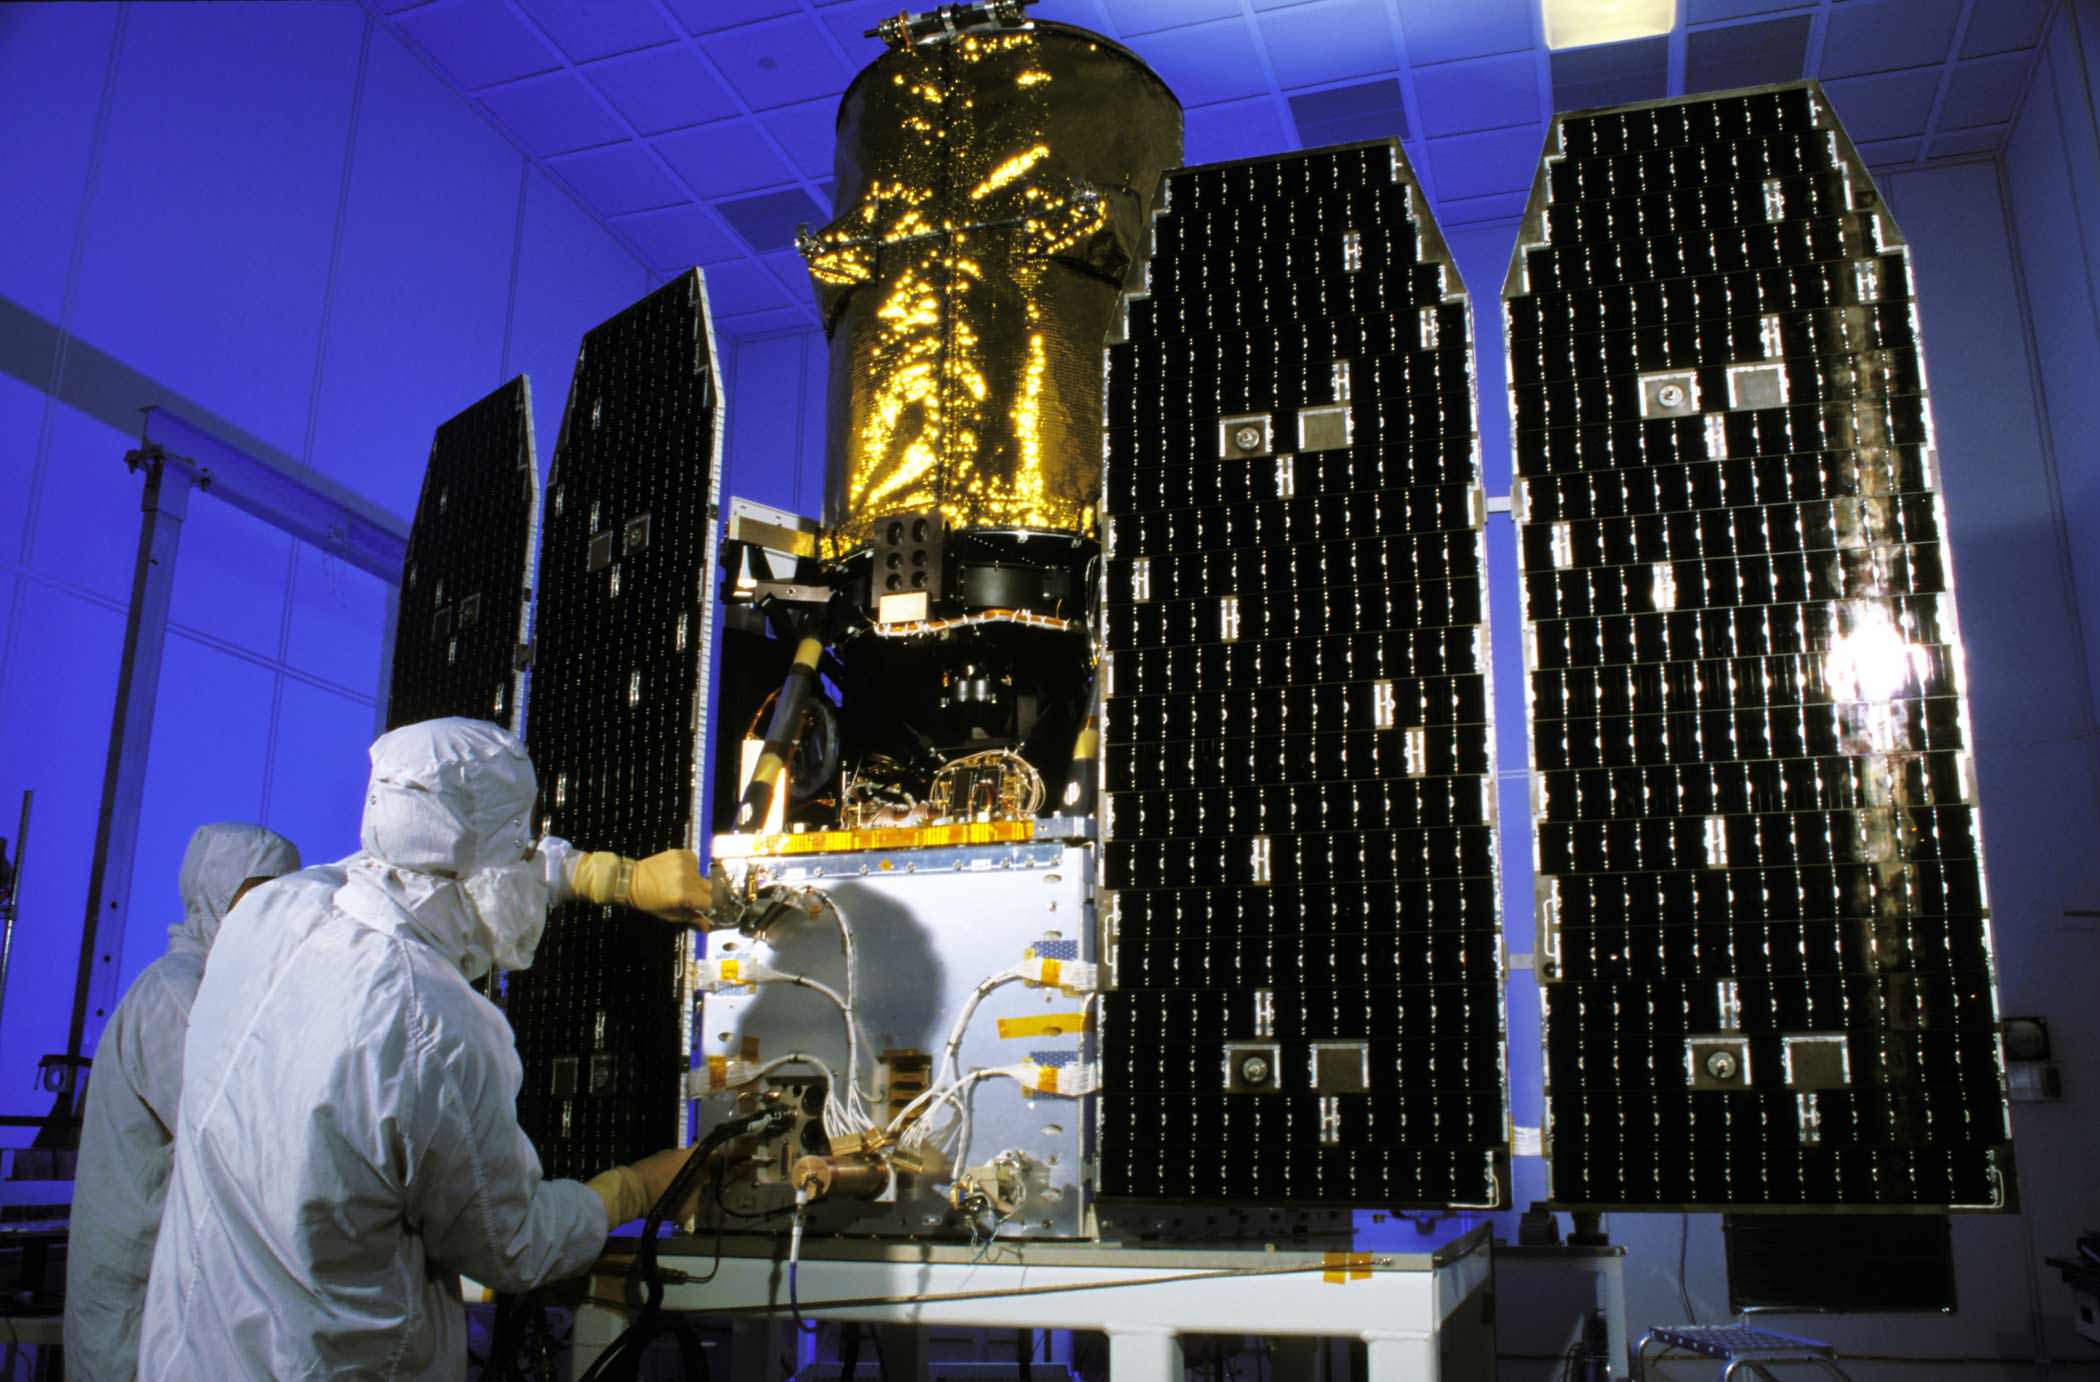
The GALEX spacecraft before its launch in 2003. Credit: JPL
[/caption]
A mission which helped map the ultraviolet sky and worked to confirm the nature of dark energy is coming to an end. Galaxy Evolution Explorer, or GALEX, was placed in standby mode today after nearly nine years of service and will be decommissioned later this year. With data from the mission, scientists were able to catalog millions of galaxies spanning 10 billion years of cosmic time.
The Galaxy Evolution Explorer launched in April of 2003 on board a Pegasus XL rocket. It completed its prime mission in the fall of 2007, but the mission was extended to continue its census of stars and galaxies. The variable star Mira. Image credit: Galex
Other mission highlights include the discovery of a gigantic comet-like tail behind a speeding star, finding rings of new stars around old galaxies, exploring “teenager” galaxies, which help to explain how galaxies evolve, and catching a black hole devouring a star.
The mission was part of NASA’s Explorer’s program and was built and managed by the Jet Propulsion Laboratory. Scientists from around the world participated in GALEX studies.
[/caption]Radiation from the Sun, which is more popularly known as sunlight, is a mixture of electromagnetic waves ranging from infrared (IR) to ultraviolet rays (UV). It of course includes visible light, which is in between IR and UV in the electromagnetic spectrum.
All electromagnetic waves (EM) travel at a speed of approximately 3.0 x 10 8 m/s in vacuum. Although space is not a perfect vacuum, as it is really composed of low-density particles, EM waves, neutrinos, and magnetic fields, it can certainly be approximated as such.
Now, since the average distance between the Earth and the Sun over one Earth orbit is one AU (about 150,000,000,000 m), then it will take about 8 minutes for radiation from the Sun to get to Earth.
Actually, the Sun does not only produce IR, visible light, and UV. Fusion in the core actually gives off high energy gamma rays. However, as the gamma ray photons make their arduous journey to the surface of the Sun, they are continuously absorbed by the solar plasma and re-emitted to lower frequencies. By the time they get to the surface, their frequencies are mostly only within the IR/visible light/UV spectrum.
During solar flares, the Sun also emits X-rays. X-ray radiation from the Sun was first observed by T. Burnight during a V-2 rocket flight. This was later confirmed by Japan’s Yohkoh, a satellite launched in 1991.
When electromagnetic radiation from the Sun strikes the Earth’s atmosphere, some of it is absorbed while the rest proceed to the Earth’s surface. In particular, UV is absorbed by the ozone layer and re-emitted as heat, eventually heating up the stratosphere. Some of this heat is re-radiated to outer space while some is sent to the Earth’s surface.
In the meantime, the electromagnetic radiation that wasn’t absorbed by the atmosphere proceeds to the Earth’s surface and heats it up. Some of this heat stays there while the rest is re-emitted. Upon reaching the atmosphere, part of it gets absorbed and part of it passes through. Naturally, the ones that get absorbed add to the heat already there.
The presence of greenhouse gases make the atmosphere absorb more heat, reducing the fraction of outbound EM waves that pass through. Known as the greenhouse effect, this is the reason why heat can build up some more.
Here’s a simplified explanation of the greenhouse effect on the EPA’s website. There’s also NASA’s Climate Change page.
Relax and listen to some interesting episodes at Astronomy Cast. Want to know more aboutUltraviolet Astronomy? How different is it from Optical Astronomy?