In the past few decades, the number of planets discovered beyond our Solar System has grown exponentially. To date, a total of 4,158 exoplanets have been confirmed in 3,081 systems, with an additional 5,144 candidates awaiting confirmation. Thanks to the abundance of discoveries, astronomers have been transitioning in recent years from the process of discovery to the process of characterization.
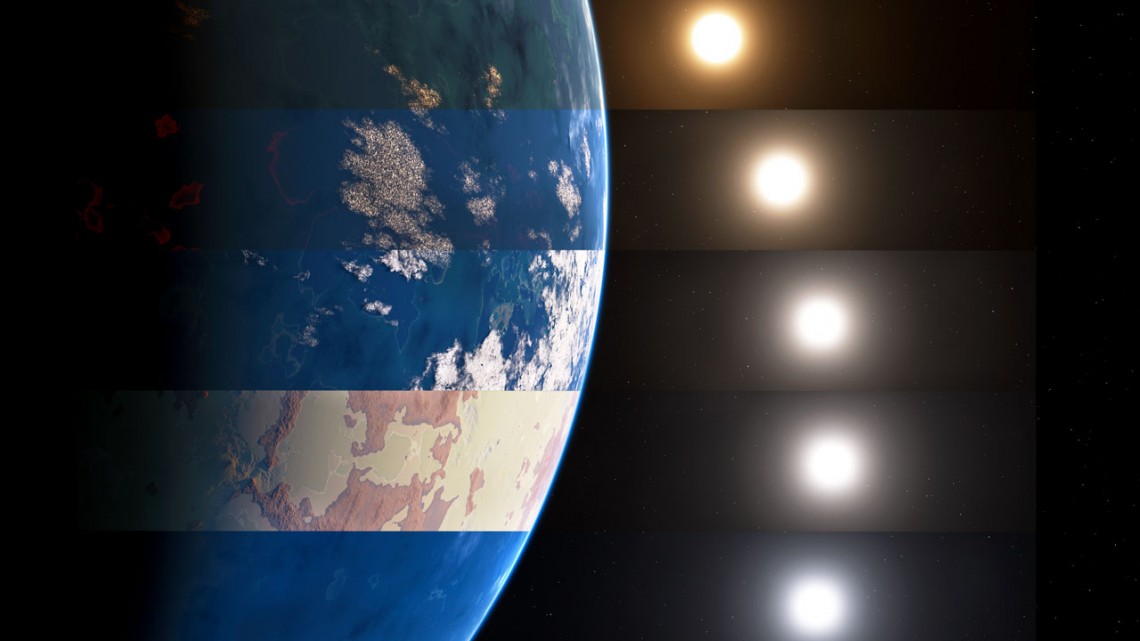
In particular, astronomers are developing tools to assess which of these planets could harbor life. Recently, a team of astronomers from the Carl Sagan Institute (CSI) at Cornell University designed an environmental “decoder” based on the color of exoplanet surfaces and their hosts stars. In the future, this tool could be used by astronomers to determine which exoplanets are potentially-habitable and worthy of follow-up studies.
Artist's impression of a white dwarf star in orbit around Sirius (a white supergiant). Credit: NASA, ESA and G. Bacon (STScI)
Stars are beautiful, wondrous things. Much like planets, planetoids and other stellar bodies, they come in many sizes, shapes, and even colors. And over the course of many centuries, astronomers have come to discern several different types of stars based on these fundamental characteristics.
For instance, the color of a star – which varies from bluish-white and yellow to orange and red – is primarily due to its composition and effective temperature. And at all times, stars emit light which is a combination of several different wavelengths. On top of that, the color of a star can change over time.
Composition:
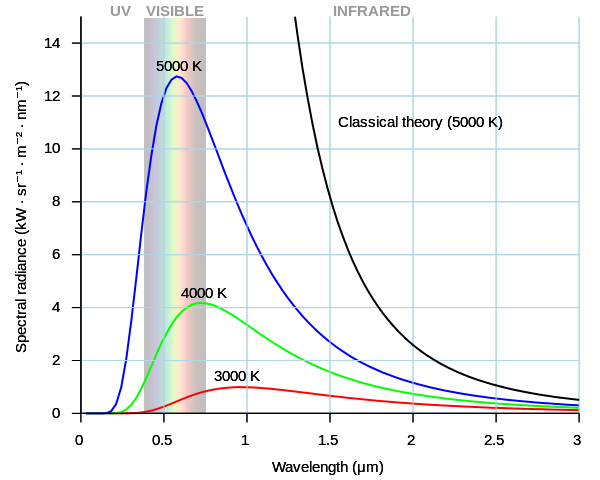
Different elements emit different wavelengths of electromagnetic radiation when heated. In the case of stars, his includes its main constituents (hydrogen and helium), but also the various trace elements that make it up. The color that we see is the combination of these different electromagnetic wavelengths, which are referred to as as a Planck’s curve.
Diagram illustrating Wein’s Law, which describes the emission of radiation from a black body based on its peak wavelength. Credit: Wikipedia Commons/Darth
The wavelength at which a star emits the most light is called the star’s “peak wavelength” (which known as Wien’s Law), which is the peak of its Planck curve. However, how that light appears to the human eye is also mitigated by the contributions of the other parts of its Planck curve.
In short, when the various colors of the spectrum are combined, they appear white to the naked eye. This will make the apparent color of the star appear lighter than where star’s peak wavelength falls on the color spectrum. Consider our Sun. Despite the fact that its peak emission wavelength corresponds to the green part of the spectrum, its color appears pale yellow.
A star’s composition is the result of its formation history. Ever star is born of a nebula made up of gas and dust, and each one is different. While nebulas in the interstellar medium are largely composed of hydrogen, which is the main fuel for star creation, they also carry other elements. The overall mass of the nebula, as well as the various elements that make it up, determine what kind of star will result.
The change in color these elements add to stars is not very obvious, but can be studied thanks to the method known as spectroanalysis. By examining the various wavelengths a star produces using a spectrometer, scientists are able to determine what elements are being burned inside.
Temperature and Distance:
The other major factor effecting a star’s color is its temperature. As stars increase in heat, the overall radiated energy increases, and the peak of the curve moves to shorter wavelengths. In other words, as a star becomes hotter, the light it emits is pushed further and further towards the blue end of the spectrum. As stars grow colder, the situation is reversed (see below).
A third and final factor that will effect what light a star appears to be emitting is known as the Doppler Effect. When it comes to sound, light, and other waves, the frequency can increase or decrease based on the distance between the source and the observer.
When it comes to astronomy, this effect causes the what is known as “redshift” and “blueshift” – where the visible light coming from a distant star is shifted towards the red end of the spectrum if it is moving away, and the blue end if it is moving closer.
Modern Classification:
Modern astronomy classifies stars based on their essential characteristics, which includes their spectral class (i.e. color), temperature, size, and brightness. Most stars are currently classified under the Morgan–Keenan (MK) system, which classifies stars based on temperature using the letters O, B, A, F, G, K, and M, – O being the hottest and M the coolest.
Each letter class is then subdivided using a numeric digit with 0 being hottest and 9 being coolest (e.g. O1 to M9 are the hottest to coldest stars). In the MK system, a luminosity class is added using Roman numerals. These are based on the width of certain absorption lines in the star’s spectrum (which vary with the density of the atmosphere), thus distinguishing giant stars from dwarfs.
Luminosity classes 0 and I apply to hyper- or supergiants; classes II, III and IV apply to bright, regular giants, and subgiants, respectively; class V is for main-sequence stars; and class VI and VII apply to subdwarfs and dwarf stars. There is also the Hertzsprung-Russell diagram, which relates stellar classification to absolute magnitude (i.e. intrinsic brightness), luminosity, and surface temperature.
The same classification for spectral types are used, ranging from blue and white at one end to red at the other, which is then combined with the stars Absolute Visual Magnitude (expressed as Mv) to place them on a 2-dimensional chart (see below).
The Hertzspirg-Russel diagram, showing the relation between star’s color, AM. luminosity, and temperature. Credit: astronomy.starrynight.com
On average, stars in the O-range are hotter than other classes, reaching effective temperatures of up to 30,000 K. At the same time, they are also larger and more massive, reaching sizes of over 6 and a half solar radii and up to 16 solar masses. At the lower end, K and M type stars (orange and red dwarfs) tend to be cooler (ranging from 2400 to 5700 K), measuring 0.7 to 0.96 times that of our Sun, and being anywhere from 0.08 to 0.8 as massive.
Stellar Evolution:
Stars also go through an evolutionary life cycle, during which time their sizes, temperatures and colors change. For example, when our Sun exhausts all the hydrogen in its the core, it will become unstable and collapse under its own weight. This will cause the core to heat up and get denser, causing the Sun to grow in size.
At this point, it will have left its Main Sequence phase and entered into the Red Giant Phase of its life, which (as the name would suggest) will be characterized by expansion and it becoming a deep red. When this happens, it is theorized that our Sun will expand to encompass the orbits of Mercury and even Venus.
Earth, if it survives this expansion, will be so close that it will be rendered uninhabitable. When our Sun then reaches its post-Red Giant Phase, the Sun will begin to eject mass, leaving an exposed core known as a white dwarf. This remnant will survive for trillions of years before fading to black.
This is believed to be the case with all stars that have between 0.5 to 1 Solar Mass (half, or as much mass of our Sun). The situation is slightly different when it comes to low mass stars (i.e. red dwarfs), which typically have around 0.1 Solar Masses.
It is believed that these stars can remain in their Main Sequence for some six to twelve trillion years and will not experience a Red Giant Phase. However, they will gradually increase in both temperature and luminosity, and will exist for several hundred billion more years before they eventually collapse into a white dwarf.
On the other hand, supergiant stars (up to 100 Solar Masses or more) have so much mass in their cores that they will likely experience helium ignition as soon as they exhaust their supplies of hydrogen. As such, they will likely not survive to become Red Supergiants, and will instead end their lives in a massive supernova.
To break it all down, stars vary in color depending on their chemical compositions, their respective sizes and their temperatures. Over time, as these characteristics change (as a result of them spending their fuel) many will darken and become redder, while others will explode magnificently. The more stars observe, the more we come to know about our Universe and its long, long history!