Rosetta Detects Water on its Target Comet

Artist's impression (from 2002) of Rosetta orbiting Comet 67P/Churyumov-Gerasimenko. Credit: ESA, image by AOES Medialab

It’s no surprise that there is a lot of water in comets. The “dirty snowballs” (or dusty ice-balls, more accurately) are literally filled with the stuff, so much in fact it’s thought that comets played a major role in delivering water to Earth. But every comet is unique, and the more we learn about them the more we can understand the current state of our Solar System and piece together the history of our planet.

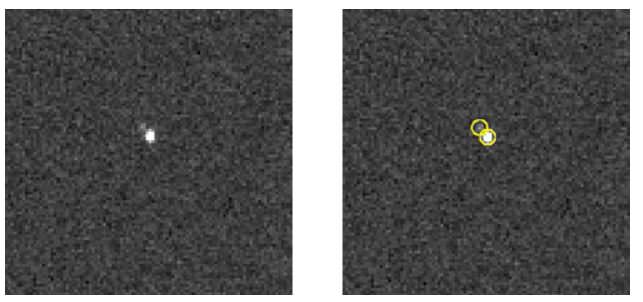
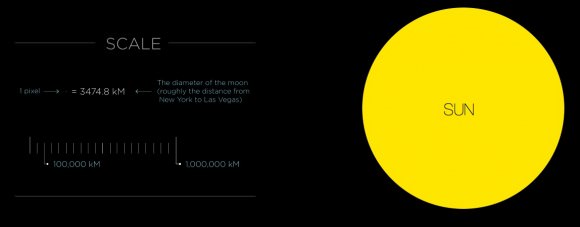
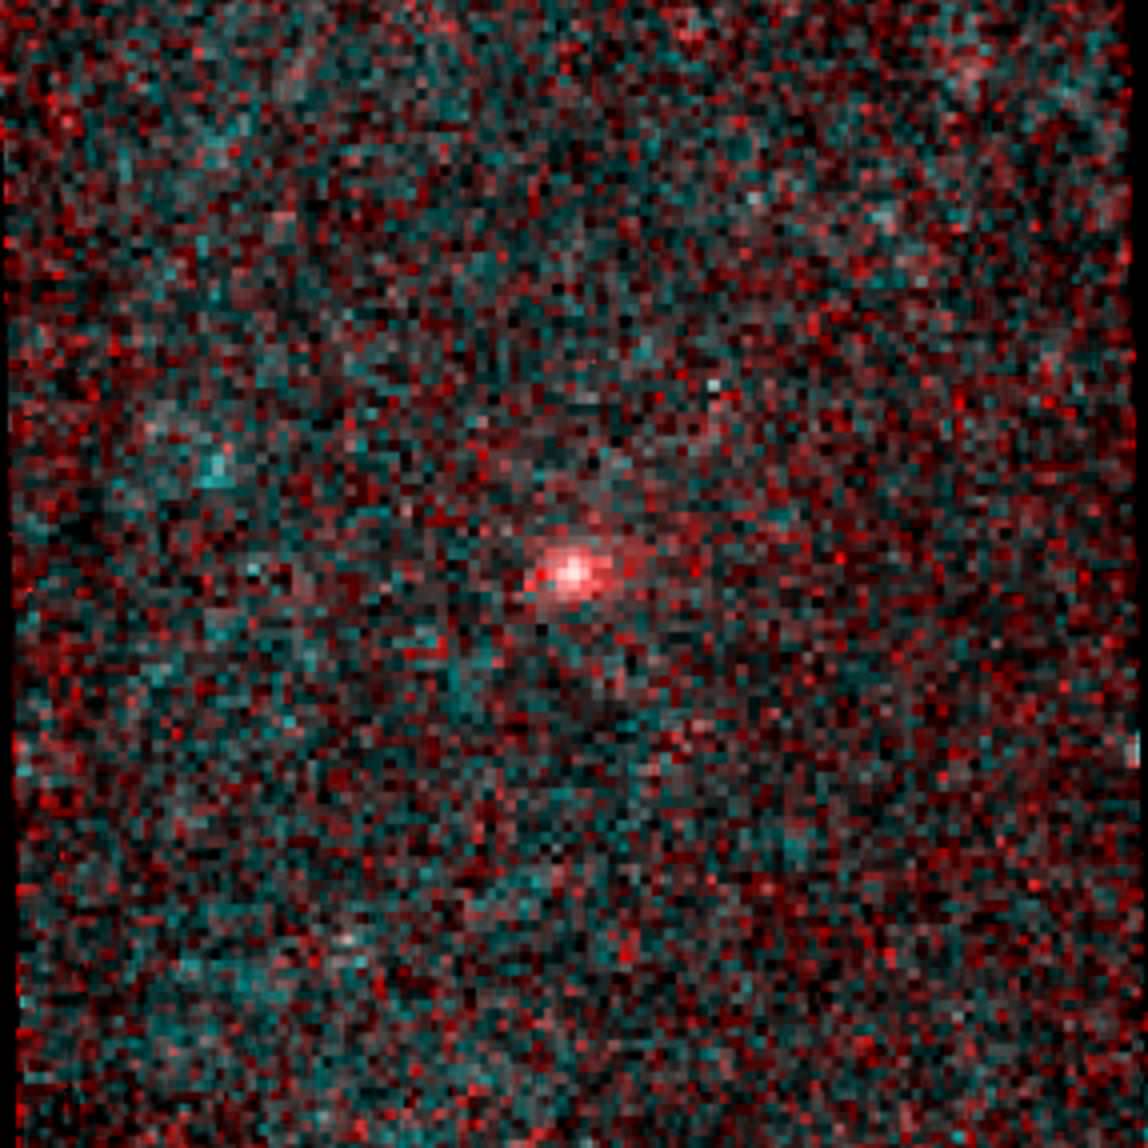
ESA’s Rosetta spacecraft is now entering the home stretch for its rendezvous with comet 67P/Churyumov-Gerasimenko in August. While it has already visually imaged the comet on a couple of occasions since waking from its hibernation, its instruments have now successfully identified water on 67P for the first time, from a distance of 360,000 km — about the distance between Earth and the Moon.

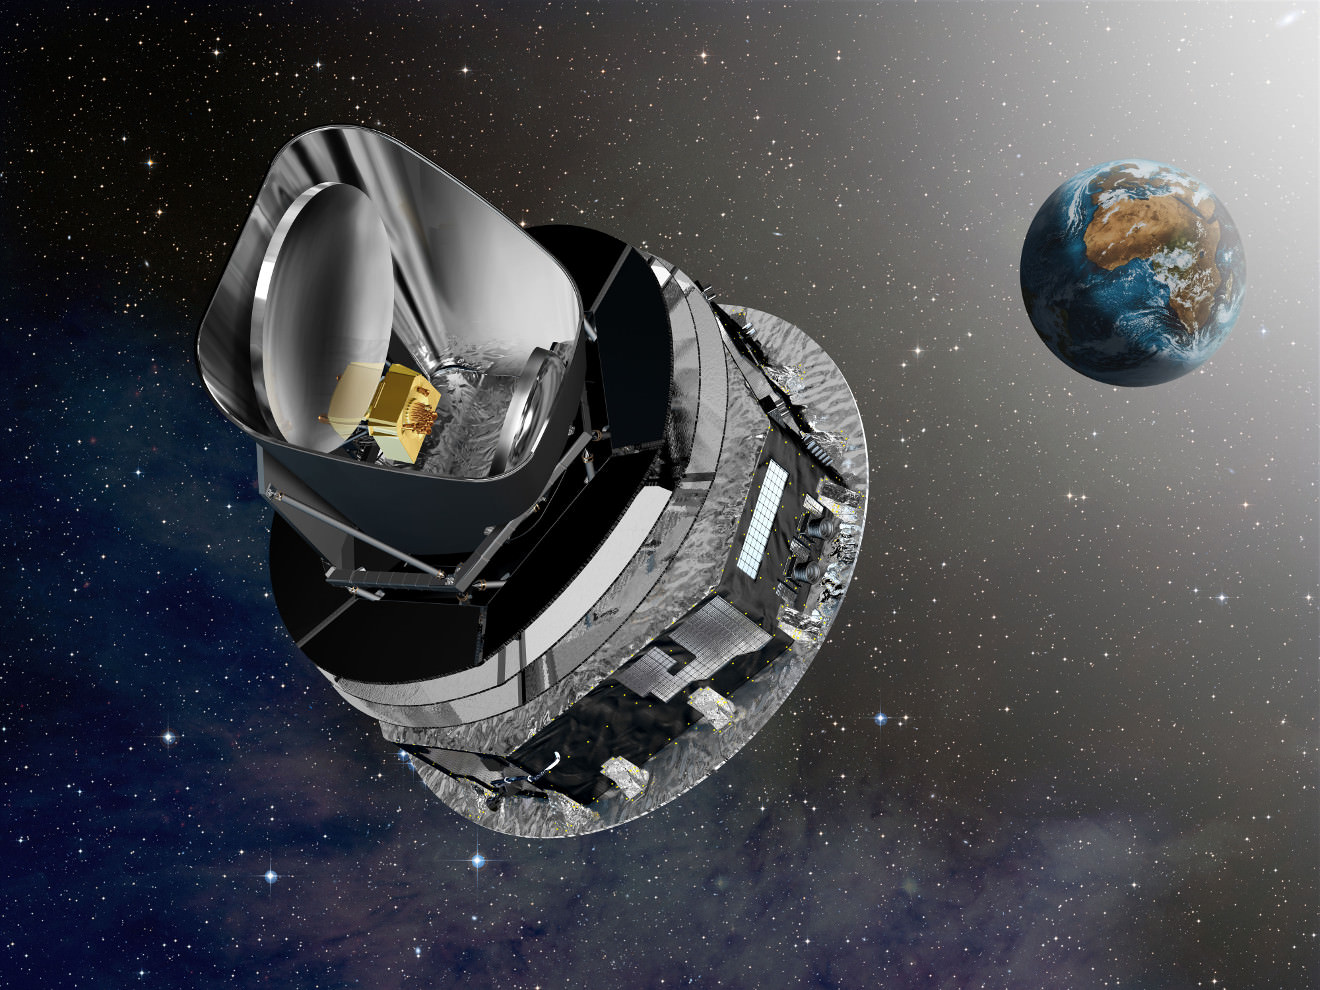
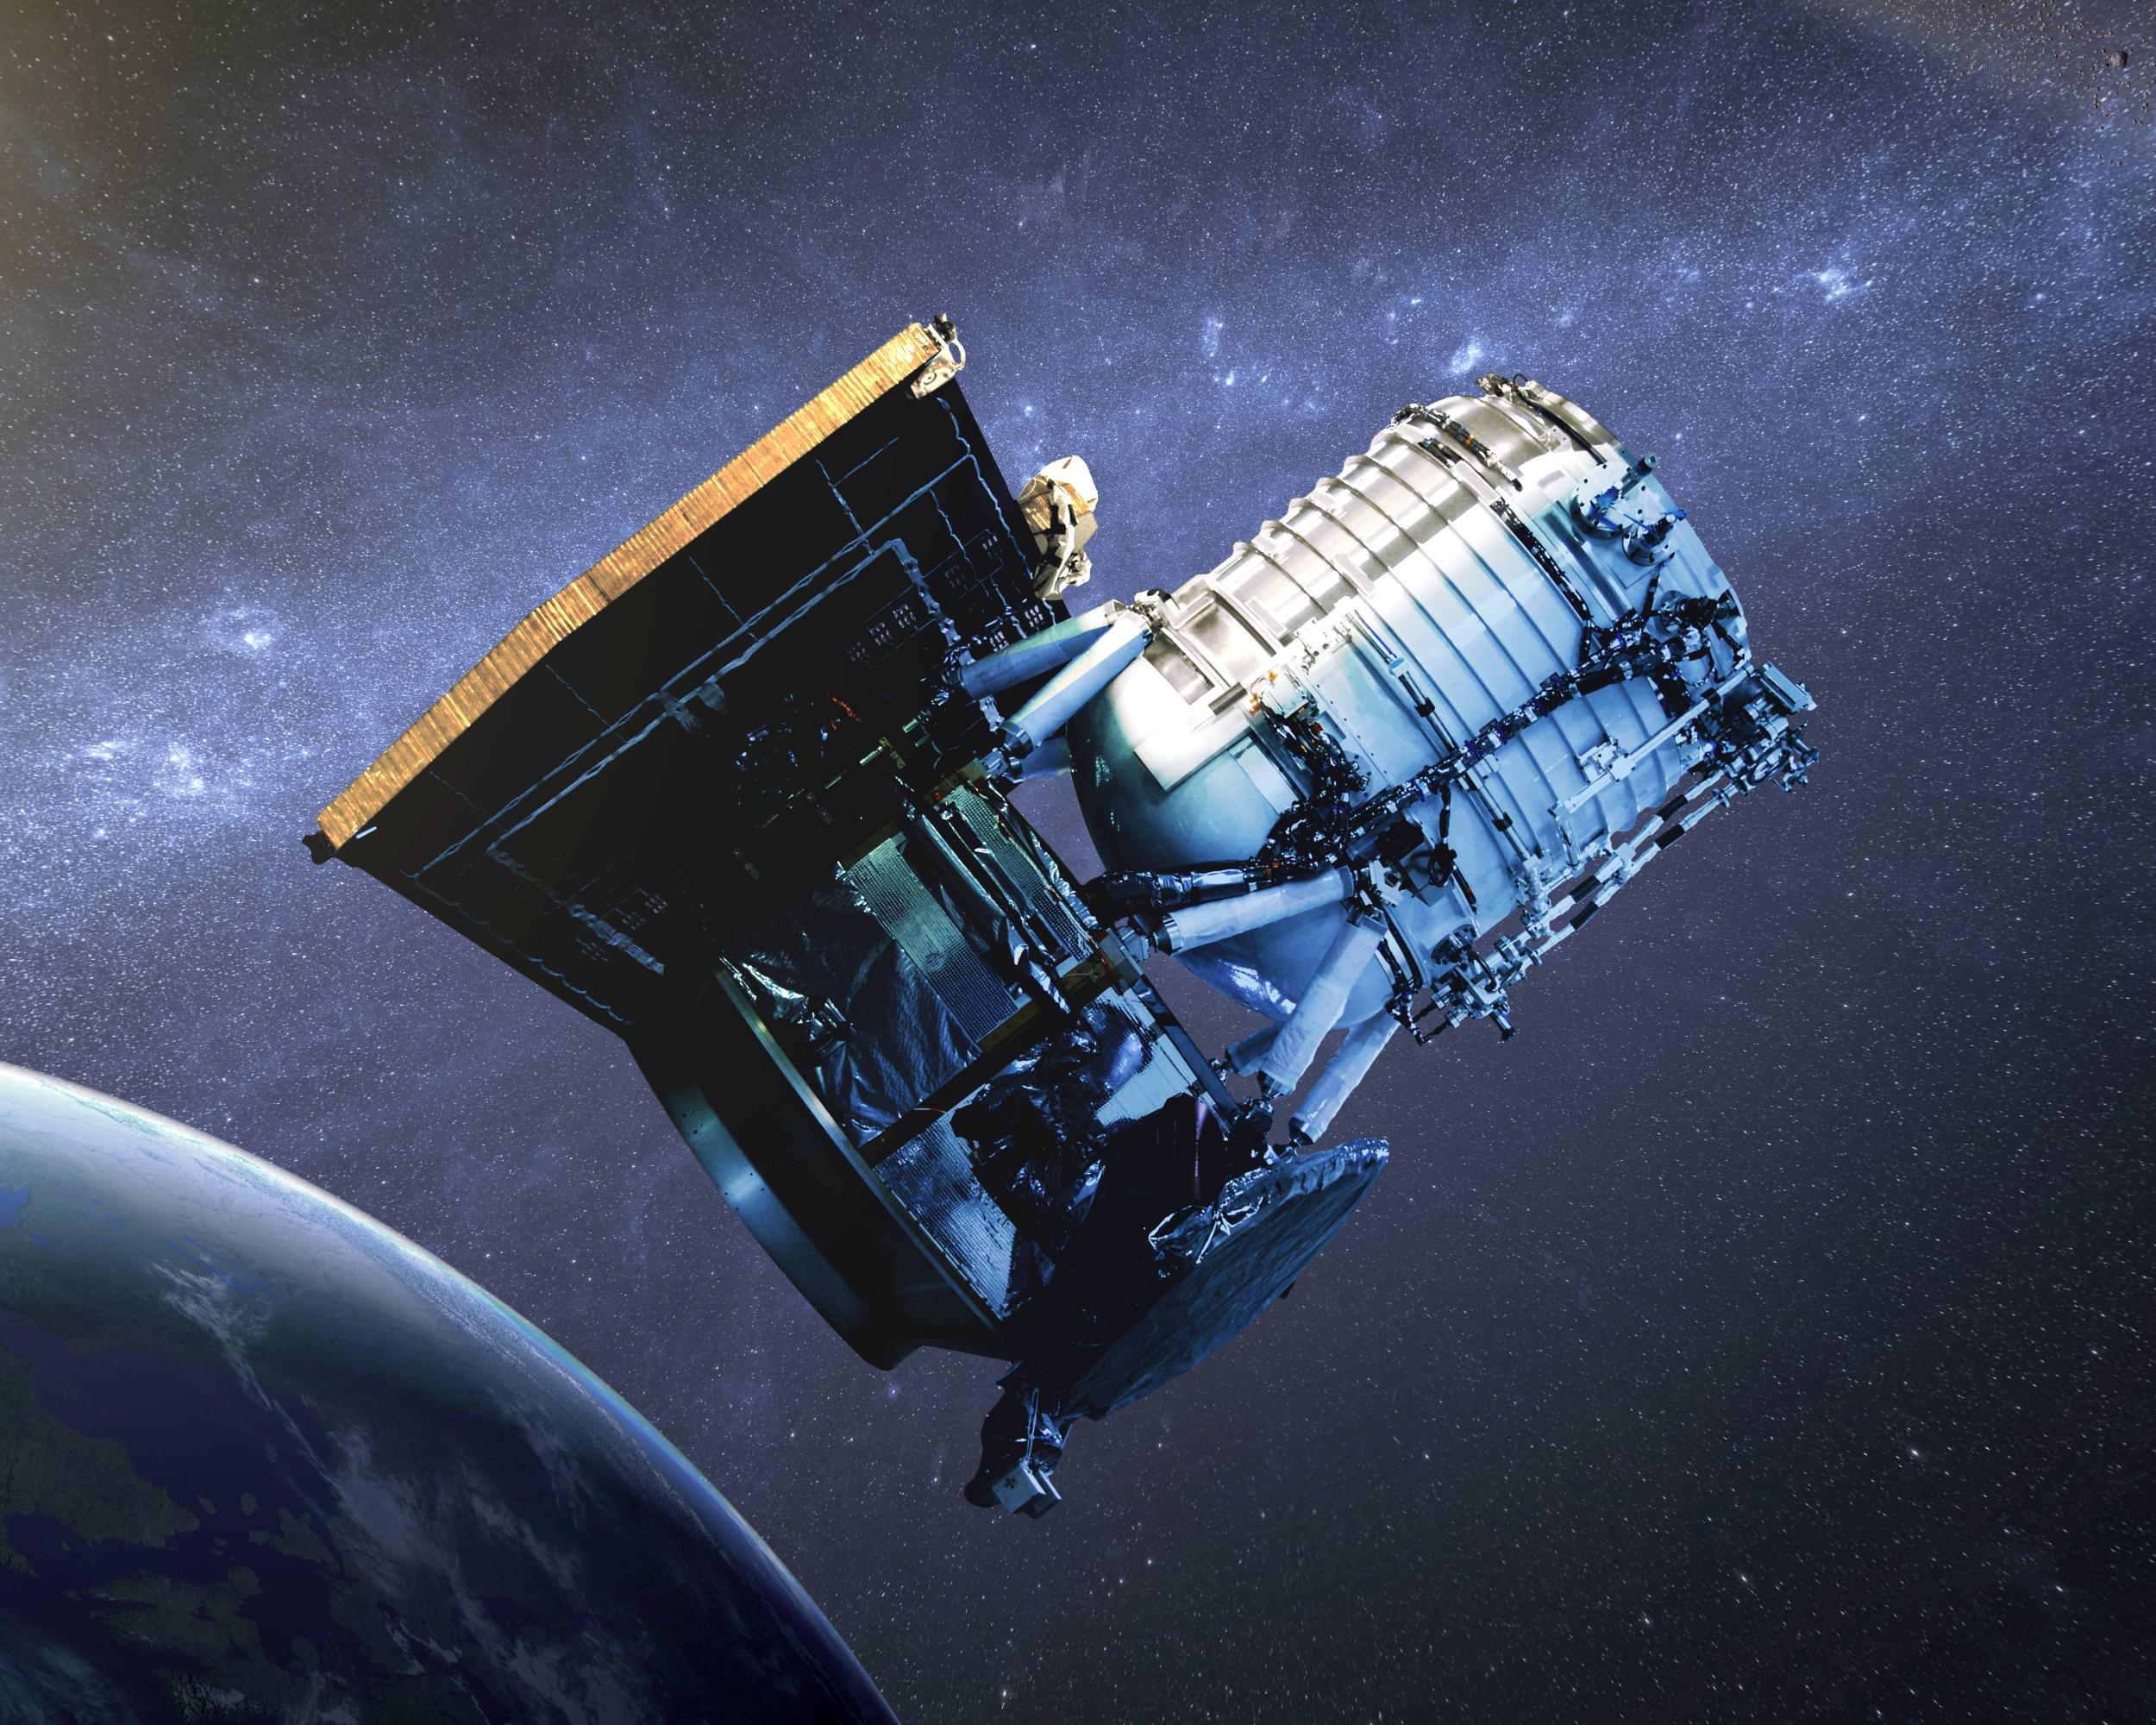
The detection comes via Rosetta’s Microwave Instrument for Rosetta Orbiter, or MIRO, instrument. The results were distributed this past weekend to users of the IAU’s Central Bureau of Astronomical Telegrams:

S. Gulkis, Jet Propulsion Laboratory, California Institute of Technology, on behalf of the Microwave Instrument on Rosetta Orbiter (MIRO) science team, reports that the (1_10)-(1_01) water line at 556.9 GHz was first detected in Comet 67P/Churyumov-Gerasimenko with the MIRO instrument aboard the Rosetta spacecraft on June 6.55, 2014 UT. The line area is 0.39 +/-0.06 K km/s with the line amplitude of 0.48 +/-0.06 K and the line width of 0.76 +/-0.12 km/s. At the time of the observations, the spacecraft to comet distance was ~360,000 km and the heliocentric distance of the comet was 3.93 AU. An initial estimate of the water production rate based on the measurements is that it lies between 0.5 x 10^25 molecules/s and 4 x 10^25 molecules/s.

Although recent images of 67P/C-G seem to show that the comet’s brightness has decreased over the past couple of months, it is still on its way toward the Sun and with that will come more warming and undoubtedly much more activity. These recent measurements by MIRO show that the comet’s water production rate is “within the range of models being used” by scientists to anticipate its behavior.

Rosetta image of Comet 67P/C-G on June 4, 2014, from a distance of 430,000 km. Credits: ESA/Rosetta/MPS for OSIRIS Team MPS/UPD/LAM/IAA/SSO/INTA/UPM/DASP/IDA

Read more: What Will Rosetta’s Comet Look Like?

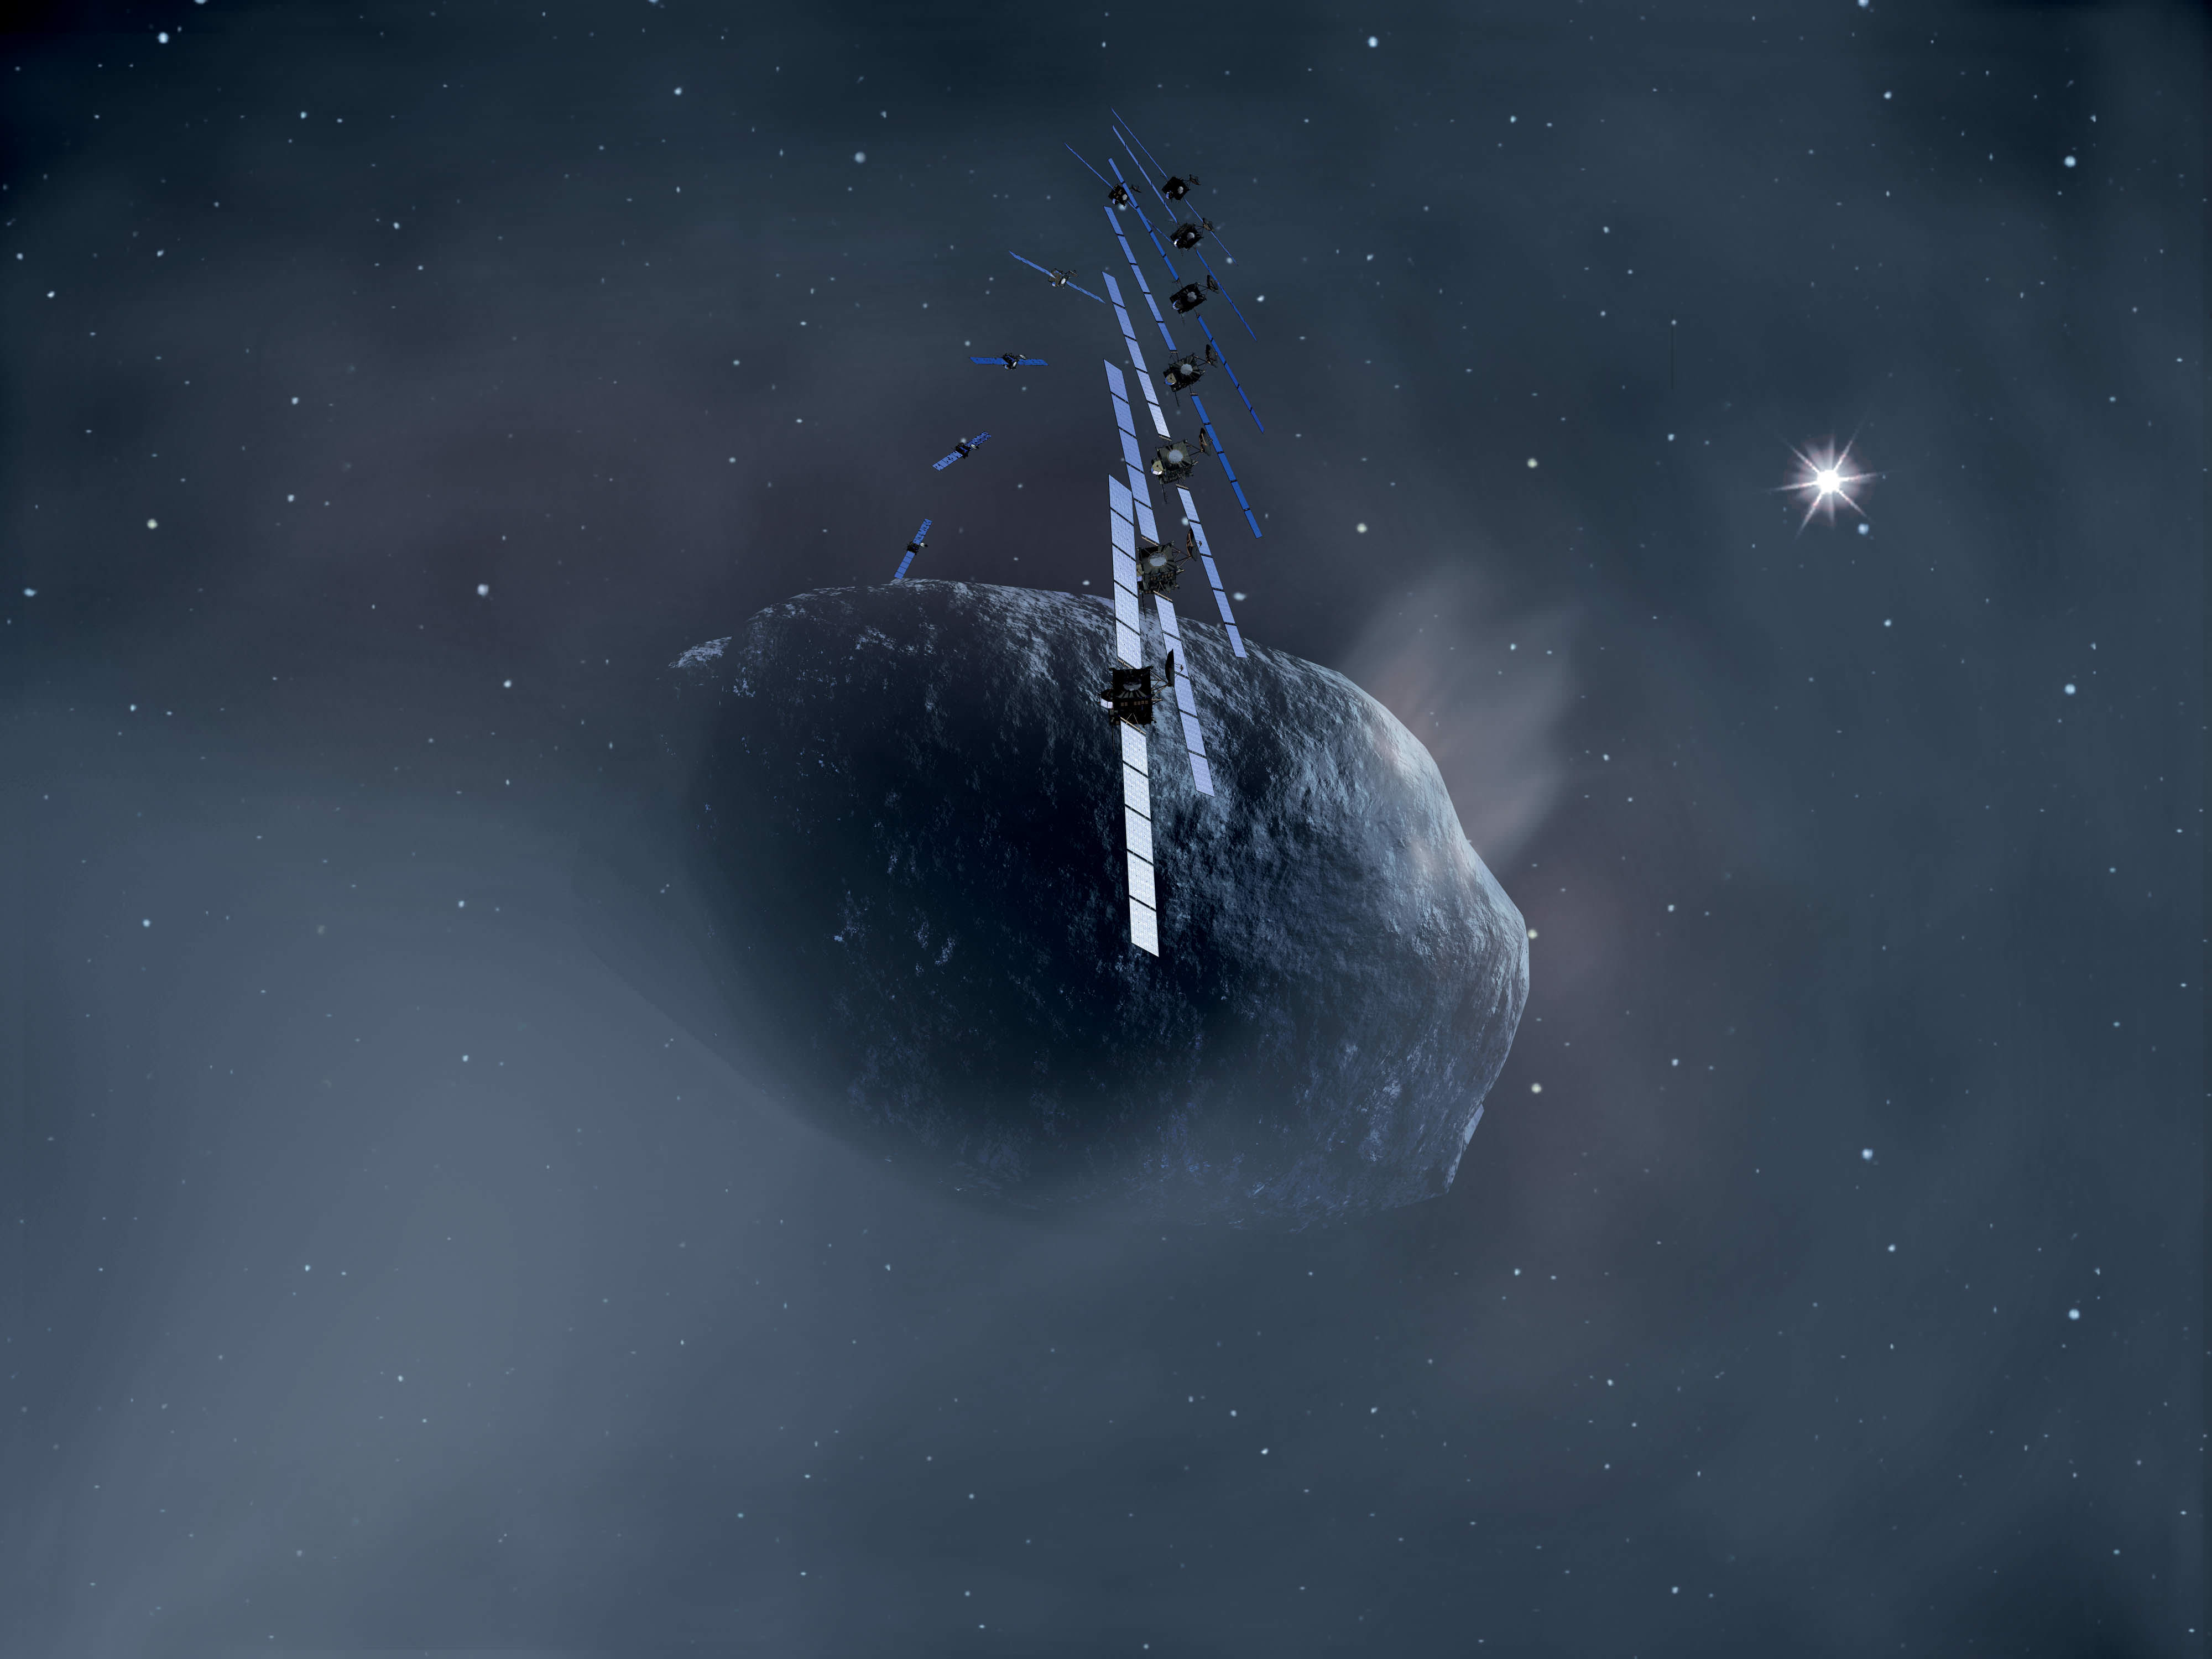
This August Rosetta will become the first spacecraft to establish orbit around a comet and, in November, deploy its Philae lander onto its surface. Together these robotic explorers will observe first-hand the changes in the comet as it makes its closest approach to the Sun in August 2015. It’s going to be a very exciting year ahead, so stay tuned for more!

Learn more about the Rosetta mission here.

Source: ESA’s Rosetta blog


New Horizons Wakes Up for the Summer

New Horizons
Artist's impression of the New Horizons spacecraft. Image Credit: NASA

While many kids in the U.S. are starting their school summer vacations, New Horizons is about to get back to work! Speeding along on its way to Pluto the spacecraft has just woken up from hibernation, a nap it began five months (and 100 million miles) ago.

The next time New Horizons awakens from hibernation in December, it will be beginning its actual and long-awaited encounter with Pluto! But first the spacecraft and its team have a busy and exciting summer ahead.

New Horizons Tweeted about its Father's Day wakeup call
New Horizons tweeted about its Father’s Day wakeup call

After an in-depth checkout of its onboard systems and instruments, the New Horizons team will “track the spacecraft to refine its orbit, do a host of instrument calibrations needed before encounter, carry out a small but important course correction, and gather some cruise science,” according to principal investigator Alan Stern in his June 11 update, aptly titled “Childhood’s End.”

What’ll be particularly exciting for us space fans is an animation of Pluto and Charon in motion around each other, to be made from new observations to be acquired in July. Because of New Horizons’ position, the view will be from a perspective not possible from Earth.

New Horizons LOng Range Reconnaissance Imager (LORRI) composite image showing the detection of Pluto’s largest moon, Charon, cleanly separated from Pluto itself. (Credit: NASA/Johns Hopkins University Applied Physics Laboratory/Southwest Research Institute)
New Horizons LOng Range Reconnaissance Imager (LORRI) image of Pluto and Charon from July 2013 (Credit: NASA/Johns Hopkins University Applied Physics Laboratory/Southwest Research Institute)

The next major milestone for New Horizons will be its crossing of Neptune’s orbit on August 25. (This just happens to fall on the 25th anniversary of Voyager 2’s closest approach in 1989.) “After that,” Stern says, “we’ll be in ‘Pluto space!'”

Read more: An Ocean on Pluto’s Moon?

Launched on Jan. 19, 2006, New Horizons will make its closest approach to Pluto on July 14, 2015 at 11:49 UTC. Traveling nearly 35,000 mph (55,500 km/h) it’s one of the fastest vehicles ever built, moving almost 20 times faster than a bullet. 

Read more from Alan Stern in his latest “PI Perspective” article on the New Horizons web site here, and check out NASA’s mission page here for the latest news as well.

“There is a lot to tell you about over the next 12 weeks, and this is just the warm-up act. Showtime — the start of the encounter — begins in just six months. This is what New Horizons was built for, and what we came to do. In a very real sense, the mission is emerging into its prime.”

– Alan Stern, New Horizons principal investigator

Also, check out a video on Pluto and the New Horizons mission here.

Why Isn’t the Asteroid Belt a Planet?

Why Isn’t the Asteroid Belt a Planet?

It seems like there’s a strange gap in between Mars and Jupiter filled with rocky rubble. Why didn’t the asteroid belt form into a planet, like the rest of the Solar System?

Beyond the orbit of Mars lies the asteroid belt its a vast collection of rocks and ice, leftover from the formation of the solar system. It starts about 2 AU, ends around 4 AU. Objects in the asteroid belt range from tiny pebbles to Ceres at 950 km across.

Star Wars and other sci-fi has it all wrong. The objects here are hundreds of thousand of kilometers apart. There’d be absolutely no danger or tactical advantage to flying your spacecraft through it.

To begin with, there actually isn’t that much stuff in the asteroid belt. If you were to take the entire asteroid belt and form it into a single mass, it would only be about 4% of the mass of our Moon. Assuming a similar density, it would be smaller than Pluto’s moon Charon.

There’s a popular idea that perhaps there was a planet between Mars and Jupiter that exploded, or even collided with another planet. What if most of the debris was thrown out of the solar system, and the asteroid belt is what remains?

We know this isn’t the case for a few of reasons. First, any explosion or collision wouldn’t be powerful enough to throw material out of the Solar System. So if it were a former planet we’d actually see more debris.

Second, if all the asteroid belt bits came from a single planetary body, they would all be chemically similar. The chemical composition of Earth, Mars, Venus, etc are all unique because they formed in different regions of the solar system. Likewise, different asteroids have different chemical compositions, which means they must have formed in different regions of the asteroid belt.

Asteroids
Artist’s depiction of the asteroid belt between Mars and Jupiter. Credit: David Minton and Renu Malhotra

In fact, when we look at the chemical compositions of different asteroids we see that they can be grouped into different families, with each having a common origin. This gives us a clue as to why a planet didn’t form where the asteroid belt is.

If you arrange all the asteroids in order of their average distance from the Sun, you find they aren’t evenly distributed. Instead you find a bunch, then a gap, then a bunch more, then another gap, and so on. These gaps in the asteroid belt are known as Kirkwood gaps, and they occur at distances where an orbit would be in resonance with the orbit of Jupiter.

Jupiter’s gravity is so strong, that it makes asteroid orbits within the Kirkwood gaps unstable. It’s these gaps that prevented a single planetary body from forming in that region. So, because of Jupiter, asteroids formed into families of debris, rather than a single planetary body.

What do you think? What’s your favorite object in the asteroid belt. Tell us in the comments below.

ESA Marks 50 Years of Cooperative Space Innovation

Illustration of the ESA Planck Telescope in Earth orbit (Credit: ESA)

In 1964 the European Launcher Development Organisation (ELDO) and the European Space Research Organisation (ESRO) were founded, on February 29 and March 20 respectively, marking the beginning of Europe as a major space power and player in the new international venture to explore beyond our planet. A decade later these two entities merged to become ESA, and the rest, as it’s said, is history.

The video above commemorates ESA’s service to the cooperation and innovation of European nations in space, and indeed the entire world with many of the far-reaching exploration missions its member states have developed, launched and maintained. From advanced communications and observational satellites to its many missions exploring the worlds of the Solar System to capturing the light from the beginning of the Universe, ELDO, ESRO, and ESA have pushed the boundaries of science and technology in space for half a century… and are inspiring the next generation to continue exploring into the decades ahead. So happy anniversary, ESA — I can only imagine what we might be looking back on in another 50 years!

Source: ESA. See more key dates from ESA’s history here

Mercury’s Ready For Its Close-Up, Mr. MESSENGER

One of the highest-resolution images of Mercury's surface ever acquired.

Are you ready for a good close look at Mercury? At an incredible 5 meters per pixel, this is one of the highest-resolution images of Mercury’s surface ever captured. It was acquired on March 15 with the MESSENGER spacecraft’s MDIS (Mercury Dual Imaging System) instrument and shows an 8.3-km (5.2-mile) -wide section of Mercury’s north polar region, speckled with small craters and softly rolling hills.

Because MESSENGER was moving so quickly relative to the targeted area it was imaging, a short exposure time was necessary to avoid blurring. As a result the image appears a bit grainy. See the original map projection here.

Wondering what the next-best image was of Mercury? Find out below:

The previous record for most extreme close-up of Mercury was held by this image:

7 meter/pixel targeted observation of Mercury by the MESSENGER spacecraft

It was acquired as a targeted observation by MESSENGER’s Narrow-Angle Camera on April 30, 2012, and has a resolution of 7 meters/pixel. It shows an impact melt-covered area about 11 km (7 miles) across near Gaugin crater.

(Although Mercury’s surface may at first appear strikingly similar to the Moon’s, it’s been known since the Mariner 10 mission that the two worlds are very different at fundamental geologic and compositional levels. Read more on that here.)

Images like these are extremely special; during the first two years of MESSENGER’s mission in orbit around Mercury, over 150,000 images were acquired but only five images had resolutions better than 10 meters per pixel.

Artist's impression of MESSENGER orbiting Mercury
Artist’s impression of MESSENGER orbiting Mercury

On April 20, 2014, MESSENGER completed its 3,000th orbit of Mercury (3,075 to date) and is steadily moving into an even lower-altitude orbit. MESSENGER now comes within less than 200 km (124 miles) of the planet’s surface when it passes over its north pole every eight hours… that’s less than half the altitude of the Space Station!

Orbiting at such a low altitude and so often will allow MESSENGER to examine Mercury’s surface in unprecedented detail. Now that 100% of the planet has been successfully mapped by MESSENGER it can spend its second — and last — extended mission investigating specific scientific targets.

Watch: A Tribute to MESSENGER 

“The final year of MESSENGER’s orbital operations will be an entirely new mission,” said Sean Solomon, Principal Investigator for MESSENGER. “With each orbit, our images, our surface compositional measurements, and our observations of the planet’s magnetic and gravity fields will be higher in resolution than ever before. We will be able to characterize Mercury’s near-surface particle environment for the first time. Mercury has stubbornly held on to many of its secrets, but many will at last be revealed.”

Read more in a recent news release from the MESSENGER team here.

Want to explore a high-res map of Mercury and see where MESSENGER is right now? Click here.

Image credits: NASA/Johns Hopkins University Applied Physics Laboratory/Carnegie Institution of Washington

Cassini’s View of Another Pale Blue Dot

Uranus as seen by Cassini on July 19, 2013 (NASA/JPL-Caltech/SSI)

When you hear the words “pale blue dot” you’re probably reminded of the famous quote by Carl Sagan inspired by an image of Earth as a soberingly tiny speck, as imaged by Voyager 1 on Feb. 14, 1990 from beyond the orbit of Pluto. But there’s another pale blue world in our Solar System: the ice giant Uranus, and its picture was captured much more recently by the Cassini spacecraft from orbit around Saturn on April 11, 2014.

Released today by the Cassini Imaging Team, the image above shows Uranus as a tiny blue orb shining far beyond the bright hazy bands of Saturn’s F ring.

“Do you relish the notion of being a Saturnian, and gazing out from the lofty heights of Saturn at the same planets we see here from the Earth?”
– Carolyn Porco, Cassini Imaging Team Leader

Uranus’ coloration is a result of methane high in its frigid atmosphere. According to the description on the CICLOPS site, “methane on Uranus — and its sapphire-colored sibling, Neptune — absorbs red wavelengths of incoming sunlight, but allows blue wavelengths to escape back into space, resulting in the predominantly bluish color seen here.”

This was also the first time Uranus had been imaged by the Cassini spacecraft, which has been in orbit around Saturn since 2004. In fact its ten-year orbital anniversary will come on July 1.

This image adds one more planet to the list of worlds captured on Camera by Cassini, which made headlines last fall when a glorious mosaic was released that featured a backlit Saturn in eclipse surrounded by its luminous rings, the specks of several of its moons, and the distant dots of Venus, Mars, and the Earth and Moon. Made from 141 separate exposures, the mosaic was captured on July 19, 2013 — known by many space aficionados as “the day the Earth smiled” as it was the first time the world’s population was alerted beforehand that its picture would be taken from over 900 million miles away.

Saturn — with its terrestrial spacecraft in tow — was about 28.6 AU away from Uranus when the image was acquired. That’s about  4.28 billion kilometers (2.66 billion miles). From that distance the glow of the 51,118-kilometer (31,763-mile) -wide Uranus is reduced to a mere few pixels (which required digital brightening by about 4.5x, as well.)

Read more on the Cassini Imaging Central Laboratory for Operations (CICLOPS) page here and in a news release from NASA’s JPL here.

Image credit: NASA/JPL-Caltech/SSI. Source: Carolyn Porco, CICLOPS Director

Mercury Shrinking: the First Rock from the Sun Contracted More than Once Thought

MESSENGER image of Mercury from its third flyby (NASA/Johns Hopkins University Applied Physics Laboratory/Carnegie Institution of Washington)

Whatever Mercury’s did to trim down its waistline has worked better than anyone thought — the innermost planet in our Solar System has reduced its radius* by about 7 kilometers (4.4 miles), over double the amount once estimated by scientists.

Of course you wouldn’t want to rush to begin the Mercury diet — its planetary contraction has taken place over the course of 3.8 billion years, since the end of the Late Heavy Bombardment. Still — lookin’ good, Mercury!

These findings come thanks to the MESSENGER spacecraft, in orbit around Mercury since 2011. Now that MESSENGER has successfully mapped literally all of Mercury’s surface, detailed measurements of more than 5,900 landforms created by cooling and contraction of the planet’s crust have allowed researchers to more precisely determine its geologic history and answer some decades-old questions raised by Mariner 10 images.

“This discrepancy between theory and observation, a major puzzle for four decades, has finally been resolved,” said MESSENGER Principal Investigator Sean Solomon. “It is wonderfully affirming to see that our theoretical understanding is at last matched by geological evidence.”

This image shows a long collection of ridges and scarps on the planet Mercury called a fold-and-thrust belt. The belt stretches over 336 miles (540 km). The colors correspond to elevation—yellow-green is high and blue is low. Image courtesy NASA/Johns Hopkins University Applied Physics Laboratory/Carnegie Institution of Washington.
This image shows a fold-and-thrust belt stretching over 540 km on Mercury. The colors correspond to elevation— yellow/green is high and blue is low. (Courtesy NASA/Johns Hopkins University Applied Physics Laboratory/Carnegie Institution of Washington.)

Using high-definition images acquired with MESSENGER’s MDIS (Mercury Dual Imaging System) instrument, planetary geologist at the Carnegie Institution of Washington and study lead author Paul Byrne and his colleagues identified 5,934 lobate scarps and wrinkle ridges on Mercury that are the result of contraction. From measurements of these features, the team determined that the planet’s radial contraction was much more than that estimated by models based on incomplete imaging from NASA’s Mariner 10 mission — the very first spacecraft to visit (but not orbit) Mercury.

Watch: Fly Across Mercury with MESSENGER!

“These new results resolved a decades-old paradox between thermal history models and estimates of Mercury’s contraction,” said Byrne. “Now the history of heat production and loss and global contraction are consistent.

“Interestingly, our findings are also reminiscent of now-obsolete models for how large-scale geological deformation occurred on Earth when the scientific community thought that the Earth only had one tectonic plate,” Byrne said. “Those models were developed to explain mountain building and tectonic activity in the nineteenth century, before plate tectonics theory.”

Unlike Earth, Mercury has only one global tectonic plate.

The findings were published in the Sunday, March 16 edition of the journal Nature Geoscience.

Source: MESSENGER press release. Read more about tectonic features on Mercury here.

*Mercury’s current radius is  2,440 kilometers (1,516 miles).

If the Moon Were Only One Pixel: a Scale Model of the Solar System

Josh Worth's HTML scale model of the Solar System

One of my favorite pet peeves is the inability of conventional models to accurately convey the gigantic scale of the Solar System. Most of us grew up with models of the planets made of wood or plastic or spray painted styrofoam balls impaled on bent wire hangers (don’t tell Mommy), or, more commonly, illustrations on posters and in textbooks. While these can be fun to look at and even show the correct relative sizes of the planets (although usually not as compared to the Sun) there’s one thing that they simply cannot relate to the viewer: space is really, really, really big.

Now there are some more human-scale models out there that do show how far the planets are from each other, but many of them require some walking, driving, or even flying to traverse their full distances. Alternatively, thanks to the magic of web pages which can be any size you like limited only by the imagination of the creator (and the patience of the viewer), accurate models can be easily presented showing the average (read: mind-blowingly enormous) distances between the planets… and no traveling or wire hangers required.

This is one of those models.* Enjoy.

Despite their similar apparent sizes in our sky, the Moon and Sun are (obviously) quite different in actual size. Which is a good thing for us. (Credit: Josh Worth)

Created by designer Josh Worth, “If the Moon Were Only 1 Pixel: A Tediously Accurate Scale Model of the Solar System” uses a horizontally-sliding HTML page to show how far it is from one planet to another, as well as their relative sizes, based on our Moon being just a single pixel in diameter (and everything lined up neatly in a row, which it never is.) You can use the scroll bar at the bottom of the page or arrow keys to travel the distances or, if you want to feel like you’re at least getting some exercise, scroll with your mouse or computer’s swipe pad (where applicable.) You can also use the astronomical symbols at the top of the page to “warp” to each planet.

Just try not to miss anything — it’s a surprisingly big place out there.

“You may think it’s a long way down the road to the chemist’s, but that’s just peanuts to space.”

– Douglas Adams

See more of Josh Worth’s work here. (HT to Alan Stern.)

*And this is another one.

NEOWISE Spots a “Weirdo” Comet

Infrared image of comet NEOWISE (C/2014 C3). Credit: NASA/JPL-Caltech

NASA’s NEOWISE mission — formerly known as just WISE — has identified the first comet of its new near-Earth object hunting career… and, according to mission scientists, it’s a “weirdo.”

In its former life NASA’s WISE (Wide-field Infrared Survey Explorer) spacecraft scanned the entire sky in infrared wavelengths. It helped discover the galaxy’s coldest stars, the Universe’s brightest galaxies, and some of the darkest asteroids lurking in the main asteroid belt between Mars and Jupiter… as well as closer in to Earth’s neck of the woods.

After exhausting its supply of liquid coolant needed to shield itself from its own radiating heat, in 2011 WISE was put into a state of hibernation. It was awoken last year and rebranded NEOWISE, and set upon the task of locating unknown objects with orbits in the proximity of Earth’s.

Kevin Luhman discovered the brown dwarf pair in data from NASA's Wide-field Infrared Survey Explorer (WISE; artist's impression). Image: NASA/JPL-Caltech
Artist’s impression of the WISE satellite

To date several new asteroids have already been found by NEOWISE, and on February 14, 2014, it spotted its first comet.

“We are so pleased to have discovered this frozen visitor from the outermost reaches of our solar system,” said Amy Mainzer, NEOWISE principal investigator at JPL. “This comet is a weirdo — it is in a retrograde orbit, meaning that it orbits the sun in the opposite sense from Earth and the other planets.”

Designated “C/2014 C3 (NEOWISE),” the comet was 143 million miles (230 million km) away in the image above — a composite made from six infrared exposures. That’s 585 times the distance to the Moon, or about the average distance between the Earth and Mars.

The tail of the comet NEOWISE extends about 25,000 miles (40,000 km) to the right in the image.

Overall, C/2014 C3 (NEOWISE) was spotted six times before it moved out of range of the spacecraft’s view. The comet has a highly-eccentric 20-year orbit that takes it high above the plane of the Solar System and out past the orbit of Jupiter. Technically, with a perihelion distance greater than 1.3 AU, comet C/2014 C3 does not classify as a near-Earth object (and its orbit does not intersect Earth’s.) But it’s still good to know that NEOWISE is looking out for us.

Read more on JPL’s NEOWISE site here, and see details on the comet’s orbit on the Minor Planet Center’s website here and from JPL’s Small-Body Database here.

Source: NASA/JPL

Playing Marbles With The Planets

We’ve all seen charts showing the relative sizes of planets and moons compared to each other, which are cool to look at but don’t really give a sense of the comparative masses of the various worlds in our Solar System. It’s one thing to say the Earth is four times larger than the Moon, it’s entirely another to realize it’s 87 times more massive!

That’s where this new animation from astrophysicist Rhys Taylor comes in nicely.

Continue reading “Playing Marbles With The Planets”