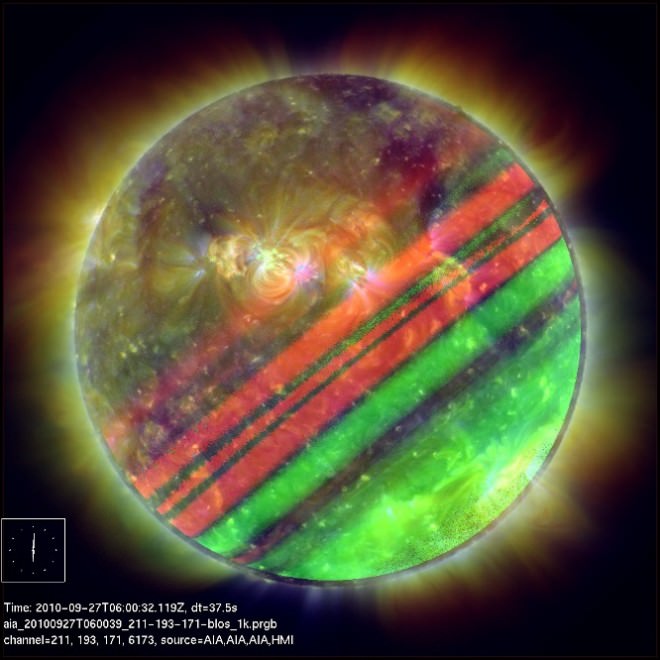
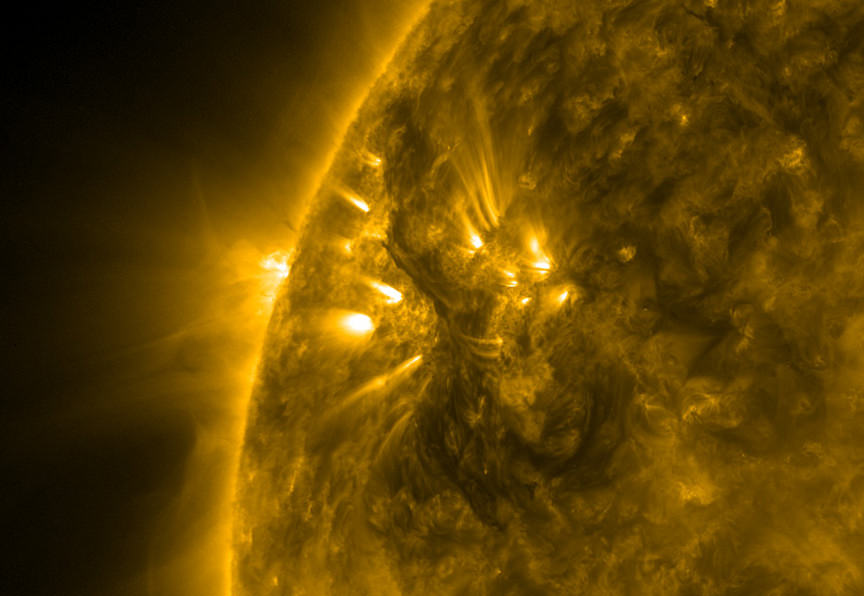
Is this a new object is space that is half Sun and half Jupiter? Sunpiter? Credit: NASA/SDO
[/caption]
“Now we know what it would look like if Jupiter and the sun had a child,” joked Ralph Seguin of the Lockheed-Martin Solar and Astrophysics Lab, trying to explain this weird image. So, just what is it? Some people have been calling it “Sunpiter,” since parts of it looks like the Sun, and other parts look like Jupiter. It really is the Sun, as seen by the Solar Dynamics Observatory, which was having a tough day. Normally, SDO gets a great view of the Sun, but the spacecraft occasionally gets its view blocked by the Earth, in a unusual kind of eclipse. This image is a composite of multiwavelength images and a magnetogram taken by SDO just as the sun was emerging from its daily blackout. “SDO has entered eclipse season,” said Seguin. “Around the time of the equinoxes, the spacecraft, Earth, and sun can line up almost perfectly. Once a day for about an hour, Earth blocks SDO’s view of the sun.” And this is the result.
Magnetograms are computed from a series of images taken over a short time span. The ribbons of color result from Earth’s motion across the sun during the series of exposures. This eclipse season for SDO lasts until October 6, 2010.
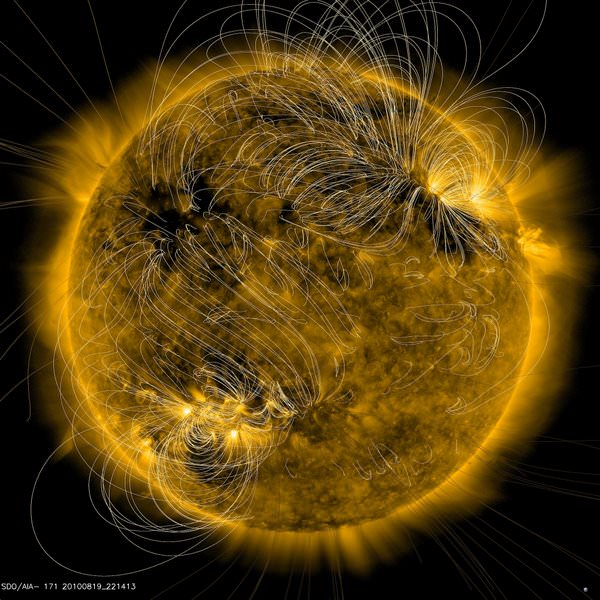
Magnetic field lines on the Sun, on August 20, 2010. Credit: NASA SDO/Lockheed Martin Space Systems Compan
[/caption]
The Sun’s corona is threaded with a complex network of magnetic fields, and this amazing new image from the Solar Dynamics Observatory shows the magnetic field lines associated with a coronal hole that is now turning to face Earth. This map is from data taken on August 20, 2010 by the Helioseismic and Magnetic Imager instrument (HMI). The magnetic field lines are color coded: white lines show fields that are closed, not releasing solar wind, and gold lines show open fields, letting solar wind escape. Understanding these magnetic fields is important because it is thought that solar storms and flares, which can affect us here on Earth, result from changes in the structure and connections of these fields.
Coronal holes are large regions in the corona that are darker, less dense and cooler than surrounding areas. The open structure of their magnetic field allows a constant flow of high-density plasma to stream out of the holes. There is an increase in the intensity of the solar wind effects on Earth when a coronal hole faces.
During a solar minimum, such as the one from which the Sun is just emerging, coronal holes are mainly found at the Sun’s polar regions, but they can be located anywhere on the sun during solar maximum. The fast-moving component of the solar wind is known to travel along open magnetic field lines that pass through coronal holes.
Scientists are finding out that much of the structure of the Sun’s corona is shaped by the magnetic field. Although it varies over time and from place to place on the Sun, the Sun’s magnetic field can be very strong. Inside sunspots, the magnetic field can be several thousand times the strength of the Earth’s magnetic field.
Learn more about magnetic field lines and how SDO’s HMI instrument will help us to better understand the Sun in this video from SDO:
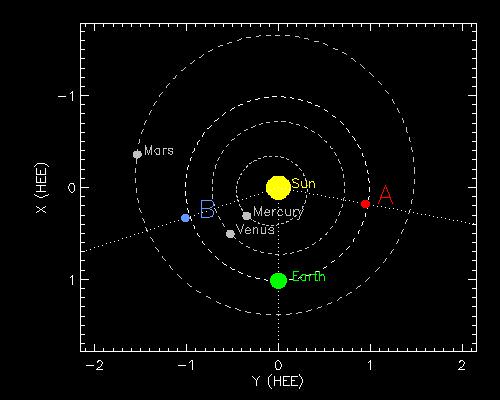
A plot of the STEREO data from August 14, 2010, showing the location of the planets and the direction of a CME from the Sun.
Update: Well, it turns out that while it looks like Venus and Mercury are getting pummeled by Coronal Mass Ejections, the geometry might not work out, at least not for every day that is included in the video above. UT reader Steven Janowiecki brought it to my attention that just because Mercury and Venus look close to the Sun doesn’t mean they’re actually in the line of fire, as they could be well behind or in front of the solar storm. I checked with STEREO project scientist Dr. Joseph Gurman, who took a look at the data. He put together a plot for August 14, (see below) and said, “It shows that Mercury and Venus are well to the East (left) of the Sun-earth line. The large CME on the 14th originated from an active region near the west limb of the Sun, and since most CME’s are about 60 degrees of heliolongitude in width on average, it’s unlikely that that event actually passed by Mercury or Venus.” There was one large event, however, on August 7, that appeared likely to be headed in the direction of Mercury and Venus.
[/caption]
So, as it happens sometimes in astronomy, things are not always as they appear, and this exemplifies the challenges of estimating distance in astronomy.
Here’s the rest of the article as it ran originally:
Take a look at these Coronal Mass Ejections (CME) from the first part of August 2010, as seen by the two STEREO spacecraft. Here on Earth, we’ve had some aurorae, a result of the recent solar activity. But this STEREO imagery shows Venus and Mercury were blasted by these CMEs.
STEREO consists of two spacecraft – one ahead of Earth in its orbit, the other trailing behind. With this new pair of viewpoints, scientists are able to see the structure and evolution of solar storms as they blast from the Sun and move out through space.
These movies were taken by SECCHI, a suite of remote sensing instruments on both spacecraft consisting of two white light coronagraphs that make up the Sun Centered Imaging Package (SCIP), as well as a Heliospheric Imager (HI).
SECCHI can follow three-dimensional Coronal Mass Ejections (CMEs) from the Sun’s surface, through the corona and interplanetary medium, to impact at Earth. With these instruments, scientists are getting breakthroughs in understanding the origin and consequences of CMEs, in determining their three-dimensional structure, and more, and perhaps be able to predict space weather. Combining STEREO with the new Solar Dynamics Observatory, we’ll be learning more and more about the Sun in the next few years.
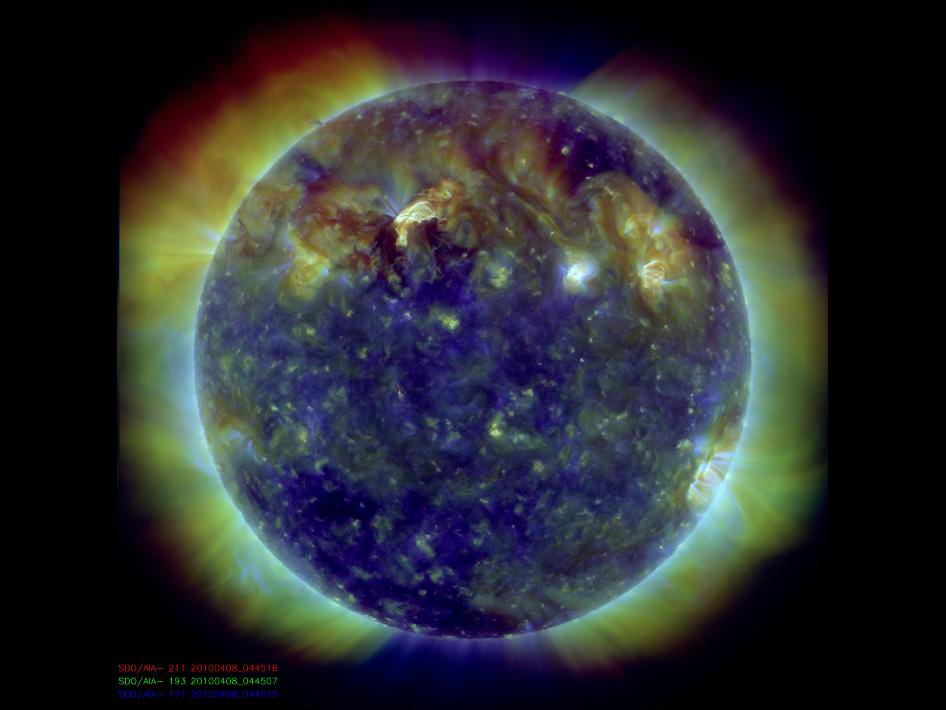
As an example of SDO’s capabilities, here’s an SDO image from earlier today showing the Sun’s limb.
View of the Sun from August 18, 2010 from the Solar Dynamics Observatory. Credit: NASA/SDO
A new view of the sun from the Solar Dynamics Observatory. Credit: NASA
[/caption]
Already, the Solar Dynamics Observatory, or SDO, has taken over 5 million images, and the firehose of data and spectacular images is allowing solar scientists to begin understanding the dynamic nature of solar storms. With SDO, scientists are seeing that even minor solar events can have large effects across the Sun. “In essence, we are watching the butterfly effect in action on the Sun,” said Dean Pesnell, SDO project scientist.
The Atmospheric Imaging Assembly (AIA), one of three instruments aboard SDO, records high-resolution full-disk images of the Sun’s corona and chromosphere in more channels and at a higher rate than ever before. “This will allow us to zoom in on small regions and see far more detail in time and space, and zoom in on any part we want,” said Pesnell. “By looking at entire Sun we can see how one part of the Sun affects another. You can then zoom in to measure the changes in great detail.”
Large eruptive prominence on the sun's edge, as seen by SDO. Credit: NASA
Shortly after AIA opened its doors on March 30, scientists observed a large eruptive prominence on the sun’s edge, followed by a filament eruption a third of the way across the star’s disk from the eruption.
“Even small events restructure large regions of the solar surface,” said Alan Title, AIA principal investigator at Lockheed Martin Advanced Technology Center. “It’s been possible to recognize the size of these regions because of the combination of spatial, temporal and area coverage provided by AIA.”
At the 216th American Astronomical Society meeting this week, Title said that some of the initial data from SDO is providing maps of magnetic fields and movies that are giving scientists some confidence in trying to decipher the cause and effect of solar storms
AIA observed a number of very small flares that have generated magnetic instabilities and waves with clearly-observed effects over a substantial fraction of the solar surface. The instrument is capturing full-disk images in eight different temperature bands that span 10,000 to 36-million degrees Fahrenheit. This allows scientists to observe entire events that are very difficult to discern by looking in a single temperature band, at a slower rate, or over a more limited field of view.
Solar storms produce disturbances in electromagnetic fields that can induce large currents in wires, disrupting power lines and causing widespread blackouts here on Earth. The storms can interfere with global positioning systems, cable television, and communications between ground controllers and satellites and airplane pilots flying near Earth’s poles. Radio noise from solar storms also can disrupt cell phone service.
To help scientists and the public to understand and have access to the large amount of data being returned by SDO, the science team has built some tools to help communicate the data.
New websites will help researchers find data sets relative to their topics of interest and provide an overview to the casual observer.
“SDO generates as much data in a single day as the TRACE mission produced in five years,” said Neal Hurlburt from SDO mission, from Lockheed Martin. “We want to share it with the public, but we want to do it in an effective way, so we developed the Heliophysics Events Knowledgebase (HEK) and the Sun Today Website.”
The Sun Today website displays the current state of events on the sun. These can guide researchers and others to more detailed descriptions and access to associated SDO data.
HEK includes the Event and Coverage Registries (HER, HCR), Inspection & Analysis Tools, Event Identification System and Movie Processing. Event services enable web clients to interact with the HEK.
There is also a tutorial on how to work with the data, and extract images and movies from the SDO data.
View of action on the Sun during this past week. Credit: NASA/SDO team
[/caption]
Images and data are starting to roll in from the Solar Dynamics Observatory, and the images are nothing short of stunning. So, the SDO website has started a couple of new image gallery features, which will provide a “best of” weekly fix without overloading your Sun senses (and no sunscreen needed!) The first one is Pick of the Week. The image above is the first “pick” and what a pick it is! This SDO close-up shows a filament and active region on the Sun, taken in extreme UV light on May 18, 2010. It shows a dark and elongated filament hovering above the Sun’s surface, with bright regions beneath it. The filaments are cooler clouds of gas that are suspended by tenuous magnetic fields that are often unstable and commonly erupt. This one is estimated to be at least 60 Earth diameters long (about 805,000 km, or 500,000 miles). Wowza!
Solar flare on May 17, 2010, as seen by the AIA instrument on SDO. Credit: NASA
Hot Shots will feature some great looking flares. This image from the Atmospheric Imaging Assembly (AIA) instrument shows a solar eruption and a flare. The dark regions show the site of evacuated material from the eruption, and the large magnetic loops were formed during the flare. AIA takes images of the solar atmosphere in multiple wavelengths to study link changes in the surface and how they related to interior changes in the Sun. AIA takes images of the Sun in 10 wavelengths every 10 seconds.
Note: Nancy Atkinson is at Kennedy Space Center to cover SDO and the STS-130 shuttle mission
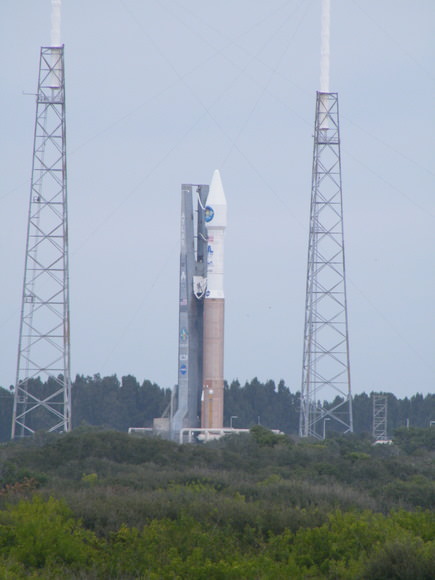
Scrub! High winds kept the Solar Dynamics Observatory on the ground for today, but the launch team will try again Thursday (Feb. 11) at 10:26 a.m. EST (15:26 GMT). Weather is 60% go for tomorrow, and winds will be down to about 16 knots but cloud cover may be an issue. Today, winds consistently peaked well above the constraint speed of 20 knots – often well into the 30’s. The winds here at the press site were equally strong, and combined with cool weather, kept most people indoors until the launch team gave the go-ahead.
Winds were predicted to decrease later in the day, so the launch team pushed back the countdown as far into the launch window as possible. Originally slated for a 10:26 a.m. EST launch, they first moved it ahead 30 minutes to 10:56, and then to 11:26, leaving just the built-in hold at T-4 minutes in the countdown, — and more importantly, leaving only four minutes for a possible attempt. The count was able to pick up when the weather officer gave the go-ahead, but as soon as the countdown restarted, the count was automatically stopped because the wind loads had risen again.
The scrub was a disappointment for the SDO team, which has had repeated delays in their timeline leading up to launch. But now SDO and the Atlas V rocket can launch any day that the weather allows, so we’ll be back again tomorrow for another try!
You can follow my updates on Twitter (@Nancy_A) for live, real-time updates. I’ll also be reporting live Thursday morning on AstronomyFM, a 24-hour internet radio dedicated to astronomy and space exploration.
This great new video (just uploaded today!) does a great job of explaining the upcoming Solar Dynamics Observatory (SDO) mission, which is slated to launch on Feb. 9, 2010. SDO will provide a new eye on the sun that will deliver solar images with 10 times better resolution than high-definition television. This mission will zoom in on the cause of severe space weather—solar activity such as sunspots, solar flares, and coronal mass ejections. It will give us the best look ever at our Sun.


