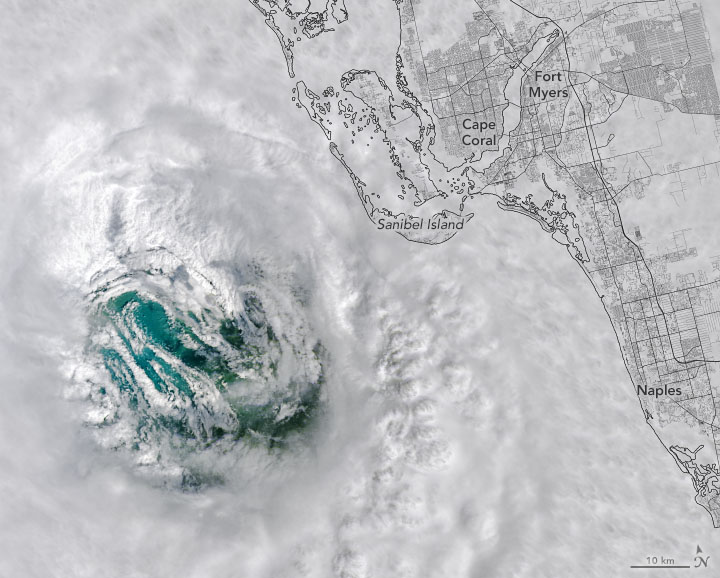
On September 28, the Landsat 8 satellite passed directly over Ian’s eye as the storm approached southwest Florida. Credit: US Geological Survey.
NASA and NOAA satellites — as well as astronauts on the ISS — captured some stunning imagery of Hurricane Ian, as seen from orbit. Our lead image shows an eerie view of the hurricane’s eye on September 28. The Landsat 8 satellite passed directly over Ian’s eye as the storm approached southwest Florida.
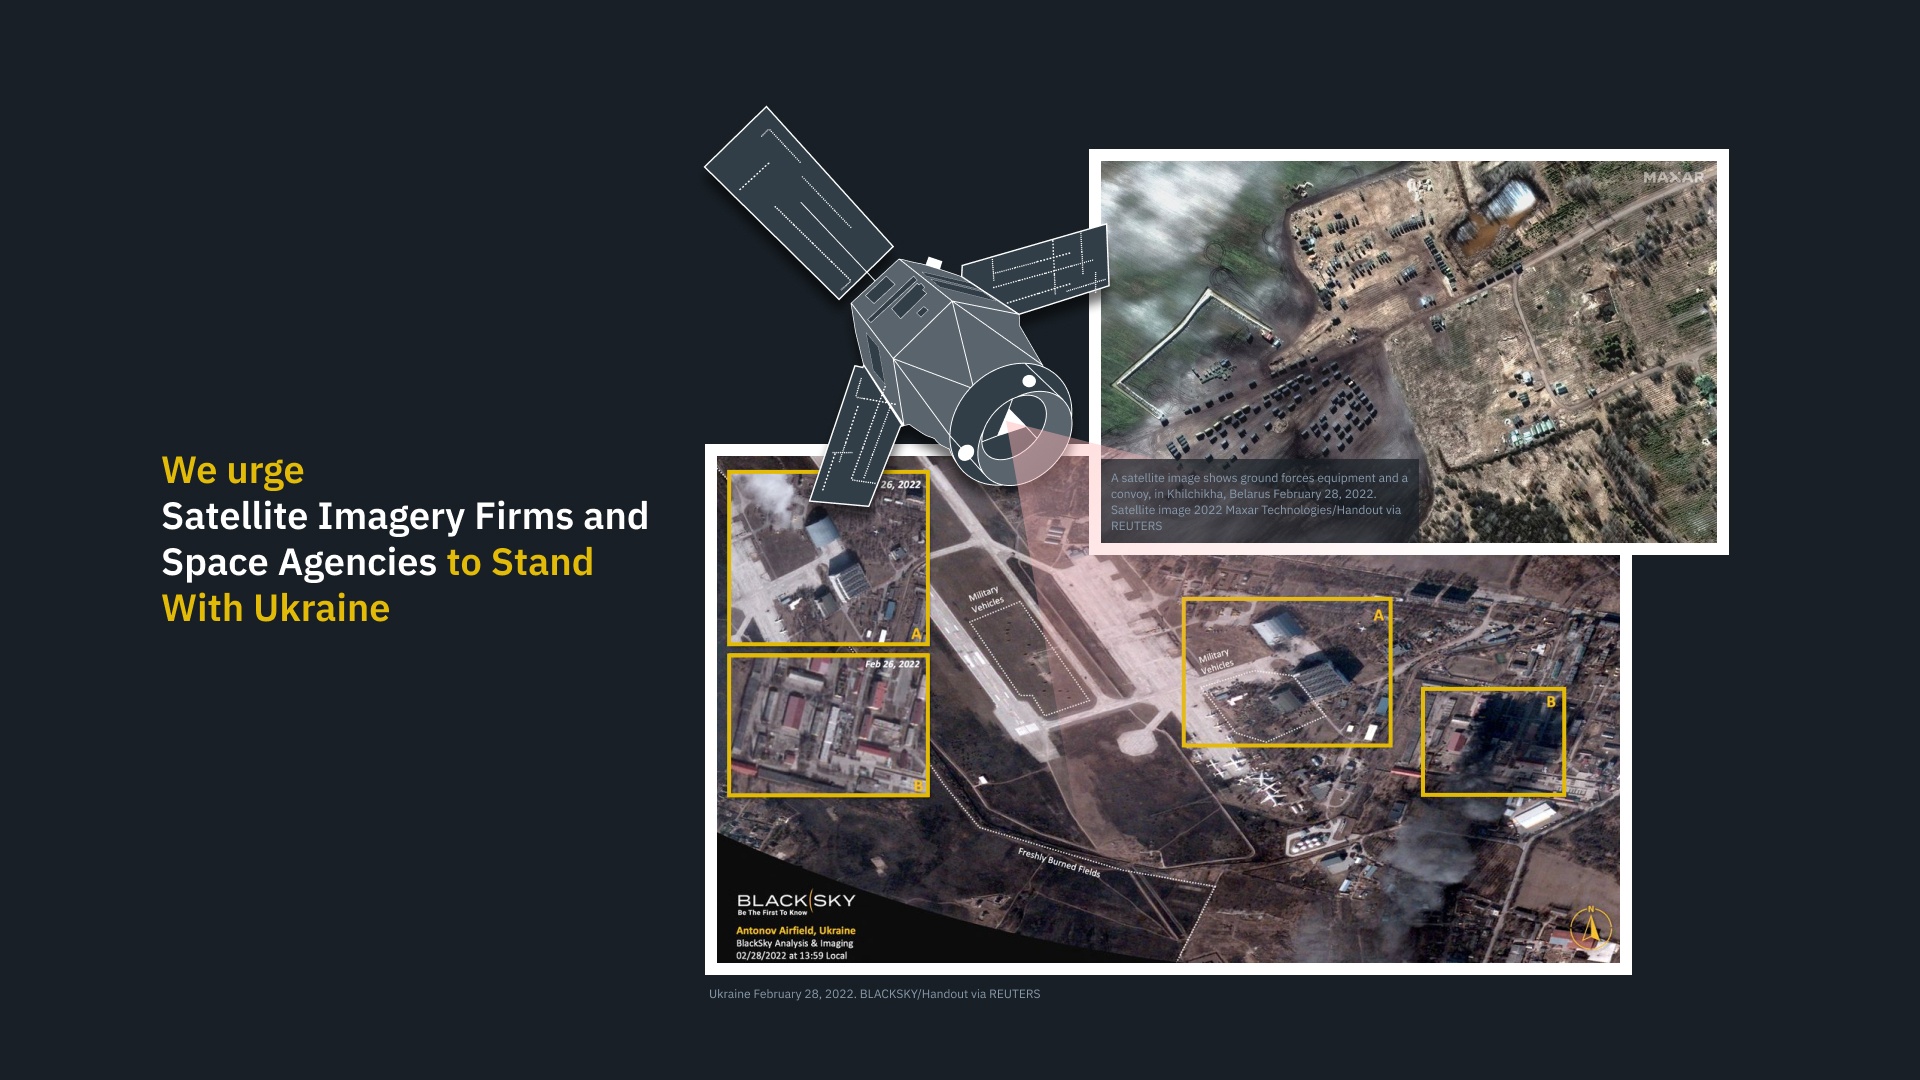
On the morning of February 24th, after years of proxy conflict in the border region, Russia invaded the neighboring country of Ukraine. This invasion was the culmination of eight years of conflict that began with the removal of Ukrainian President Viktor Yanukovych (a long-time ally of Russian President Vladimir Putin) and Russia’s subsequent annexation of Crimea. This invasion has prompted the global community to mobilize and find ways to support Ukraine!
For instance, you have Earth Observatory System Data Analytics (EOSDA), a California-based “all-in-one cloud workspace” for Earth observation solutions. In a recent statement, EOSDA CEO Max Polyakov appealed to satellite imagery firms and space agencies worldwide to share their recent and real-time high-to-medium resolution optical and radar satellite imagery with EOSDA to assist military and humanitarian aid efforts in the region.
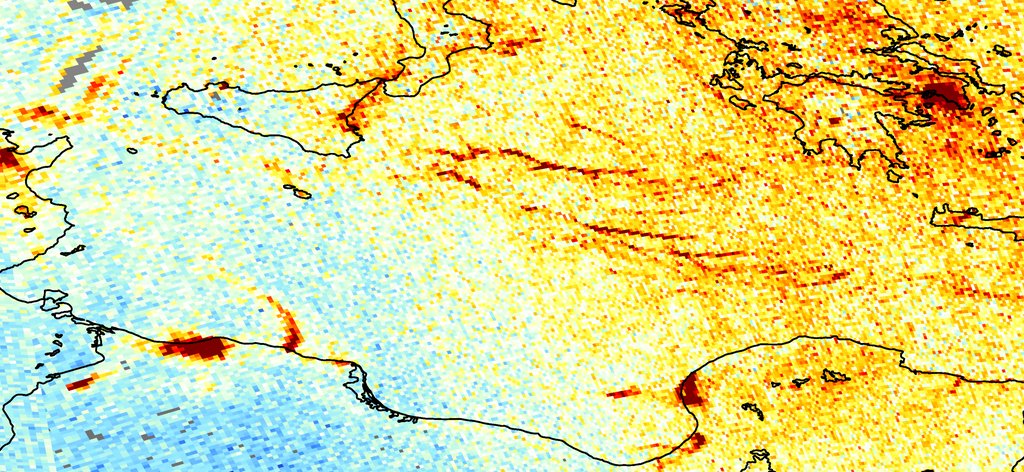
All hands have to be on deck if the world is going to tackle degradation, and one of the biggest emitters is also one of the least well known – international shipping. A 2018 study estimated that pollution emitted from cargo ships resulted in 400,000 annual premature deaths from lung cancer and heart disease. Many of those deaths resulted from the sulfur dioxide the ships were belching into the air. Since the beginning of the year, sulfur dioxide has been capped at .5% of emissions, compared to 3.5% previously. While the long term benefits of that emissions cap will take some time to appear, there’s another pollutant that could potentially be tackled in the near future: nitrogen dioxide.
Nitrogen dioxide (NO2) is one of the emissions from diesel engines, and has been strictly capped in the automotive market for a number of years. While the shipping industry so far has escaped regulation, there is a strong possibility that restrictions may be coming in the near future. Regulations in themselves are great, but they are useless if not enforced, and the open ocean is a notoriously difficult place to enforce them. That difficult task might have just gotten easier, as scientists at the European Space Agency realized they can use satellite data they are already collecting to track the nitrogen dioxide emissions of individual ships on the open ocean.
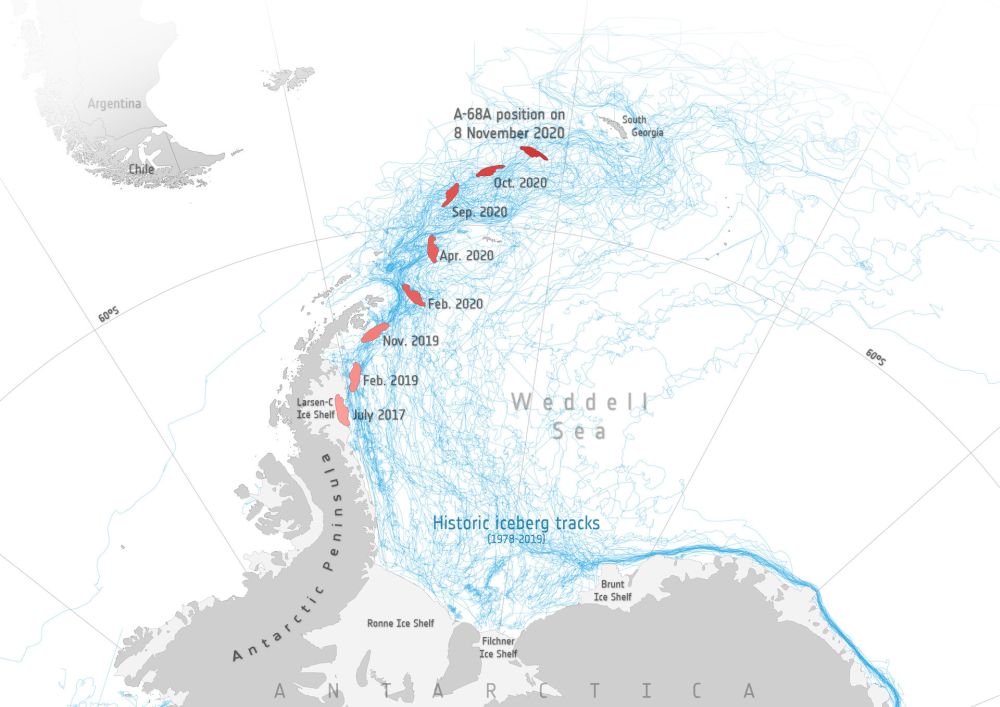
An iceberg the size of South Georgia Island is on a collision course with... South Georgia Island. Image Credit: contains modified Copernicus Sentinel data (2017–20), processed by ESA; Antarctic Iceberg Tracking Database
Back in July 2017, satellites watched as an enormous iceberg broke free from Antarctica’s Larsen C ice shelf on the Antarctic Peninsula. The trillion-ton behemoth has been drifting for over three years now. While it stayed close to its parent ice shelf for the first couple of years, it’s now heading directly for a collision with South Georgia Island.
It could be a slow-motion collision, but a collision nonetheless. If it does collide with the island and its shallow sea-floor, it won’t be the first iceberg to do so. And if the first one was any indication, wildlife could suffer.
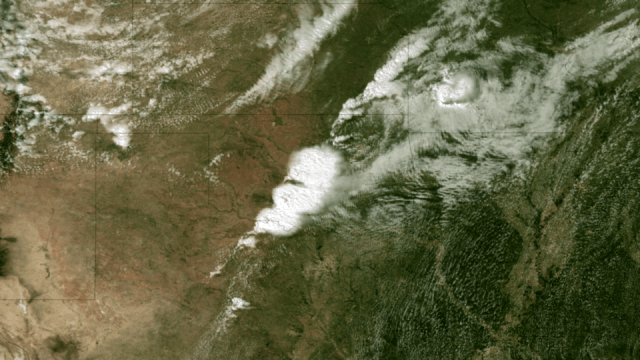
Satellite Image of Oklahoma Tornado. Acquired at 2:55 CT on May 20, 2013, this image from the NOAA GOES-13 satellite shows the storms developing directly over central Oklahoma. One minute later an incredibly destructive tornado touched down in Moore, OK. Credit: NOAA.
The massive tornado that tore through parts of Oklahoma on My 20, 2013 left a 32 km (20-mile) swath of destruction and death, with winds approaching 320 km/hr (200 mph). The US National Weather Service said the 3 km (2-mile)-wide tornado spent 40 minutes on the ground in the area of Moore, Oklahoma, outside of Oklahoma City, destroying schools, a hospital and hundreds of homes, killing dozens of people. Satellite images and video show how the storm developed.
Below is a video showing satellite imagery from the GOES 13 satellite from May 19-20, 2013. It shows the tornado outbreak and supercell thunderstorms that developed across portions of the Great Plains:
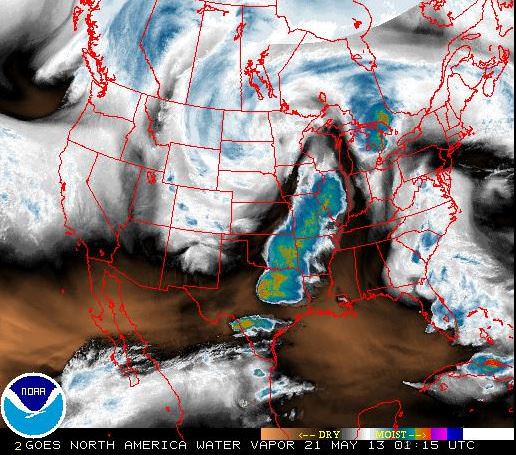
Weather satellites help scientists to observe weather patterns from the unique vantage point of space. This provides the ability to see a larger area of the Earth rather than with conventional radar which does not reveal a true overview of cloud structure and wind patterns.
These satellites can measure many different things, such as in the image below, which looks at water vapor content of the clouds. The satellites operated by NASA and NOAA and are equipped to send back images in infrared and other wavelengths, providing snapshots of things like the water vapor measurements, temperatures, wind patterns, cloud coverage, storm movement and many other readings. This information also helps with the prediction of storms, allowing for warnings for people to seek shelter from potentially destructive weather events.
This screenshot shows a false color view of the water vapor content in the clouds during the tornado outbreak in Oklahoma on May 20, 2013, as seen from NOAA geostationary (GOES) satellites. Click on image to go to current NOAA imagery.
The news from Oklahoma is ongoing, and we encourage you to keep current on the latest information from other news sites. But as Phil Plait pointed out, if you are interested in helping the people involved in this tragedy, the Take Part website has a list of organizations that are in the area providing support.
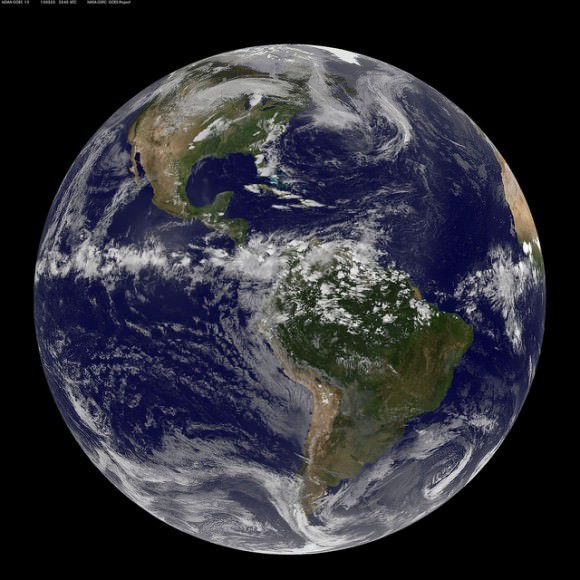
This full-disk view of Earth shows the formation of the Oklahoma tornado, from the Aqua satellite. Credit: NASA Goddard Space Flight Center.
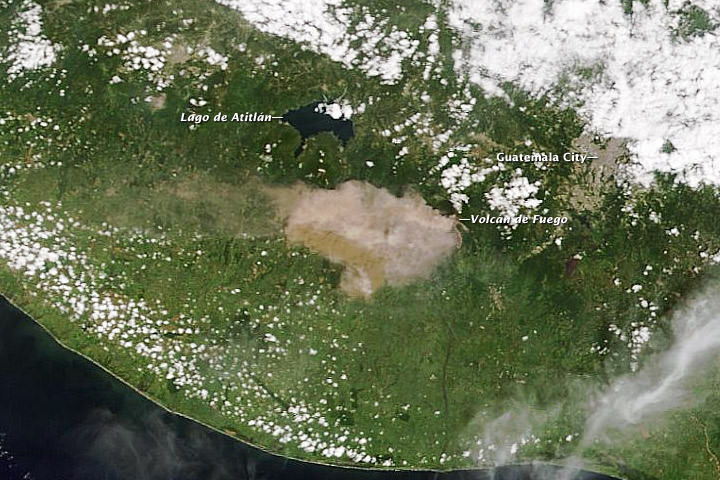
A natural-color image captured the eruption of Volcan de Fuego as it occurred. Credit: NASA/Moderate Resolution Imaging Spectroradiometer (MODIS) aboard the Terra satellite.
One of Central American’s most active volcanos erupted on September 13th, 2012 prompting officials to evacuate 35,000 residents in Guatemala. The Volcan de Fuego, or Fire Volcano, began belching out ash at 10 a.m. local time with ash now falling up to 40 kilometers (25 miles) from the volcano. Residents within 20 kilometers (12 miles) of the volcano were being removed from the area in buses and cars.
According to the Coordinadora Nacional para la Reducción de Desastres (CONRED), the eruption included ash emissions to the west and a 500-meter (2,000-foot) long lava flow. CONRED also warned of pyroclastic flows that could descend the mountain in any direction.
This natural-color image captured the eruption just as it occurred, NASA said. The image was acquired by the Moderate Resolution Imaging Spectroradiometer (MODIS) aboard the Terra satellite.
Thursday’s eruption was the sixth of the year for this volcano and some officials said it may be the biggest.
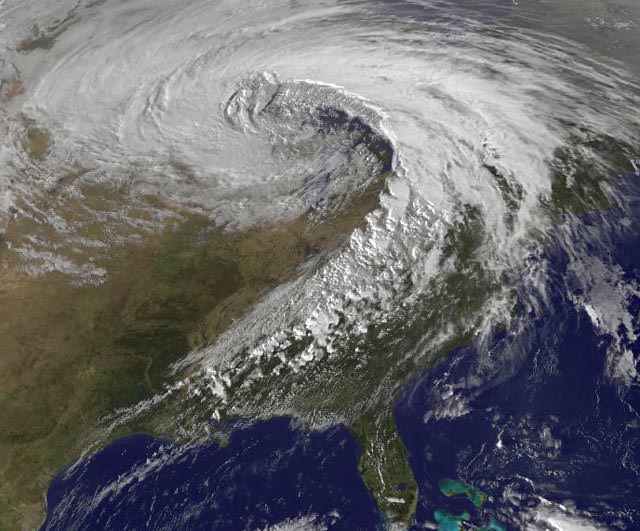
Visible satellite image of the October 26, 2010 superstorm taken at 5:32pm EDT. Image credit: NASA/GSFC.
[/caption]
Yowza! – Here’s a satellite image of a storm of record-breaking proportions. On October 26, 2010, the strongest storm ever recorded in the Midwest spawned 24 tornadoes, 282 reports of damaging winds, violent thunderstorms, and torrential rains. The mega-storm reached peak intensity late yesterday afternoon over Minnesota, resulting in the lowest barometric pressure readings ever recorded in the continental United States (except for from hurricanes and nor’easters affecting the Atlantic seaboard.) The storm continues today (Oct. 27) with more tornado watches posted for Mississippi, Alabama, and Georgia, a blizzard warning for North Dakota, high wind warnings for most of the upper Midwest, and near-hurricane force winds on Lake Superior.
Read more about this super-storm on Weather Underground, but see below for what extremely low air pressure means.
Air pressure is one of the most important factors which determines what the weather is like. A mass of low pressure is an area of air that is rising. As it rises, it expands and cools. Cooler air cannot hold as much water as warmer air, so as the air rises the water will condense and form clouds. This is why an area of low pressure will often be accompanied by clouds and rain — which is what occurred on October 26 — lots of clouds and lots of rain and even snow.
But winds were even a bigger factor in this superstorm. Our atmosphere really doesn’t like big differences in air pressure, so where areas of low pressure meet up with areas of high pressure, winds blow in an attempt to combat the differences in the air pressure. The larger the difference in pressure the stronger the winds will blow. So, the extreme low pressure readings yesterday meant the winds were really howling — and they were. In my neighborhood in Illinois, we had a fairly study flagpole get bent from the winds. But that was nothing compared to the hurricane-like winds other places experienced: for example, Grand Marais, Minnesota — near the Great Lakes and near the area of the lowest air pressure readings — had sustained winds of 43 mph gusting to 59 mph, lasting for over 7 hours. Today, that region is still getting pummeled by winds and snow.
You can see the link to Weather Underground above to see what other weather extremes were experienced during this storm.
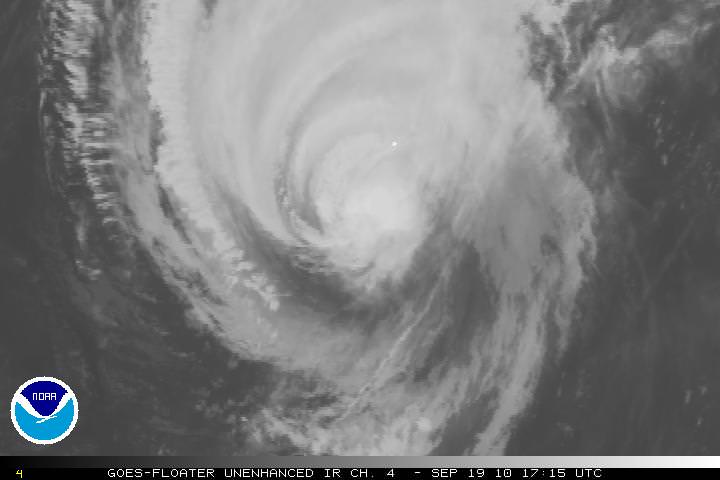
Hurrican Igor as seen by one of the GOES satellites, taken on Sept. 19, 2010 at 17:15 UTC. Credit: NOAA
[/caption]
The massive Hurricane Igor is now a Category One storm, with maximum sustained wind speeds of 140 km per hour, (85 miles per hour). As of this writing at 2:30 EDT, it looks as if it is on a direct collision course with Bermuda and is about 220 km (135 miles) southwest of Bermuda. The intensity of the storm has decreased over the past few days, but the size and rotation of the Igor means that Bermuda will be hit repeatedly as the arms of the hurricane spin over the 54 square kilometer (21 sq mi) island nation. In the satellite image above, Bermuda is the small white dot near the center of the image.
Projected track of Hurricane Igor. Credit: NOAA
Damaging sustained winds of hurricane force will reach the Bermuda late Sunday afternoon, and they will continue into early Monday morning. Wind gusts are predicted to be near or just over 160 km/hour (100 mph) as Igor makes its closest approach to Bermuda. Here’s a link to even more hurricane images.
The hurricane threatens to leave widespread tree damage and power outages in its wake. Some structures will also sustain damage; but fortunately, many buildings on Bermuda are made of stone with foundations into bedrock.
Flooding is also a serious concern across Bermuda. Igor will not only drop 4 to 8 inches of rain but will also trigger a 6- to 10-foot storm surge. Worsening the situation is the fact that waves pounding Bermuda will rise to heights in excess of 40 feet into this evening.
The massive size of Igor will cause the hurricane to keep battering the island well into Monday afternoon.
This 3-D image of Igor's cloud heights and rainfall from NASA TRMM satellite. Credit: Credit: NASA/SSAI, Hal Pierce
This 3-D image of Igor’s cloud heights and rainfall from NASA TRMM data shows a large area of heavy rainfall (falling at about 2 inches per hour) shown here in red on Sept. 15 at 0353 UTC. The yellow and green areas indicate moderate rainfall between .78 to 1.57 inches per hour. The image reveals that Igor’s eye was still very distinct but the southwestern portion of the eye wall had eroded.