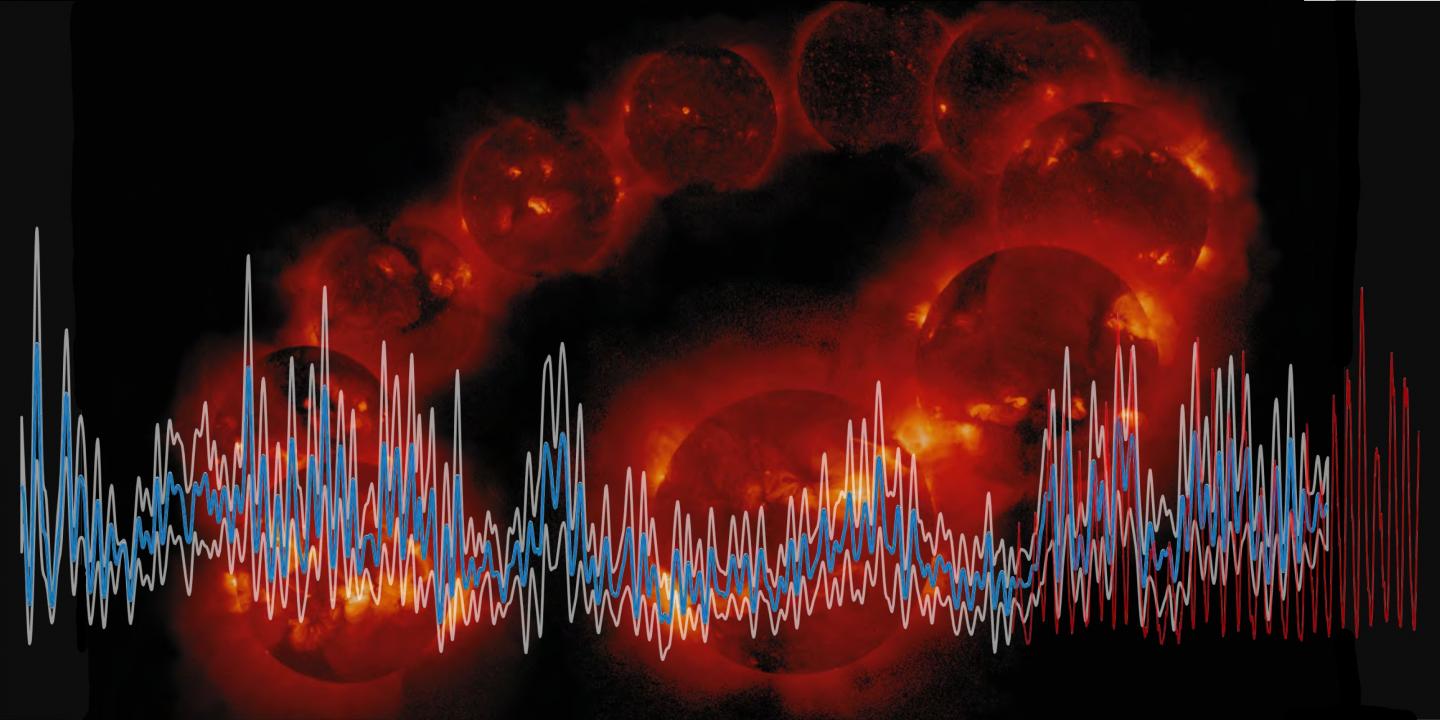
Solar activity over the last 1000 years (blue, with error interval in white), sunspot records (red curve) going back less than 400 years. The background shows a typical eleven-?year cycle of the sun.
CREDIT
ETH Zürich
The Sun has a lot of rhythm and goes through different cycles of activity. The most well-known cycle might be the Schwabe cycle, which has an 11-year cadence. But what about cycles with much longer time scales? How can scientists understand them?
As it turns out, the Sun has left some hidden clues in tree rings.
People always want to know how old everything is. And more specifically, they want to know how we know how old everything is. Well, here at Astronomy Cast, it’s our job to tell you now only what we know, but how we know what we know. And today we’ll begin a series on how we know how old everything is.
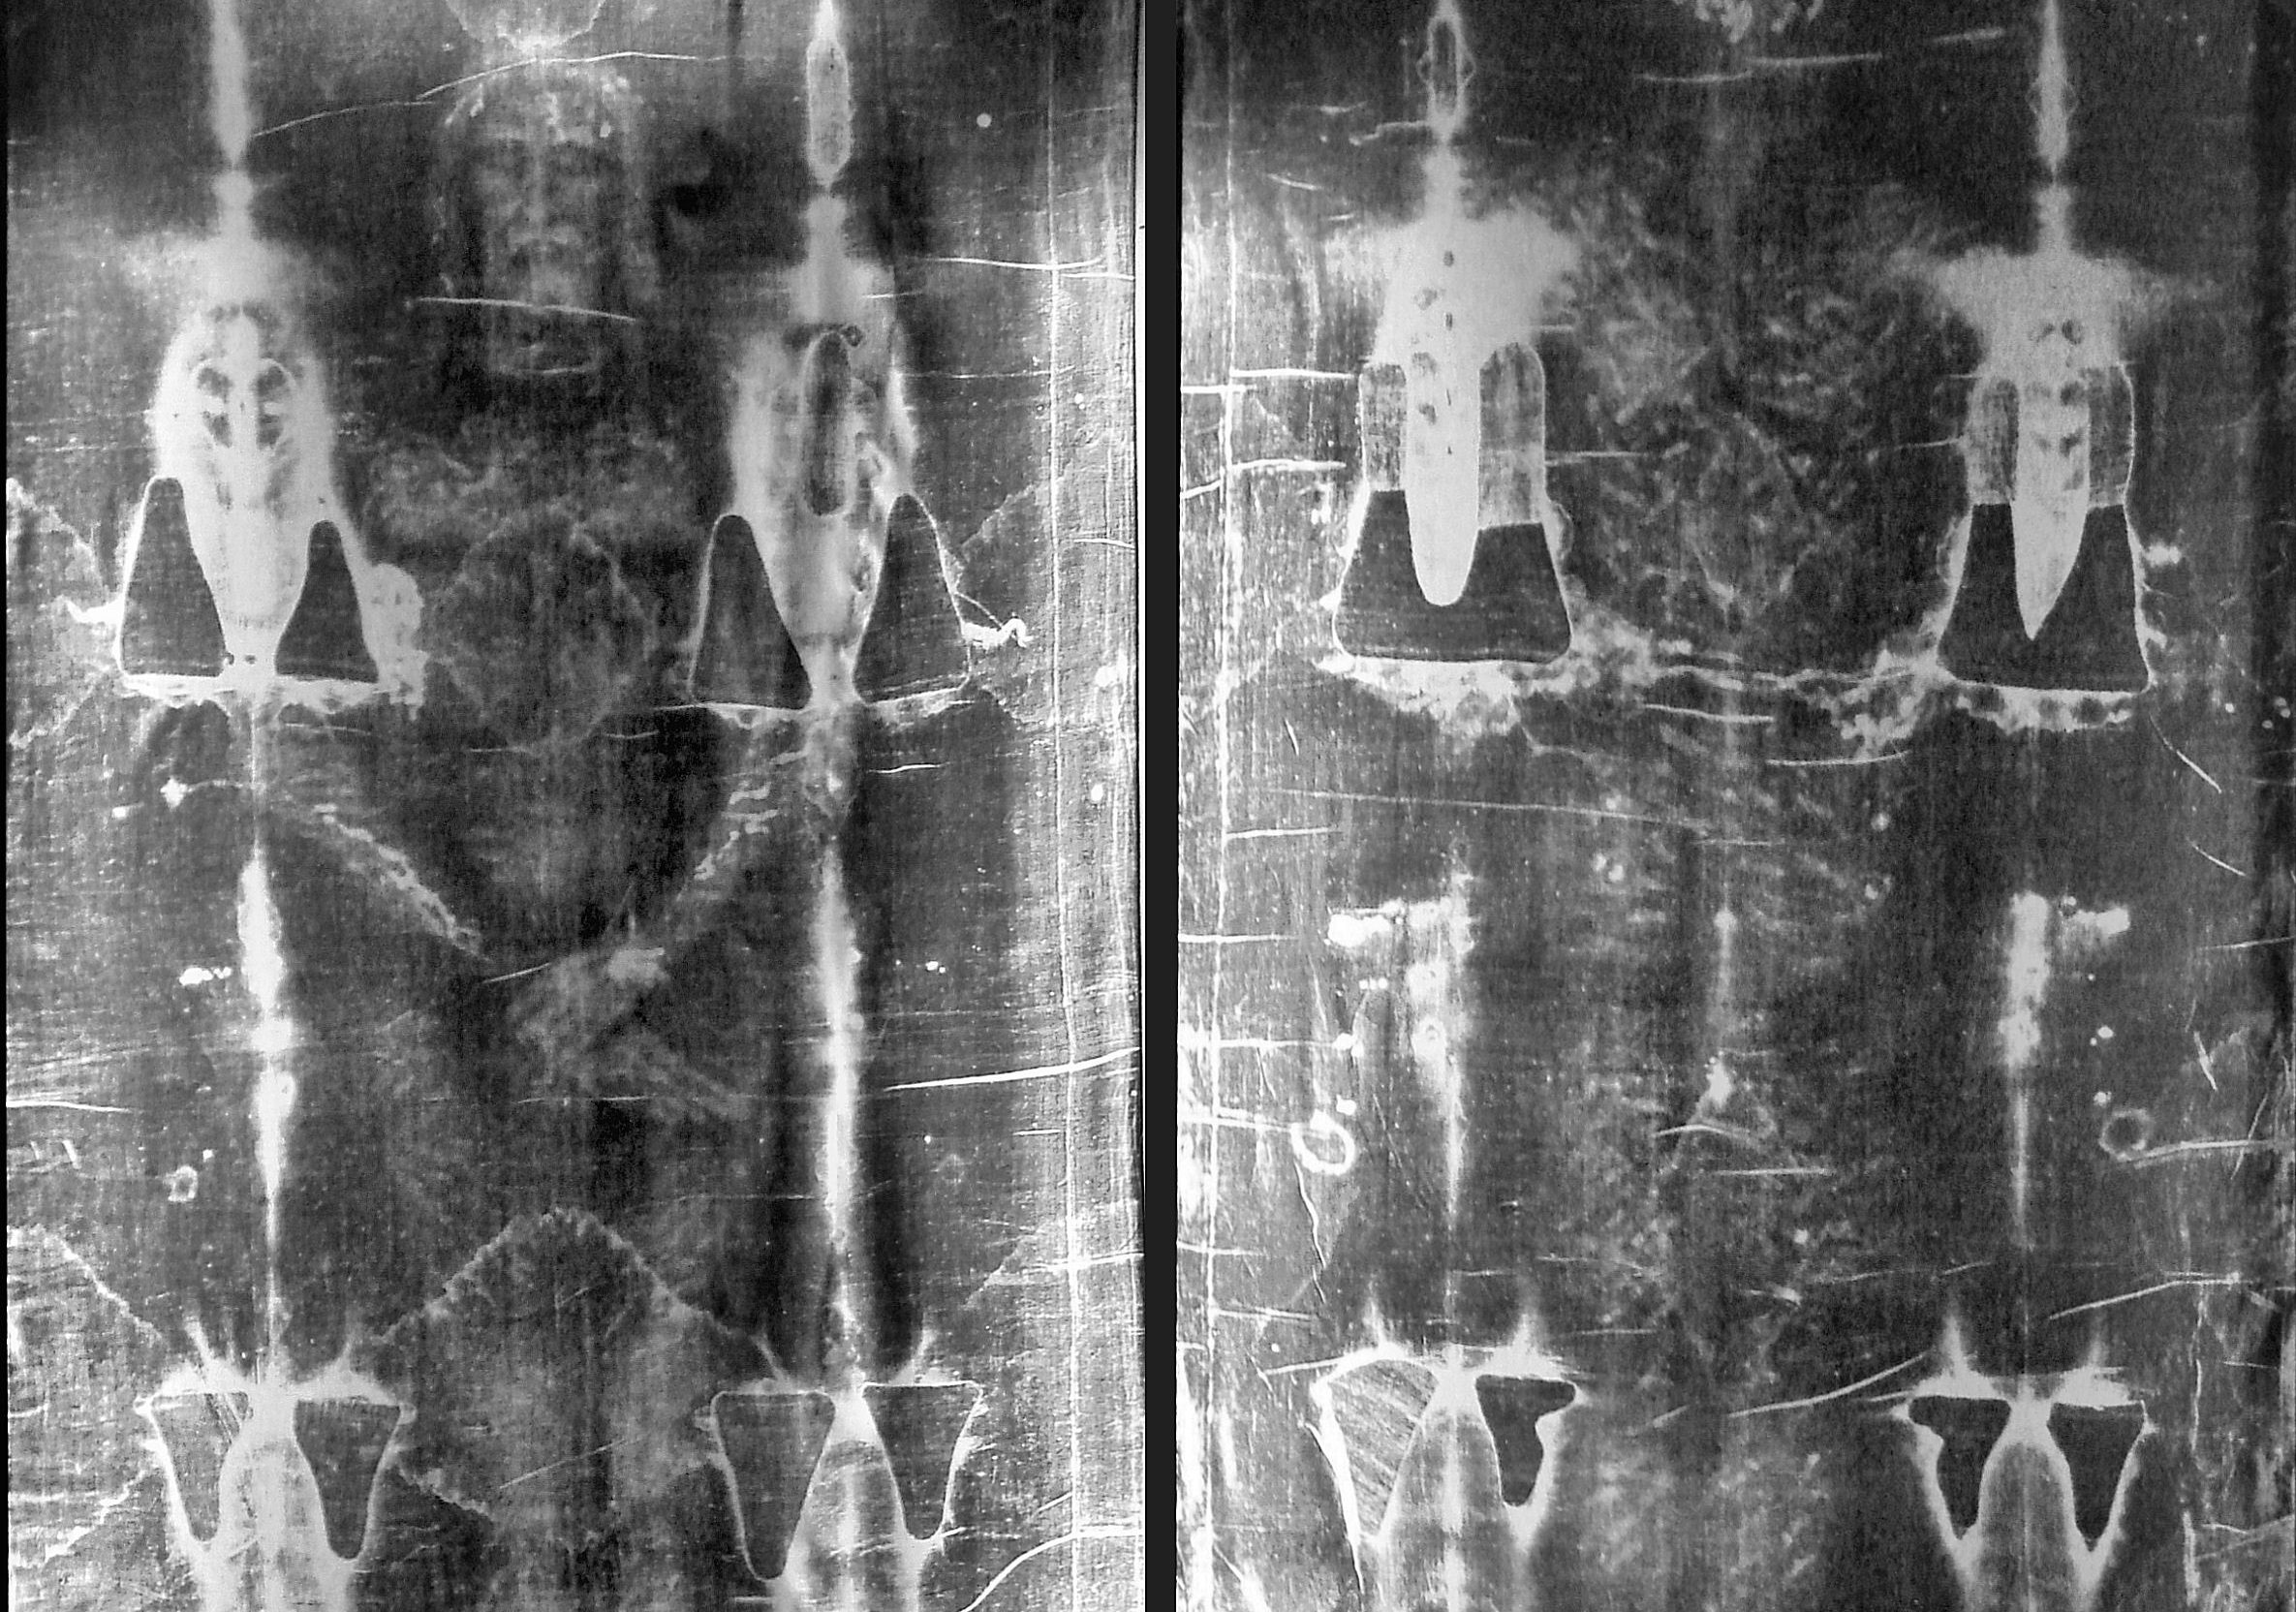
Full length negatives of the shroud of Turin. Radiocarbon dating allowed for its true age to be determined. Credit: Wikipedia Commons
Here on Earth, Carbon is found in the atmosphere, the soil, the oceans, and in every living creature. Carbon 12 – aka. C-12, so-named because it has an atomic weight of 12 – is the most common isotope, but it is by no means the only one. Carbon 14 is another, an isotope of carbon that is produced when Nitrogen (N-14) is bombarded by cosmic radiation.
This process causes a proton to be displaced by a neutron, effectively turning atoms of Nitrogen it into an isotope of carbon – known as”radiocarbon”. It is naturally radioactive and unstable, and will therefore spontaneously decay back into N-14 over a period of time. This property makes it especially useful in a process known as “radiocarbon dating”, or carbon dating for short.
Origin of Radiocarbon:
Radiocarbon enters the biosphere through natural processes like eating and breathing. Plants and animals absorb both C-12 and C-14 in the course of their natural lifetimes simply by carrying out these basic functions. When they die, they cease to consume them, and the isotope of C-14 begins to revert back to its Nitrogen state at an exponential rate due to its radioactive decay.
Comparing the remaining C-14 of a sample to that expected from atmospheric C-14 allows the age of the sample to be estimated. In addition, scientists know that the half-life of radiocarbon is 5,730 years. This means that it takes a sample of radiocarbon 5,730 years for half of it to decay back into nitrogen.
After about 10 half-lives, the amount of radiocarbon left becomes too minuscule to measure and so this technique isn’t particularly reliable for dating specimens which died more than 60,000 years ago – i.e. during the late Middle Paleolithic (aka. Old Stone Age) period.
History of Development:
Experiments that would eventually lead to carbon dating began in the 1939s, thanks to the efforts of the Radiation Laboratory at the University of California, Berkeley. At the time, researchers were attempting to determine if any of the elements common to organic matter had isotopes with half-lives long enough to be of value in biomedical research.
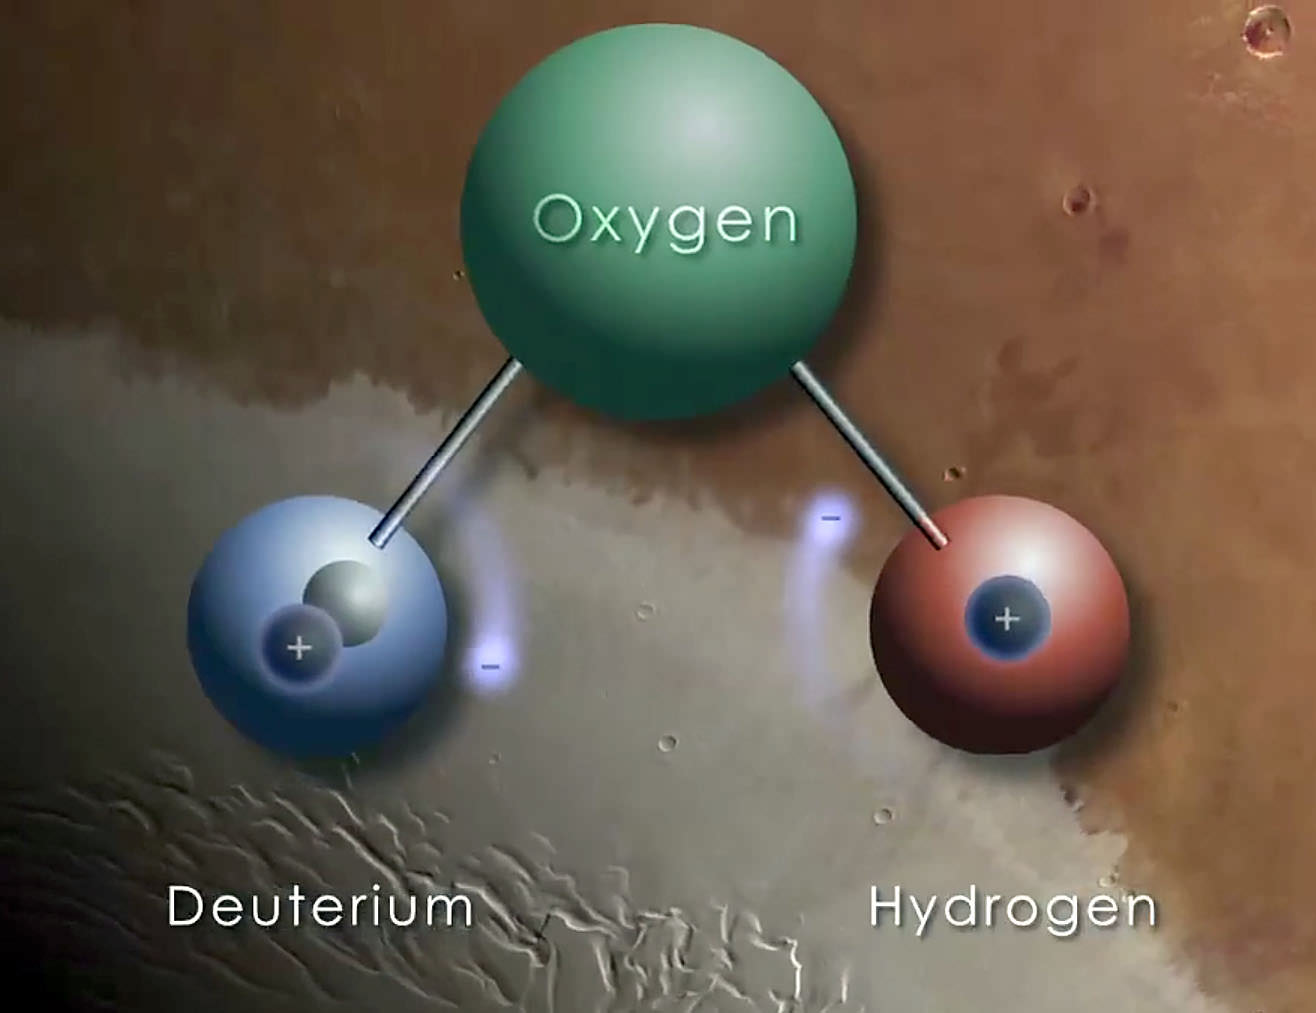
By 1940, the half-life of Carbon 14 was determined, as was the mechanism through which it was created (slow neutrons interacting with Nitrogen in the atmosphere). This contradicted previous work, which held that it was the product of deuterium (H², or heavy hydrogen) and Carbon 13.
A hydrogen atom is made up of one proton and one electron, but its heavy form, called deuterium, also contains a neutron. Credit: NASA/GFSC
During World War II, Willard Libby – a chemist and graduate of Berkeley – read a paper by W. E. Danforth and S. A. Korff (published in 1939) which predicted that C 14 would be created in the atmosphere due to interactions between nitrogen and cosmic rays. From this, Libby came up with the idea of measuring the decay of C 14 as a method of dating organic material.
In 1945, Libby moved to the University of Chicago, where he began the work that would lead to the development of radiocarbon dating. In 1946, he published a paper in which he speculated that C 14 might exist within organic material alongside other carbon isotopes.
After conducting experiments, which measured C-14 in methane derived from sewage samples, Libby and his colleagues were able to demonstrate that organic matter contained radioactive C-14. This was followed by experiments involving wood samples for the tombs of two Egyptian kings, for which the age was known.
Their results proved accurate, with allowances for a small margin of error, and were published in 1949 in the journal Science. In 1960, Libby received the Nobel Prize in Chemistry for this work. Since that time, carbon dating has been used in multiple fields of science, and allowed for key transitions in prehistory to be dated.
Diagram showing how radiocarbon dating works. Credit: howstuffworks.com
Limits of Carbon Dating:
Carbon dating remains limited for a number of reasons. First, there is the assumption that the ratio of C-12 to C-14 in the atmosphere has remained constant, when in fact, the ratio can be affected by a number of factors. For instance, C-14 production rates in the atmosphere, which in turn are affected by the amount of cosmic rays penetrating the Earth’s atmosphere.
This is itself affected by things like the Earth’s magnetic field, which deflects cosmic rays. Furthermore, precise measurements taken over the last 140 years have shown a steady decay in the strength of the Earth’s magnetic field. This means there’s been a steady increase in radiocarbon production (which would increase the ratio).
Another limitation is that this technique can only be applied to organic material such as bone, flesh, or wood, and can’t be used to date rocks directly. On top of that, the addition of Carbon 12 will throw off the ration, thus leading to inaccurate assessments of a sample’s age.
This is where anthropogenic factors come into play. Since fossil fuels have no Carbon 14 content, the burning of gasoline, oil, and other hydrocarbons – and in greater and greater quantity over the course of the past century and a half – has diluted the C-14 content of the atmosphere.
On the other hand, atmospheric testing of nuclear weapons during the 1950s and 1960s is likely to have increased the Carbon 14 content of the atmosphere. In fact, research has been conducted which suggests that nuclear tests may have doubled the concentration of C-14 in this time, compared to natural production by cosmic rays.
Nevertheless, it remains the most accurate means of dating the scientific community has discovered so far. Until such time that another method becomes available – and one that produces smaller margins of error – it will remain the method of choice for archeology, paleontology, and other branches of scientific research.
Gifford Miller collects vegetation samples on Baffin Island. (Photo courtesy University of Colorado Boulder.)
[/caption]
In a study led by the University of Colorado Boulder with co-authors at the National Center for Atmospheric Research (NCAR) and other organizations, researchers may have possibly found evidence the “Little Ice Age” may have had ties to an unusual era of volcanic activity… one that lasted for about 50 years. In just five decades, four massive tropical volcanic eruptions managed to take Earth’s entire environment and put it on ice. Somewhere near the years between 1275 and 1300 A.D., these eruptions caused some very cool summer weather in the northern hemisphere which triggered an expansion of sea ice that – in turn – weakened Atlantic currents. However, it didn’t weaken the already cool climate. It strengthened it.
The international study was done in layers – like a good cake – but instead of sweet frosting, it was a composite look at dead vegetation, ice and sediment core data. By engaging highly detailed computer climate modeling, scientists are now able to have a strong theory of what triggered the Little Ice Age.. a theory which begins with decreased summer solar radiation and progresses through erupting volcanoes. Here planet-wide cooling could have been started by sulfates and other aerosols being ejected into our atmosphere and reflecting sunlight back into space. Simulations have shown it could have even been a combination of both scenarios.
“This is the first time anyone has clearly identified the specific onset of the cold times marking the start of the Little Ice Age,” says lead author Gifford Miller of the University of Colorado Boulder. “We also have provided an understandable climate feedback system that explains how this cold period could be sustained for a long period of time. If the climate system is hit again and again by cold conditions over a relatively short period—in this case, from volcanic eruptions—there appears to be a cumulative cooling effect.”
“Our simulations showed that the volcanic eruptions may have had a profound cooling effect,” says NCAR scientist Bette Otto-Bliesner, a co-author of the study. “The eruptions could have triggered a chain reaction, affecting sea ice and ocean currents in a way that lowered temperatures for centuries.” The team’s research papers will be published this week in Geophysical Research Letters. Members of the group include co-authors from the University of Iceland, the University of California Irvine, and the University of Edinburgh in Scotland. The study was funded in part by the National Science Foundation, NCAR’s sponsor, and the Icelandic Science Foundation.
“Scientific estimates regarding the onset of the Little Ice Age range from the 13th century to the 16th century, but there is little consensus,” Miller says. It’s fairly clear these lower temperatures had an impact on more southerly regions such as South American and China, but the effect was far more clear in areas such as northern Europe. Glacial movement eradicated populated regions and historical images show people ice skating in places known to be too warm for such solid freezing activities before the Little Ice Age.
“The dominant way scientists have defined the Little Ice Age is by the expansion of big valley glaciers in the Alps and in Norway,” says Miller, a fellow at CU’s Institute of Arctic and Alpine Research. “But the time in which European glaciers advanced far enough to demolish villages would have been long after the onset of the cold period.”
By employing the technique of radiocarbon dating, approximately 150 plant specimens, complete with roots, were gathered from the receding edges of ice caps located on Baffin Island in the Canadian Artic. In these samples they found evidence of a “kill date” which ranged between 1275 and 1300 A.D. This information led the team to surmise the plants were quickly frozen and then just as quickly encased in solid ice. A second documented kill date occurred about 1450 A.D. showing another major event. To further flesh out their findings, the research team took sediment sample cores from a glacial lake which is linked to the mile-high Langikull ice cap. These important samples from Iceland can be reliably dated back as far as 1,000 years and the results showed a sudden increase in ice during the late 13th century and again in the 15th. Thanks to these techniques which rely on the presence tephra deposits, we know these climate cooling events occurred as a result of volcanic eruptions.
“That showed us the signal we got from Baffin Island was not just a local signal, it was a North Atlantic signal,” Miller says. “This gave us a great deal more confidence that there was a major perturbation to the Northern Hemisphere climate near the end of the 13th century.”
What brought the team to their final conclusions? Through the use of the Community Climate System Model developed by scientists at NCAR and the Department of Energy with colleagues at other organizations, they were able to simulate the impact of volcanic cooling on the extent and mass of Artic sea ice. The model painted a portrait of what could have occurred from about 1150 to 1700 A.D. and showed that some large scale eruptions could have impacted the northern hemisphere if they happened within a close time frame. In this scenario, the long term cooling effect could have expanded the Artic Sea ice to the point where it eventually met – and melted – in the North Atlantic. During the modeling, the solar radiation was set at a constant to show ” the Little Ice Age likely would have occurred without decreased summer solar radiation at the time.” concluded Miller.