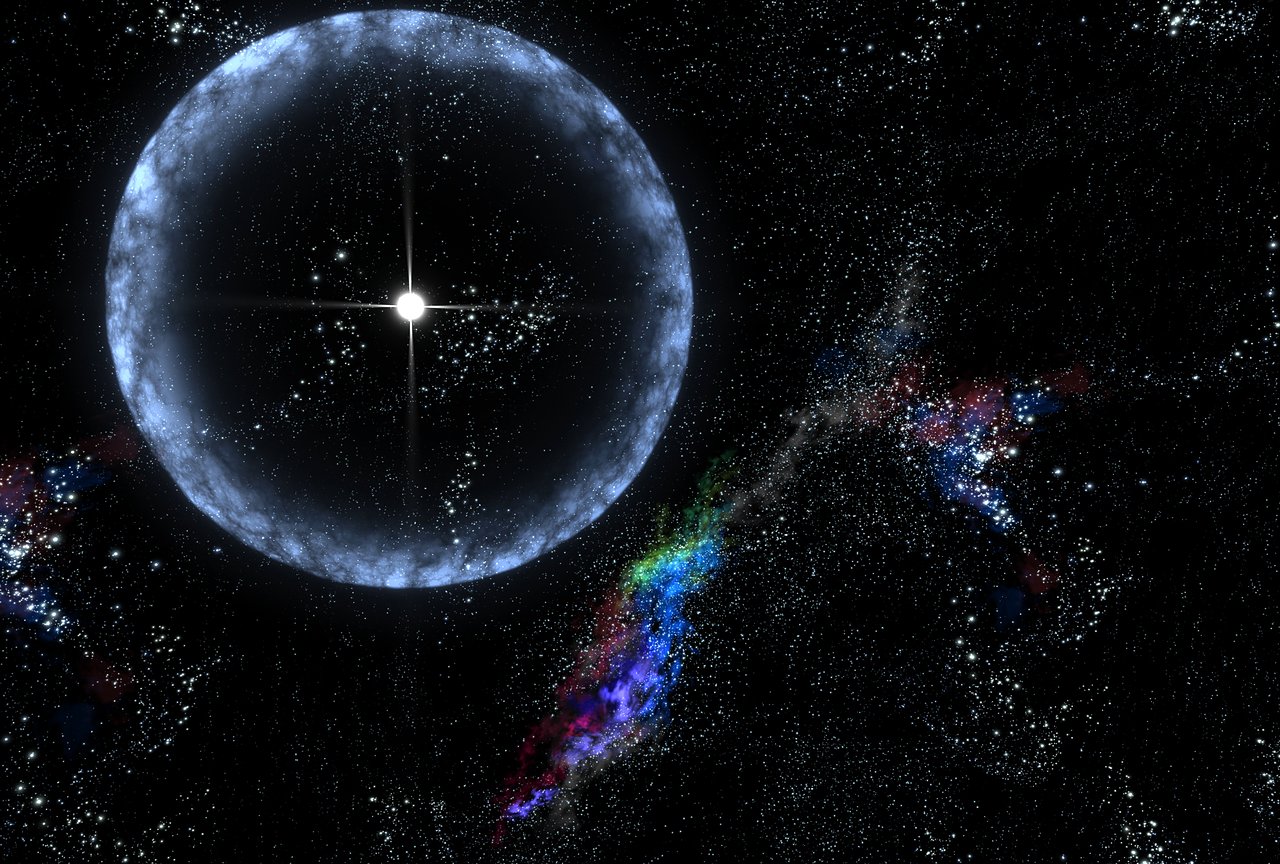
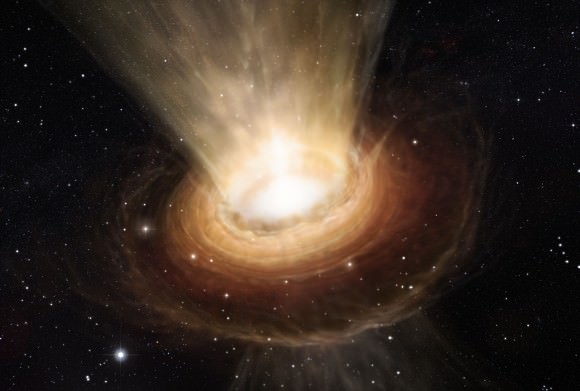
Artist view of a supernova explosion. Credit: NASA
In 2011, the Nobel Prize in physics was awarded to Perlmutter, Schmidt, and Reiss for their discovery that the universe is not just expanding, it is accelerating. The work supported the idea of a universe filled with dark energy and dark matter, and it was based on observations of distant supernovae. Particularly, Type Ia supernovae, which have consistent light curves we can use as standard candles to measure cosmic distances. Now a new study of more than 1,500 supernovae confirms dark energy and dark matter, but also raises questions about our cosmological models.
In honor of Dr. Stephen Hawking, the COSMOS center will be creating the most detailed 3D mapping effort of the Universe to date. Credit: BBC, Illus.: T.Reyes
Back in 1997, a team of leading scientists and cosmologists came together to establish the COSMOS supercomputing center at Cambridge University. Under the auspices of famed physicist Stephen Hawking, this facility and its supercomputer are dedicated to the research of cosmology, astrophysics and particle physics – ultimately, for the purpose of unlocking the deeper mysteries of the Universe.
Yesterday, in what was themed as a “tribute to Stephen Hawking”, the COSMOS center announced that it will be embarking on what is perhaps the boldest experiment in cosmological mapping. Essentially, they intend to create the most detailed 3D map of the early universe to date, plotting the position of billions of cosmic structures including supernovas, black holes, and galaxies.
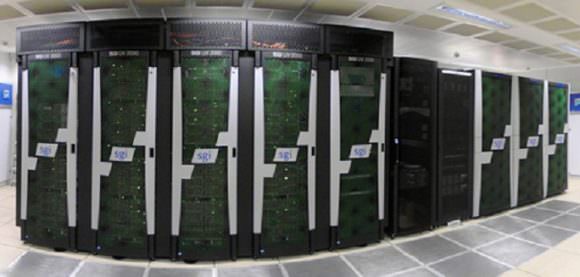
This map will be created using the facility’s supercomputer, located in Cambridge’s Department of Applied Mathematics and Theoretical Physics. Currently, it is the largest shared-memory computer in Europe, boasting 1,856 Intel Xeon E5 processor cores, 31 Intel Many Integrated Core (MIC) co-processors, and 14.5 terabytes of globally shared memory.
The COSMOS IX supercomputer. Credit: cosmos.damtp.cam.ac.uk
The 3D will also rely on data obtained by two previous surveys – the ESA’s Planck satellite and the Dark Energy Survey. From the former, the COSMOS team will use the detailed images of the Cosmic Microwave Background (CMB) – the radiation leftover by the Big Ban – that were released in 2013. These images of the oldest light in the cosmos allowed physicists to refine their estimates for the age of the Universe (13.82 billion years) and its rate of expansion.
This information will be combined with data from the Dark Energy Survey which shows the expansion of the Universe over the course of the last 10 billion years. From all of this, the COSMOS team will compare the early distribution of matter in the Universe with its subsequent expansion to see how the two link up.
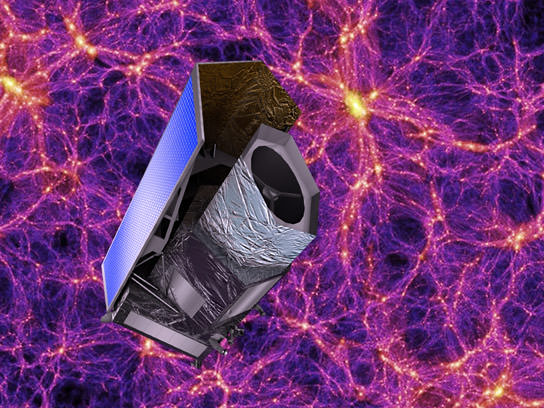
The project is also expected to receive a boost from the deployment of the ESA’s Euclid probe, which is scheduled for launch in 2020. This mission will measure the shapes and redshifts of galaxies (looking 10 billion years into the past), thereby helping scientists to understand the geometry of the “dark Universe” – i.e. how dark matter and dark energy influence it as a whole.
Artist impression of the Euclid probe, which is set to launch in 2020. Credit: ESA
The plans for the COSMOS center’s 3D map are will be unveiled at the Starmus science conference, which will be taking place from July 2nd to 27th, 2016, in Tenerife – the largest of the Canary Islands, located off the coast of Spain. At this conference, Hawking will be discussing the details of the COSMOS project.
In addition to being the man who brought the COSMOS team together, the theme of the project – “Beyond the Horizon – Tribute to Stephen Hawking” – was selected because of Hawking’s long-standing commitment to physics and cosmology. “Hawking is a great theorist but he always wants to test his theories against observations,” said Prof. Shellard in a Cambridge press release. “What will emerge is a 3D map of the universe with the positions of billions of galaxies.”
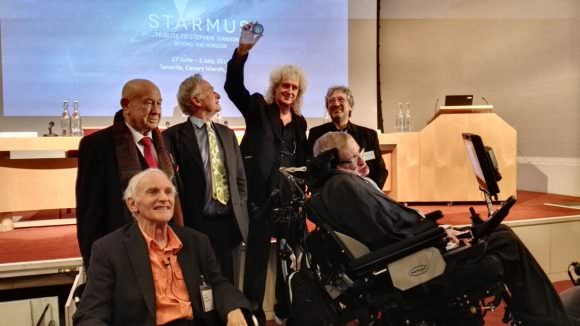
Hawking will also present the first ever Stephen Hawking Medal for Science Communication, an award established by Hawking that will be bestowed on those who help promote science to the public through media – i.e. cinema, music, writing and art. Other speakers who will attending the event include Neil deGrasse Tyson, Chris Hadfield, Martin Rees, Adam Riess, Rusty Schweickart, Eric Betzig, Neil Turok, and Kip Thorne.
Professor Hawking and colleagues from the Royal Society announcing the launch of the Stephen Hawking Medal for Science Communication, Dec. 16th, 2015. Credit: starmus.com
Naturally, it is hoped that the creation of this 3D map will confirm current cosmological theories, which include the current age of the Universe and whether or not the Standard Model of cosmology – aka. the Lambda Cold Dark Matter (CDM) model – is in fact the correct one. As Hawking is surely hoping, this could bring us one step closer to a Theory of Everything!
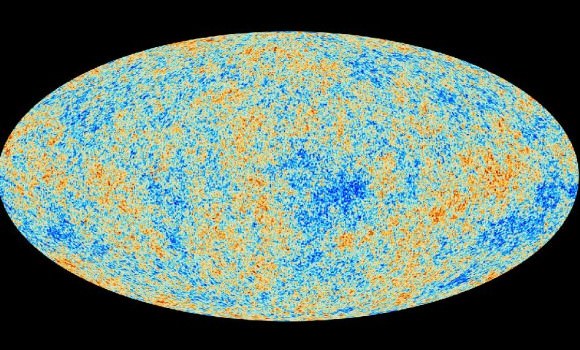
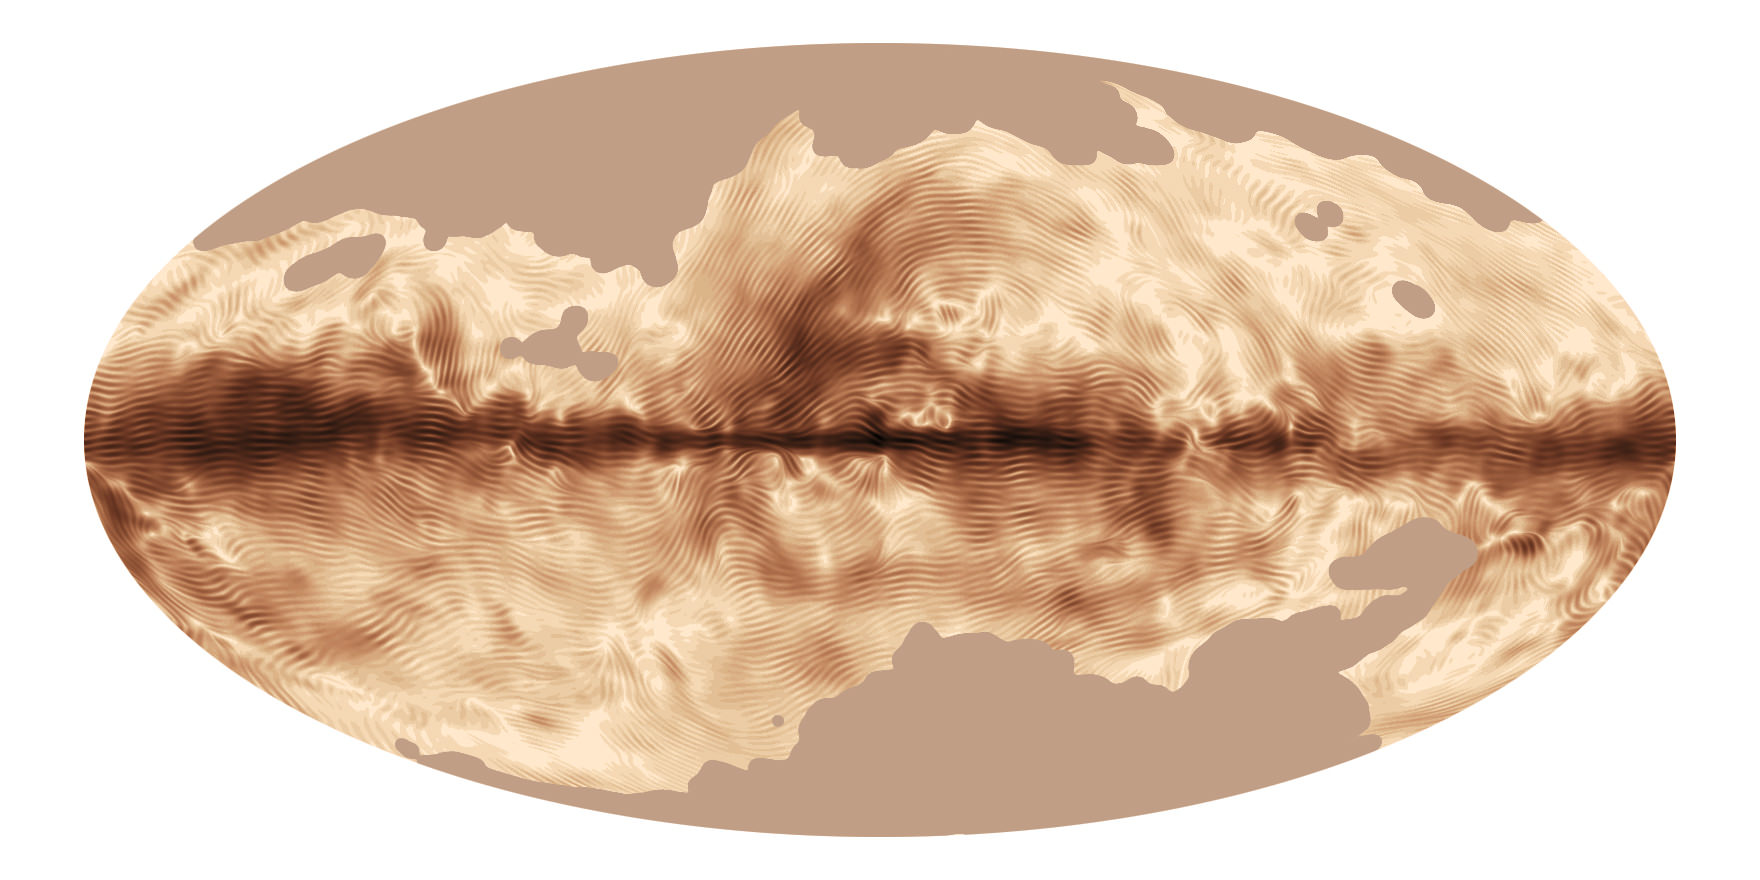
This image, the best map ever of the Universe, shows the oldest light in the universe. This glow, left over from the beginning of the cosmos called the cosmic microwave background, shows tiny changes in temperature represented by color. Credit: ESA and the Planck Collaboration.
The Cosmic Microwave Background (CMB) radiation is one of the greatest discoveries of modern cosmology. Astrophysicist George Smoot once likened its existence to “seeing the face of God.” In recent years, however, scientists have begun to question some of the attributes of the CMB. Peculiar patterns have emerged in the images taken by satellites such as WMAP and Planck – and they aren’t going away. Now, in a paper published in the December 1 issue of The Astronomical Journal, one scientist argues that the existence of these patterns may not only imply new physics, but also a revolution in our understanding of the entire Universe.
Let’s recap. Thanks to a blistering ambient temperature, the early Universe was blanketed in a haze for its first 380,000 years of life. During this time, photons relentlessly bombarded the protons and electrons created in the Big Bang, preventing them from combining to form stable atoms. All of this scattering also caused the photons’ energy to manifest as a diffuse glow. The CMB that cosmologists see today is the relic of this glow, now stretched to longer, microwave wavelengths due to the expansion of the Universe.
As any fan of the WMAP and Planck images will tell you, the hallmarks of the CMB are the so-called anisotropies, small regions of overdensity and underdensity that give the picture its characteristic mottled appearance. These hot and cold spots are thought to be the result of tiny quantum fluctuations born at the beginning of the Universe and magnified exponentially during inflation.
Temperature and polarization around hot and cold spots (Credit: NASA / WMAP Science Team)
Given the type of inflation that cosmologists believe occurred in the very early Universe, the distribution of these anisotropies in the CMB should be random, on the order of a Gaussian field. But both WMAP and Planck have confirmed the existence of certain oddities in the fog: a large “cold spot,” strange alignments in polarity known as quadrupoles and octupoles, and, of course, Stephen Hawking’s initials.
In his new paper, Fulvio Melia of the University of Arizona argues that these types of patterns (Dr. Hawking’s signature notwithstanding) reveal a problem with the standard inflationary picture, or so-called ΛCDM cosmology. According to his calculations, inflation should have left a much more random assortment of anisotropies than the one that scientists see in the WMAP and Planck data. In fact, the probability of these particular anomalies lining up the way they do in the CMB images is only about 0.005% for a ΛCDM Universe.
Melia posits that the anomalous patterns in the CMB can be better explained by a new type of cosmology in which no inflation occurred. He calls this model the R(h)=ct Universe, where c is the speed of light, t is the age of the cosmos, and R(h) is the Hubble radius – the distance beyond which light will never reach Earth. (This equation makes intuitive sense: Light, traveling at light speed (c) for 13.7 billion years (t), should travel an equivalent number of light-years. In fact, current estimates of the Hubble radius put its value at about 13.4 billion light-years, which is remarkably close to the more tightly constrained value of the Universe’s age.)
R(h)=ct holds true for both the standard cosmological scenario and Melia’s model, with one crucial difference: in ΛCDM cosmology, this equation only works for the current age of the Universe. That is, at any time in the distant past or future, the Universe would have obeyed a different law. Scientists explain this odd coincidence by positing that the Universe first underwent inflation, then decelerated, and finally accelerated again to its present rate.
Melia hopes that his model, a Universe that requires no inflation, will provide an alternative explanation that does not rely on such fine-tuning. He calculates that, in a R(h)=ct Universe, the probability of seeing the types of strange patterns that have been observed in the CMB by WMAP and Planck is 7–10%, compared with a figure 1000 times lower for the standard model.
So, could this new way of looking at the cosmos be a death knell for ΛCDM? Probably not. Melia himself cites a few less earth-shattering explanations for the anomalous signals in the CMB, including foreground noise, statistical biases, and instrumental errors. Incidentally, the Planck satellite is scheduled to release its latest image of the CMB this week at a conference in Italy. If these new results show the same patterns of polarity that previous observations did, cosmologists will have to look into each possible explanation, including Melia’s theory, more intensively.
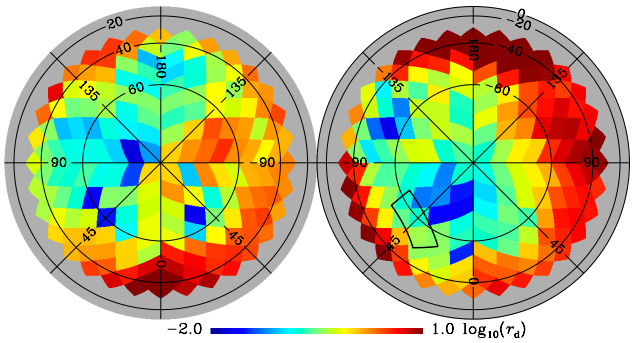
Dust map of the Universe. The region studied by BICEP2 is indicated by the rectangle in the right circle. Credit: Planck Collaboration
One of the recent sagas in cosmology began with the BICEP2 press conference announcing evidence of early cosmic inflation. There was some controversy since the press release was held before the paper was peer reviewed. The results were eventually published in Physical Review Letters, though with a more cautious conclusion than the original press release. Now the Planck team has released more of their data. This new work hasn’t yet been peer reviewed, but it doesn’t look good for BICEP2.
As you might recall, BICEP2 analyzed light from the cosmic microwave background (CMB) looking for a type of pattern known as B-mode polarization. This is a pattern of polarized light that (theoretically) is caused by gravitational waves produced by early cosmic inflation. There’s absolutely no doubt that BICEP2 detected B-mode polarization, but that’s only half the challenge. The other half is proving that the B-mode polarization they saw was due to cosmic inflation, and not due to some other process, mainly dust. And therein lies the problem. Dust is fairly common in the Milky Way, and it can also create B-mode polarization. Because the dust is between us and the CMB, it can contaminate its B-mode signal. This is sometimes referred to as the foreground problem. To really prove you have evidence of B-mode polarization in the CMB, you must ensure that you’ve eliminated any foreground effects from your data.
When the BICEP2 results were first announced, the question of dust was immediately raised. Some researchers noted that dust particles caught in magnetic fields could produce stronger B-mode effects than originally thought. Others pointed out that part of the data BICEP2 used to distinguish foreground dust wasn’t very accurate. This is part of the reason the final results went from “We found inflation!” to “We think we’ve found inflation! (But we can’t be certain.)”
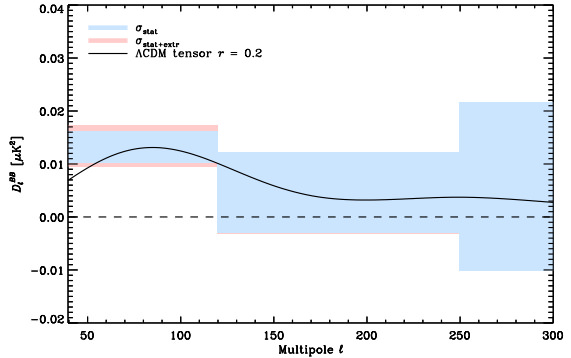
Dust effects seen by Planck (shaded region) compared with inflation results of BICEP2 (solid line). Credit: Planck Collaboration
The new results from Planck chip at that claim even further. Whereas BICEP2 looked at a specific region of the sky, Planck has been gathering data across the entire sky. This means lots more data that can be used to distinguish foreground dust from a CMB signal. This new paper presented a map of the foreground dust, and a good summary can be seen in the figure. The shaded areas represents the B-mode levels due to dust at different scales. The solid line represents the B-mode distribution due to inflation as seen by BICEP2. As you can see, it matches the dust signal really well.
The simple conclusion is that the results of BICEP2 have been shown to be dust, but that isn’t quite accurate. It is possible that BICEP2 has found a mixture of dust and inflation signals, and with a better removal of foreground effects there may still be a real result. It is also possible that it’s all dust.
While this seems like bad news, it actually answers a mystery in the BICEP2 results. The level of inflation claimed by BICEP2 was actually quite large. Much larger than expected than many popular models. The fact that a good chuck of the B-mode polarization is due to dust means that inflation can’t be that large. So small inflation models are back in favor. It should also be emphasized that even if the BICEP2 results are shown to be entirely due to dust, that doesn’t mean inflation doesn’t exist. It would simply mean we have no evidence either way.
It’s tempting to look at all this with a bit of schadenfreude. Har, har, the scientists got it wrong again. But a more accurate view would be of two rival sports teams playing an excellent game. BICEP2 almost scored, but Planck rallied an excellent defense. Both teams want to be the first to score, but the other team won’t let them cheat to win. And we get to watch it happen.
Anyone who says science is boring hasn’t been paying attention.
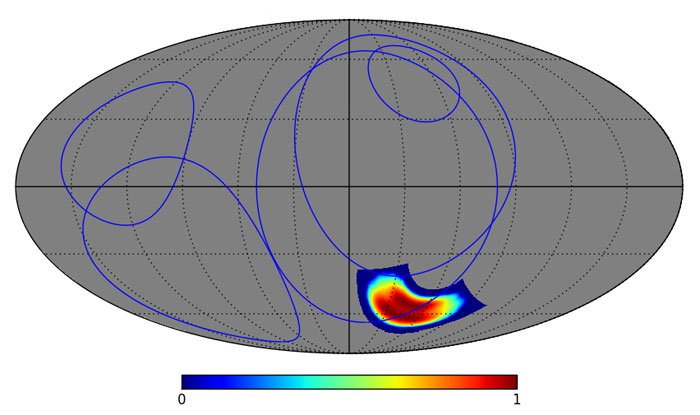
Galactic radio loops, with BICEP2 region indicated. Credit: Philipp Mertsch
Recently rumors have been flying that the BICEP2 results regarding the cosmic inflationary period may be invalid. It all started with a post by Dan Falkowski on his blog Resonaances, where he claimed that the BICEP2 had misinterpreted some data, which rendered their results invalid, or at least questionable. The story was then picked up by Nature’s Blog and elsewhere, which has sparked some heated debate.
So what’s really going on?
For those who might not remember, BICEP2 is a project working to detect polarized light within the cosmic microwave background (CMB). Specifically they were looking for a type of polarization known as B-mode polarization. Detection of B-mode polarization is important because one mechanism for it is cosmic inflation in the early universe, which is exactly what BICEP2 claimed to have evidence of.
Part of the reason BICEP2 got so much press is because B-mode polarization is particularly difficult to detect. It is a small signal, and you have to filter through a great deal of observational data to be sure that your result is valid. But you also have to worry about other sources that look like B-mode polarization, and if you don’t account for them properly, then you could get a “false positive.” That’s where this latest drama arises.
In general this challenge is sometimes called the foreground problem. Basically, the cosmic microwave background is the most distant light we can observe. All the galaxies, dust, interstellar plasma and our own galaxy is between us and the CMB. So to make sure that the data you gather is really from the CMB, you have to account for all the stuff in the way (the foreground). We have ways of doing this, but it is difficult. The big challenge is to account for everything.
A map of foreground polarization from the Milky Way. Credit: ESA and the Planck Collaboration
Soon after the BICEP2 results, another team noted a foreground effect that could effect the BICEP2 results. It involves an effect known as radio loops, where dust particles trapped in interstellar magnetic fields can emit polarized light similar to B-mode polarization. How much of an effect this might have is unclear. Another project being done with the Planck satellite is also looking at this foreground effect, and has released some initial results (seen in the figure), but hasn’t yet released the actual data yet.
Now it has come to light that BICEP2 did, in fact, take some of this foreground polarization into account, in part using results from Planck. But since the raw data hadn’t been released, the team used data taken from a PDF slide of Planck results and basically reverse-engineered the Planck data. It is sometimes referred to as “data scraping”, and it isn’t ideal, but it works moderately well. Now there is some debate as to whether that slide presented the real foreground polarization or some averaged polarization. If it is the latter, then the BICEP2 results may have underestimated the foreground effect. Does this mean the BICEP2 results are completely invalid? Given what I’ve seen so far, I don’t think it does. Keep in mind that the Planck foreground is one of several foreground effects that BICEP2 did account for. It could be a large error, but it could also be a rather minor one.
The important thing to keep in mind is that the BICEP2 paper is still undergoing peer review. Critical analysis of the paper is exactly what should happen, and is happening. This type review used to be confined to the ivory towers, but with social media it now happens in the open. This is how science is done. BICEP2 has made a bold claim, and now everyone gets to whack at them like a piñata.
The BICEP2 team stands by their work, and so we’ll have to see whether it holds up to peer review. We’ll also have to wait for the Planck team to release their results on B-mode polarization. Eventually the dust will settle and we’ll have a much better handle on the results.
Artist's conception of the event horizon of a black hole. Credit: Victor de Schwanberg/Science Photo Library
Could the famed “Big Bang” theory need a revision? A group of theoretical physicists suppose the birth of the universe could have happened after a four-dimensional star collapsed into a black hole and ejected debris.
Before getting into their findings, let’s just preface this by saying nobody knows anything for sure. Humans obviously weren’t around at the time the universe began. The standard theory is that the universe grew from an infinitely dense point or singularity, but who knows what was there before?
“For all physicists know, dragons could have come flying out of the singularity,” stated Niayesh Afshordi, an astrophysicist with the Perimeter Institute for Theoretical Physics in Canada who co-authored the new study.
So what are the limitations of the Big Bang theory? The singularity is one of them. Also, it’s hard to predict why it would have produced a universe that has an almost uniform temperature, because the age of our universe (about 13.8 billion years) does not give enough time — as far as we can tell — to reach a temperature equilibrium.
Most cosmologists say the universe must have been expanding faster than the speed of light for this to happen, but Ashford says even that theory has problems: “The Big Bang was so chaotic, it’s not clear there would have been even a small homogenous patch for inflation to start working on.”
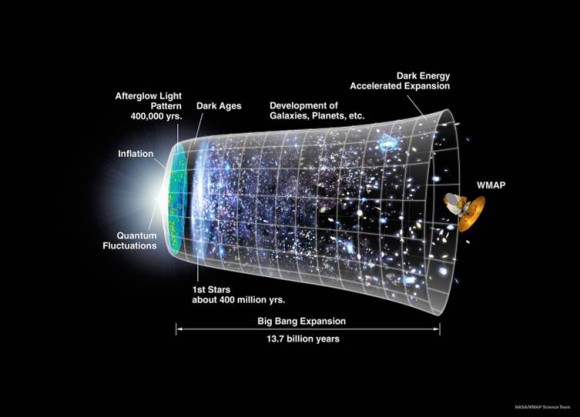
Representation of the timeline of the universe over 13.7 billion years, from the Big Bang, through the cosmic dark ages and formation of the first stars, to the expansion in the universe that followed. Credit: NASA/WMAP Science Team.
This is what the physicists propose:
The model they constructed has the three-dimensional universe floating as a membrane (or brane) in a “bulk universe” that has four dimensions. (Yes, this is making our heads hurt as well, so it might be easier to temporarily think of the brane as two-dimensional and the “bulk universe” as three-dimensional when trying to picture it.) You can read the more technical details in this 2000 paper on which the new theory is based.
So if this “bulk universe” has four-dimensional stars, these stars could go through the same life cycles as the three-dimensional ones we are familiar with. The most massive ones would explode as supernovae, shed their skin and have the innermost parts collapse as a black hole.
The 4-D black hole would have an “event horizon” just like the 3-D ones we are familiar with. The event horizon is the boundary between the inside and the outside of a black hole. There are a lot of theories of what goes on inside a black hole, although nothing has ever been observed.
In a 3-D universe, the event horizon appears as a two-dimensional surface. So in a 4-D universe, the event horizon would be a 3-D object called a hypersphere.
So basically, what the model says is when the 4-D star blows apart, the leftover material would create a 3-D brane surrounding a 3-D event horizon, and then expand.
The long and the short of it? To bring this back to things that we can see, it is clear from observations that the universe is expanding (and indeed is getting faster as it expands, possibly due to the mysterious dark energy). The new theory says that the expansion comes from this 3-D brane’s growth. But there is at least one limitation.
This artist’s impression shows the surroundings of the supermassive black hole at the heart of the active galaxy NGC 3783 in the southern constellation of Centaurus (The Centaur). New observations using the Very Large Telescope Interferometer at ESO’s Paranal Observatory in Chile have revealed not only the torus of hot dust around the black hole but also a wind of cool material in the polar regions. Credit: ESO/M. Kornmesser
The new model differs from these CMB readings by about four percent, so the researchers are looking to refine the model. They still feel the model has worth, however. Planck shows that inflation is happening, but doesn’t show why the inflation is happening.
“The study could help to show how inflation is triggered by the motion of the universe through a higher-dimensional reality,” the researchers stated.
You can read more about their research on this prepublished Arxiv paper. The Arxiv entry does not specify if the paper has been submitted to any peer-reviewed scientific journals for publication.
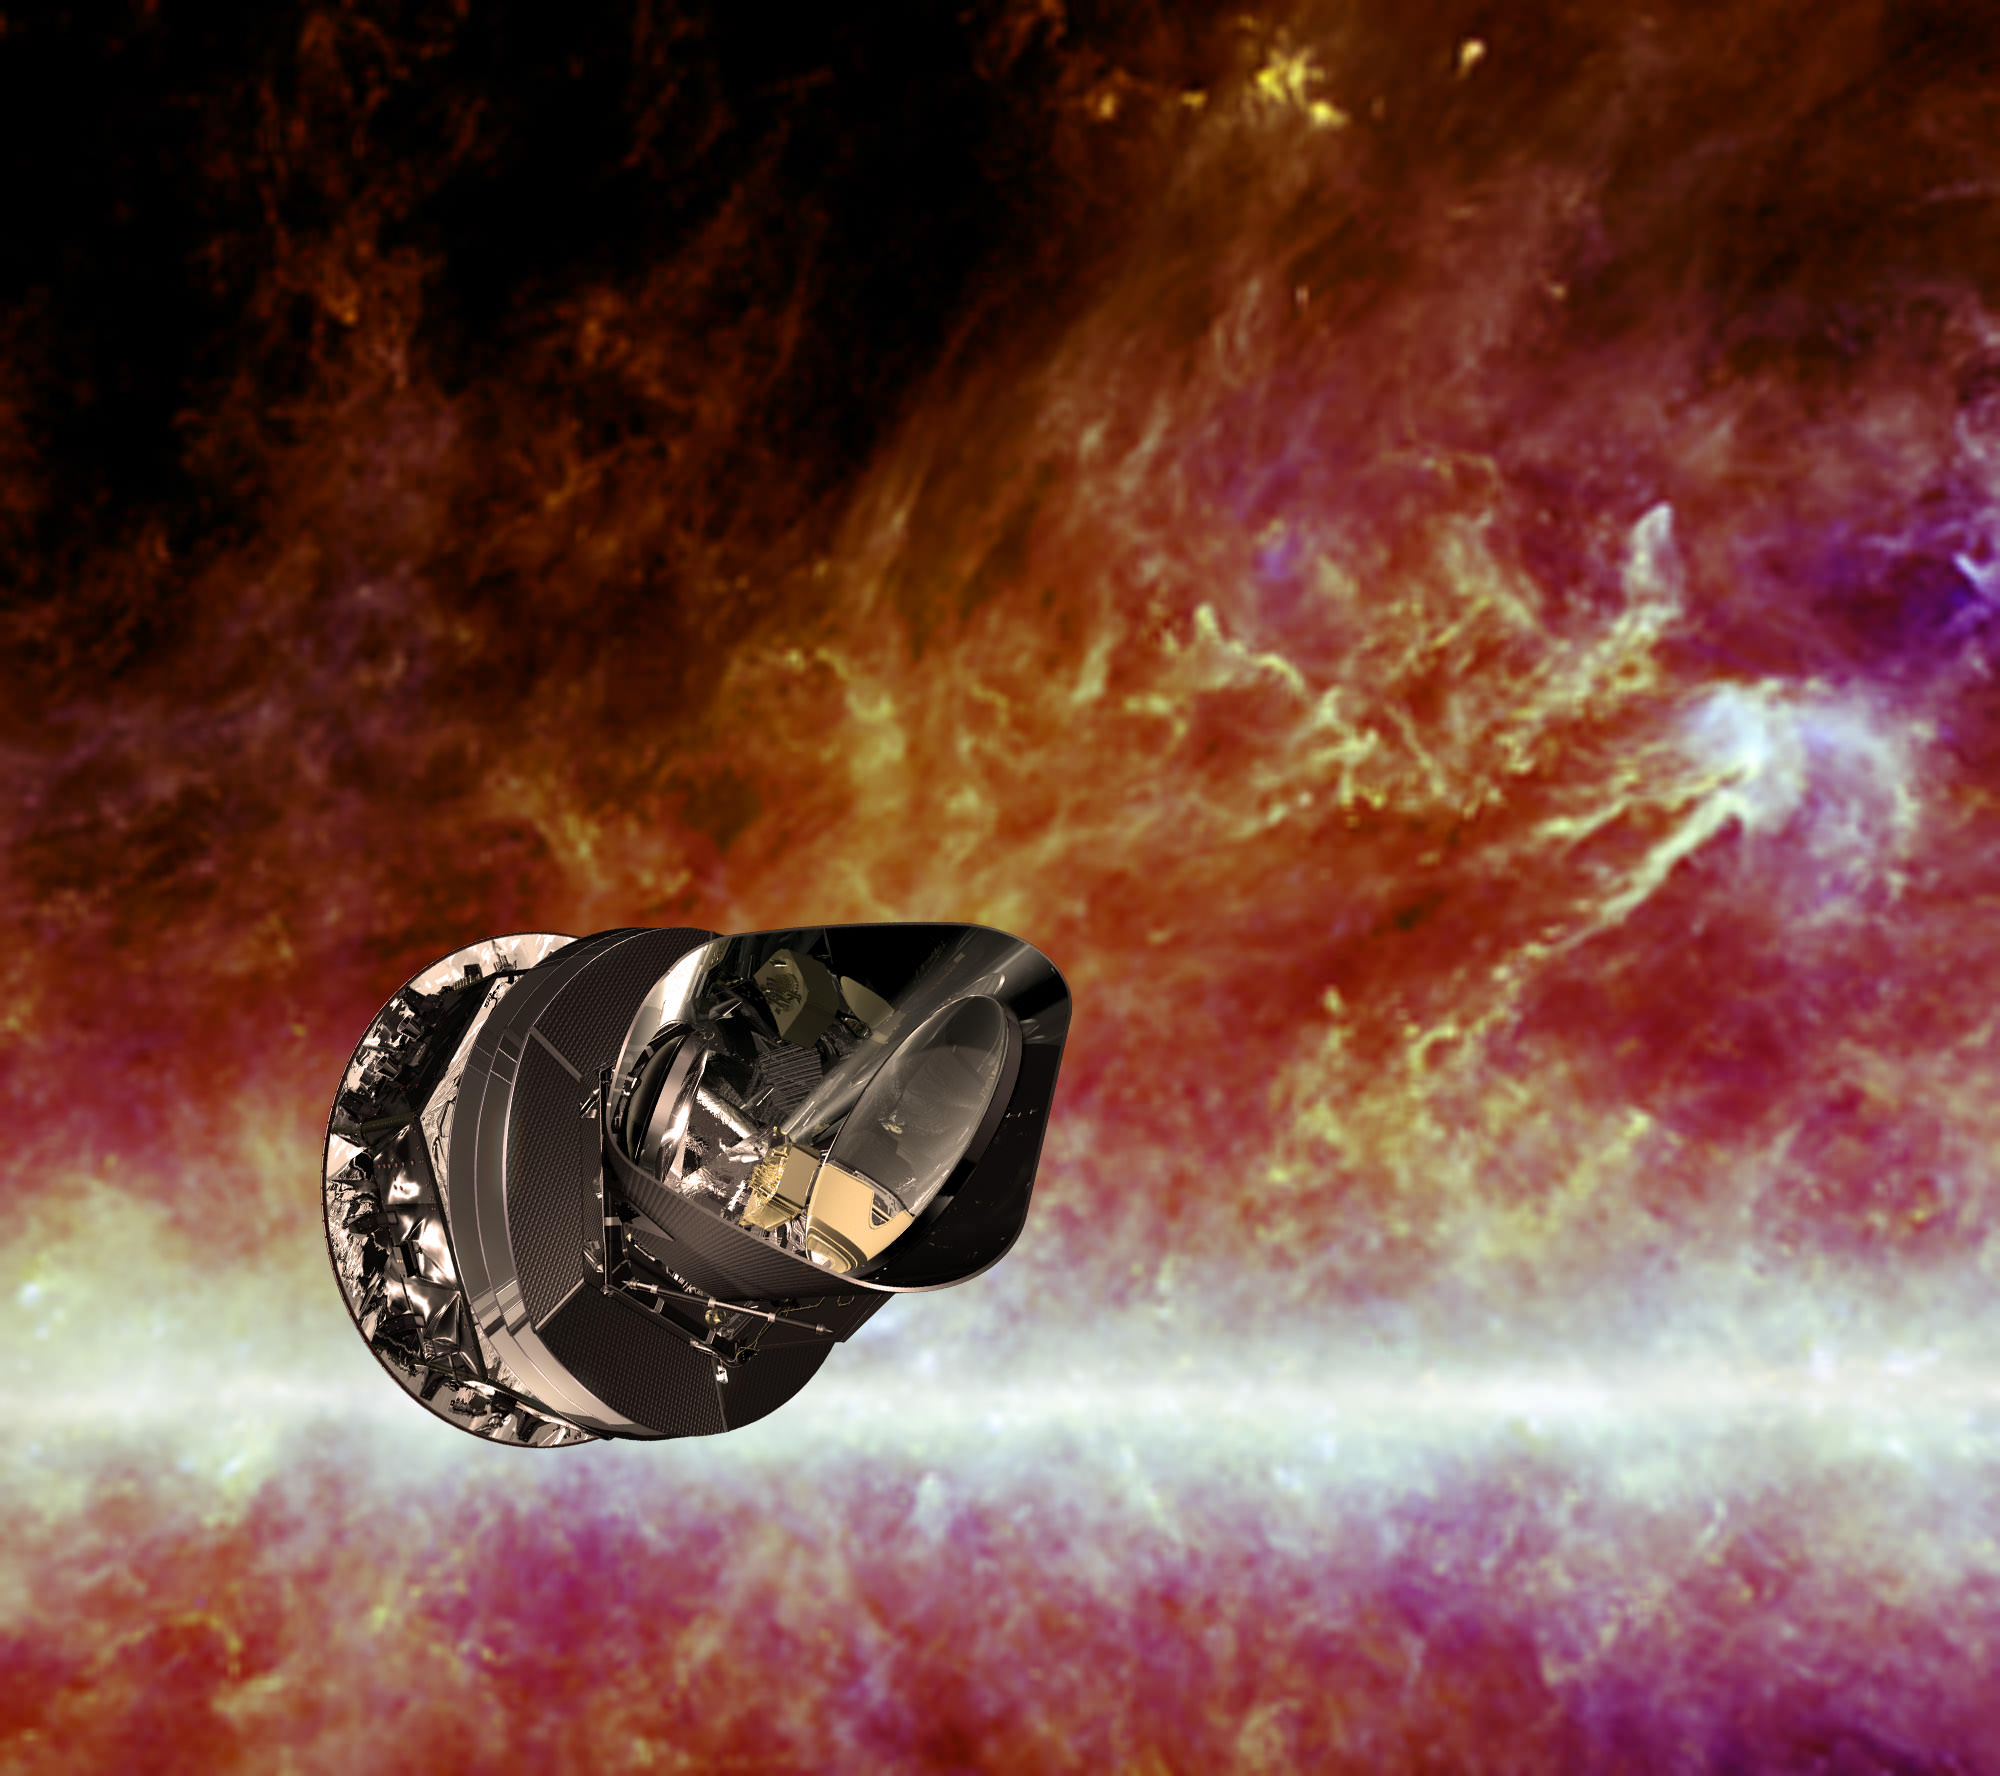
Artist's impression of the Planck spacecraft. Credit: ESA
[/caption]
After two and a half years of observing the Cosmic Microwave Background, the ESA Planck spacecraft’s High Frequency Instrument ran out of its on-board coolant gases over this past weekend, reaching the end of its very successful mission. But that doesn’t mean the end for Planck observations. The Low Frequency Instrument, which does not need to be super-cold (but is still at a bone-chilling -255 C), will continue taking data.
“The Low Frequency Instrument will now continue operating for another year,” said Richard Davis, of the University of Manchester in the UK. “During that time it will provide unprecedented sensitivity at the lower frequencies.”
From its location at the Earth/Sun’s L2 Lagrangian point, Planck was designed to ‘see’ the microwaves from the CMB and detects them by measuring temperature. The expansion of the Universe means that the CMB is brightest when seen in microwave light, with wavelengths between 100 and 10,000 times longer than visible light. To measure such long wavelengths Planck’s detectors have to be cooled to very low temperatures. The colder the spacecraft, the lower the temperatures the spacecraft can detect.
The High Frequency Instrument (HFI) was cooled to as close to 2.7K (about –270°C, near absolute zero) as possible.
Planck worked perfectly for 30 months, about twice the span originally required, and completed five full-sky surveys with both instruments.
“Planck has been a wonderful mission; spacecraft and instruments have been performing outstandingly well, creating a treasure trove of scientific data for us to work with,” said Jan Tauber, ESA’s Planck Project Scientist.
While it was the combination of both instruments that made Planck so powerful, there is still work for the LFI to do.
Now and Then. This single all-sky image simultaneously captured two snapshots that straddle virtually the entire 13.7 billion year history of the universe. One of them is ‘now’ – our galaxy and its structures seen as they are over the most recent tens of thousands of years (the thin strip extending across the image is the edge-on plane of our galaxy – the Milky Way). The other is ‘then’ – the red afterglow of the Big Bang seen as it was just 380,000 years after the Big Bang (top and bottom of image). The time between these two snapshots therefore covers about 99.997% of the 13.7 billion year age of the universe. The image was obtained by the Planck spacecraft. Credit: ESA
The scientists involved in Planck have been busy understanding and analyzing the data since Planck launched in May 2009. Initial results from Planck were announced last year, and with Planck data, scientists have created a map of the CMB identifying which bits of the map are showing light from the early Universe, and which parts are due to much closer objects, such as gas and dust in our galaxy, or light from other galaxies. The scientists have also produced a catalog of galaxy clusters in the distant Universe — many of which had not been seen before — and included some gigantic ‘superclusters,’ which are probably merging clusters.
The scientists expect to release data about star formation later next month, and reveal cosmological findings from the Big Bang and the very early Universe in 2013.
“The fact that Planck has worked so perfectly means that we have an incredible amount of data,” said George Efstathiou, a Planck Survey Scientist from the University of Cambridge. “Analyzing it takes very high-performance computers, sophisticated software, and several years of careful study to ensure that the results are correct.”
This new image from Planck spans about 50° of the sky. Credits: ESA/HFI Consortium/IRAS
Dust has never looked so beautiful! This new image from the Planck spacecraft shows giant filaments of cold dust stretching through our galaxy. The image spans about 50 degrees of the sky, showing our local neighborhood within approximately 500 light-years of the Sun. “What makes these structures have these particular shapes is not well understood,” says Jan Tauber, ESA Project Scientist for Planck. Analyzing these structures could help to determine the forces that shape our galaxy and trigger star formation. Continue reading “Planck Reveals Giant Dust Structures in our Local Neighborhood”