How Low Can You Go? Take the Great Square Challenge

Look high in the southern sky at nightfall to find the familiar giant square that forms part of the body of Pegasus the Flying Horse. The map shows the sky around 6:30 p.m. local time. Source: Stellarium

Cast your gaze up, up, up on the next dark, moonless night and stare into the Great Square of Pegasus. How many stars do you see? Zero? Two? Twenty? If you’d like to find out how dark your sky is, read on. 

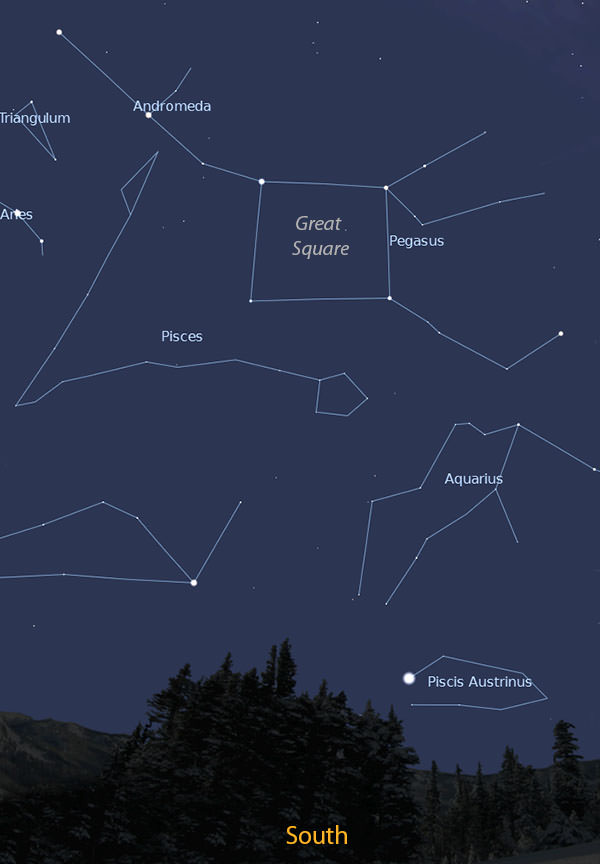
The Great Square, one of the fall sky’s best known star patterns, rides high in the south at nightfall in mid-December. It forms part of the larger figure of Pegasus the Winged Horse. For our purposes today, we’re going to concentrate on what’s inside the square.

Bounded by Alpheratz (officially belonging to adjacent Andromeda), Scheat, Markab and Algenib, the Great Square is about 15° on a side or one-and-a-half balled fists held at arm’s length.

At first glance, the space appears empty, but a closer look from all but the most light polluted skies will reveal a pair 4th magnitude stars in the upper right quadrant of the square. Fourth magnitude is about the viewing limit from a bright suburban location.

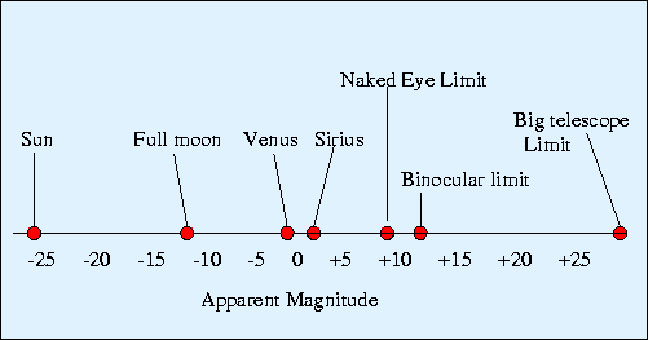
Astronomers use the magnitude scale to measure star and planet brightness. Each magnitude is 2.5 times brighter than the one below it. Aldebaran, which shines at 1st magnitude, is 2.5 times brighter than a 2nd magnitude star, which in turn is 2.5 times brighter than a 3rd magnitude star and so on.

Moonlight and especially light pollution reduce the number of stars we can see in the night sky. This specially prepared map shows slices of sky based on amateur astronomer and author John Bortle's Dark Sky Scale. Classes range from 1 (excellent with stars fainter than 7th magnitude visible) to 9 (inner city with a limiting magnitude of 4). Click for more detailed descriptions of each class and rate your own sky. Credit: International Dark Sky Association
Moonlight and especially light pollution reduce the number of stars we can see in the night sky. This specially prepared map shows slices of sky based on amateur astronomer and author John Bortle’s Dark Sky Scale. Classes range from 1 (excellent with stars fainter than 7th magnitude visible) to 9 (inner city with a limiting magnitude of 4). Click for more detailed descriptions of each class and rate your own sky. Credit: International Dark Sky Association

A first magnitude star is 2.5 x 2.5 x 2.5 x 2.5 x 2.5 (about 100) times brighter than a 6th magnitude star. The bigger the magnitude number, the fainter the star. From cities, you might see 3rd magnitude stars if you can block out stray lighting, but a dark country sky will deliver the Holy Grail naked eye limit of magnitude 6. Skywatchers with utterly dark conditions might glimpse stars as faint 7.5. My own personal best is 6.5.

With each drop in magnitude the number of stars you can see increases exponentially. There are only 22 first magnitude or brighter stars compared to 5,946 stars down to magnitude 6.

What appears blank at first is filled with stars -- 26 of them down to magnitude 6.3 are visible inside the Great Square from a dark sky site. How many can you see? Click for a large version. Source: Stellarium
What appears blank at first is filled with stars — 26 of them down to magnitude 6.3 are visible inside the Great Square from a dark sky site. How many can you see? Click for a larger version. Source: Stellarium

Ready to stretch your sight  and rate your night sky? Step outside at nightfall and allow your eyes to dark-adapt for 20 minutes. With a copy of the map (above) in hand, start with the brightest stars and work your way to the faintest. Each every small step down the magnitude ladder prepares your eyes the next.

With a little effort you should be able to spot the four 4th magnitude range stars. At magnitude 5, you’ll work harder. Moving beyond 5.5 can be very challenging. I revert to averted vision to corral these fainties. Instead of staring directly at the star, play your eye around it. Look a bit to this side and that. This allows a rod-rich part of the retina that’s excellent at seeing faint stuff play through the scene and snatch up the faintest possible stars.

Magnitude scale showing the limits of the eye, binoculars and telescopes. Credit: Dr. Michael Bolte, UCO/Lick Observatory

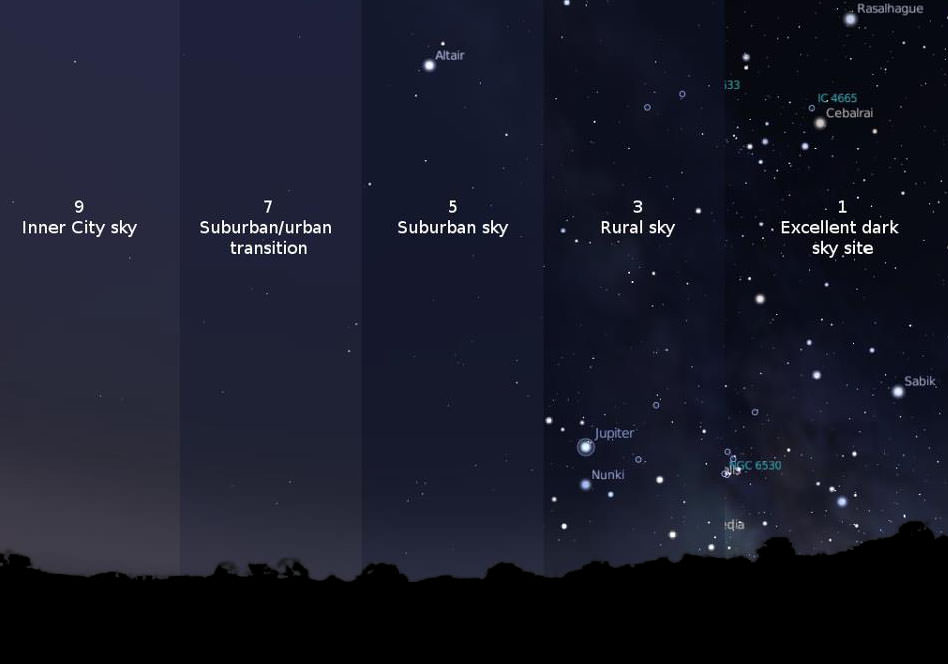
From my house I can pick out about dozen points of light inside the Square on a moonless night. How many will you see? Once you know your magnitude limit, compare your result to John Bortle’s Dark Sky Scale … and weep. No, just kidding. But his Class 1 excellent sky includes a description of seeing stars down to magnitude 8 and the summer Milky Way casting shadows.

Hard to believe that before about 1790, when gas lighting was introduced in England, Class 1 skies were the norm across virtually the entire planet. Nowadays, most of us have to drive a hundred miles or more to experience true, untrammeled darkness.

Have fun with the challenge and let us know in the comments area how you do. Here’s hoping you find the Great Square far from vacant.

How Far Can You See in the Universe?

How Far Can You See in the Universe?

When you look into the night sky, you’re seeing tremendous distances away, even with your bare eyeball. But what’s the most distant object you can see with the unaided eye? And what if you get help with a pair of binoculars, a telescope, or even with the Hubble Space Telescope.

Standing at sea level, your head is at an altitude of 2 meters, and the horizon appears to be about 3 miles, or 5 km away. We’re able to see more distant objects if they’re taller, like buildings or mountains, or when we’re higher up in the air. If you get to an altitude of 20 meters, the horizon stretches out to about 11 km. But we can see objects in space which are even more distant with the naked eye. The Moon is 385,000 km away and the Sun is a whopping 150 million km. Visible all the way down here on Earth, the most distant object in the solar system we can see, without a telescope, is Saturn at 1.5 billion km away.

In the very darkest conditions, the human eye can see stars at magnitude 6.5 or greater. Which works about to about 9,000 individual stars. Sirius, the brightest star in the sky, is 8.6 light years. The most distant bright star, Deneb, is about 1500 light years away from Earth. If someone was looking back at us, right now, they could be seeing the election of the 52nd pope, St. Hormidas, in the 6th Century.
There are even a couple of really bright stars in the 8000 light year range, that we might just barely be able to see without a telescope. If a star detonates, we can see it much further away. The famous 1006 supernova was the brightest in history, recorded in China, Japan and the Middle East.

It was a total of 7,200 light years away and was visible in the daytime. There’s even large structures we can see. Outside the galaxy, the Large Magellanic Cloud is 160,000 light years and the Small Magellanic Cloud is almost 200,000 light years away. Unfortunately for us up North, these are only visible from Southern Hemisphere.The most distant thing we can see with our bare eyeballs is Andromeda at 2.6 million light years, which in dark skies looks like a fuzzy blob.

If we cheat and get a little help, say with binoculars – you can see magnitude 10 – fainter stars and galaxies at more than 10 million light-years away. With a telescope you can see much, much further. A regular 8-inch telescope would let you see the brightest quasars, more than 2 billion light years away. Using gravitational lensing the amazing Hubble space telescope can see galaxies, incredibly far out, where the light had left them just hundreds of millions of years after the Big Bang.

If you could see in other wavelengths, you could see different distances. Fortunately for our precious radiation sensitive organs, Gamma and X rays are blocked by our atmosphere. But if you could see in that spectrum, you could see objects exploding billions of light years away. And if you could see in the radio spectrum, you’d be able to see the cosmic microwave background radiation, surrounding us in all directions and marking the edge of the observable universe.

Wouldn’t that be cool? Well, maybe we can… just a little. Turn on your television, some of the static on the screen is this very background radiation, the afterglow of the Big Bang.

What do you think? If you could see far out in the Universe what would you like a close up view of? Tell us in the comments below.

Geek Out! How to Build Your Own Nova Delphini Light Curve

Nova Delphini (center) continues to shine brightly enough to see in binoculars and with the naked eye once the moon's out of the sky. While we still don't know its distance, novae like this one are typically between 1,000 to 1,500 light years away. Credit: John Chumack

And now for something to appeal to your inner geek. Or, if  you’re like me, your outer geek. Many of you have been watching the new nova in Delphinus with the naked eye and binoculars since it burst onto the scene early Aug. 14. In a moment I’ll show how to turn your observations into a cool representation of the nova’s behavior over time.

Updated Nova Delphini 2013 chart using the latest visual magnitudes from the AAVSO showing stars around the nova to magnitude 7.1. Stellarium
Updated Nova Delphini 2013 chart using the latest visual magnitudes from the AAVSO showing stars around the nova to magnitude 7.1. Click for larger version. Stellarium

Where I live in northern Minnesota, we’ve had a lucky run of clear nights since the outburst began. Each night I’ve gone out with my 8×40 binoculars and star chart to estimate the nova’s brightness. The procedure is easy and straightforward. You find comparison stars near the nova with known magnitudes, then select one a little brighter and one a little fainter and interpolate between the two to arrive at the nova’s magnitude.

Estimating a star's magnitude by creating a sliding scale in your mind's eye between a stars that bracket the nova in brightness. Illustration: Bob King
Estimating a star’s magnitude by creating a sliding scale in your mind’s eye between stars that bracket the nova in brightness. Illustration: Bob King

For example, if the nova’s brightness lies halfway between the magnitude 4.8 and 5.7 stars it’s about magnitude 5.3. The next night you might notice it’s not exactly halfway but a tad brighter or closer to the 4.8 star. Then you’d measure 5.2. Remember that the smaller the number, the brighter the object. I’ve found that defocusing the stars into disks makes it a bit easier to estimate these differences.

In time, you’ll come up with a list of magnitudes or brightness estimates for Nova Delphini. Here’s mine to date:

* Aug. 14: 5.8
* Aug. 15: 4.9
* Aug. 16: 5.0
* Aug. 17: 5.0
* Aug. 18: 5.0
* Aug. 19: 5.2
* Aug. 20: 5.5

Template you can use to plot your own estimates of Nova Delphini 2013's night by night brightness through Sept. 11. Click for larger version.
Template you can use to plot your own estimates of Nova Delphini 2013’s night by night brightness through Sept. 11. Click for larger version.

So far just numbers, but there’s a way to turn this into a satisfying visual picture of the nova’s long-term behavior. Graph it! That’s what astronomers do, and they call it a light curve.

I dug around and came up with this very basic template. The horizontal or x-axis measures time in days, the vertical or y-axis plots the nova’s brightness measured in magnitudes. You can either right-click and save the image above or grab the higher-res version HERE.

I plotted my own brightness estimates of the nova using Photoshop Elements. You can do it on computer or with paper and pencil.

Next, print out a copy and lay in your data points with pencil and ruler the old-fashioned way or use an imaging program like Photoshop or Paint to do the same on the computer. I use a very basic version of Photoshop Elements to plot my observations. Once your observations are marked, connect them to build your light curve.

Connecting the dots, we can start to see how the nova behaves over time. The sudden jump from obscurity as well as the brief plateau before fading are obvious.

Right away you’ll notice a few interesting things. The nova shot up from approximately 17th magnitude on Aug. 13 to 6.8 on Aug. 14 – a leap of more than 10 magnitudes, which translates to a nearly 10,000 fold increase in brightness.

I wasn’t able to see the Nova Del top out at around 4.4 magnitude – that happened when I was asleep the next morning – but I did catch it at 4.9. The next few days the nova hits a plateau followed by what appears for the moment like a steady decline in brightness. Will it rocket back up or continue to fade? That’s for you and your binoculars to find out the next clear night.

Official AAVSO light curve to date for Nova Delphini 2013 created using their light curve generator. The plot includes observations from many observers. Copyright: AAVSO
AAVSO light curve to date for Nova Delphini 2013 created using their light curve generator. The plot includes observations from many observers. Copyright: AAVSO

If you’d like to take the next step and contribute your observations for scientific use, head over to the AAVSO (American Assn. of Variable Star Observers) and become a member. Even if you don’t sign up, access to data, charts and light curves of novae and other variable stars is completely free.

Nova Sagittarii 2012 light curve. Notice the occasional plateaus as well as bumps in brightness as it faded back to minimum light. Credit: NASA

I get a kick out of comparing my basic light curves with those created with thousands of observations contributed by hundreds of observers. The basic AAVSO curve looks all scrunched up for the moment because their time scale (x-axis) is much longer term than in my simple example. But guess what? You can change the scale using their light curve generator and open up the view a little more as I did in the curve above.

Light curve of V2467 Cygni, a nova that appeared in Cygnus in 2007. Credit: AAVSO

Here are a couple other typical novae light curves. By the time you’re done looking at the examples here as well as creating your own, you’ll gain a familiarity that may surprise you. Not only will be able to interpret trends in Nova Delphini’s brightness, but you’ll better understand the behavior of other variable stars at a glance. It’s as easy as connecting the dots.