A New, Automatic 3-D Moon

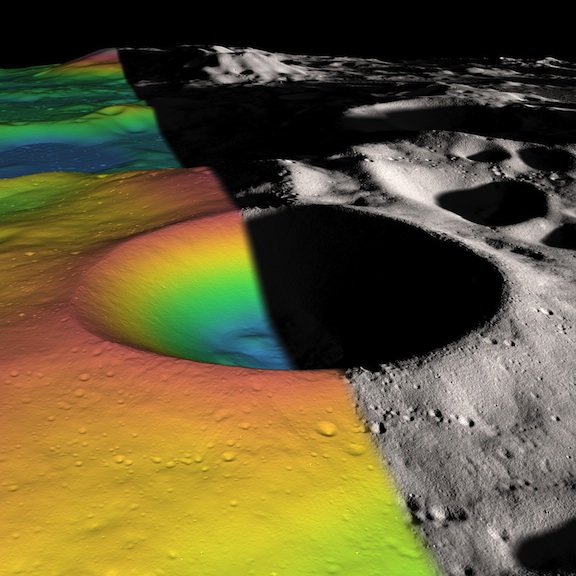
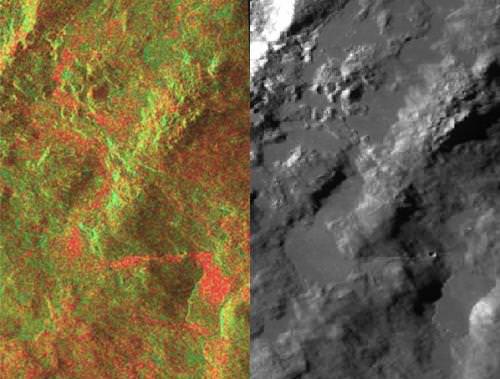
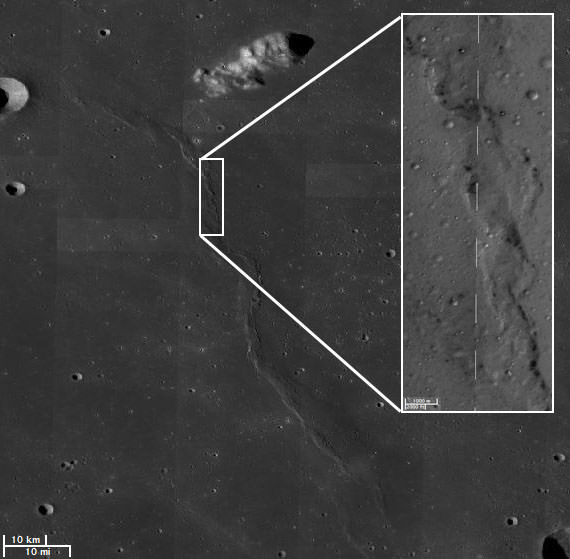
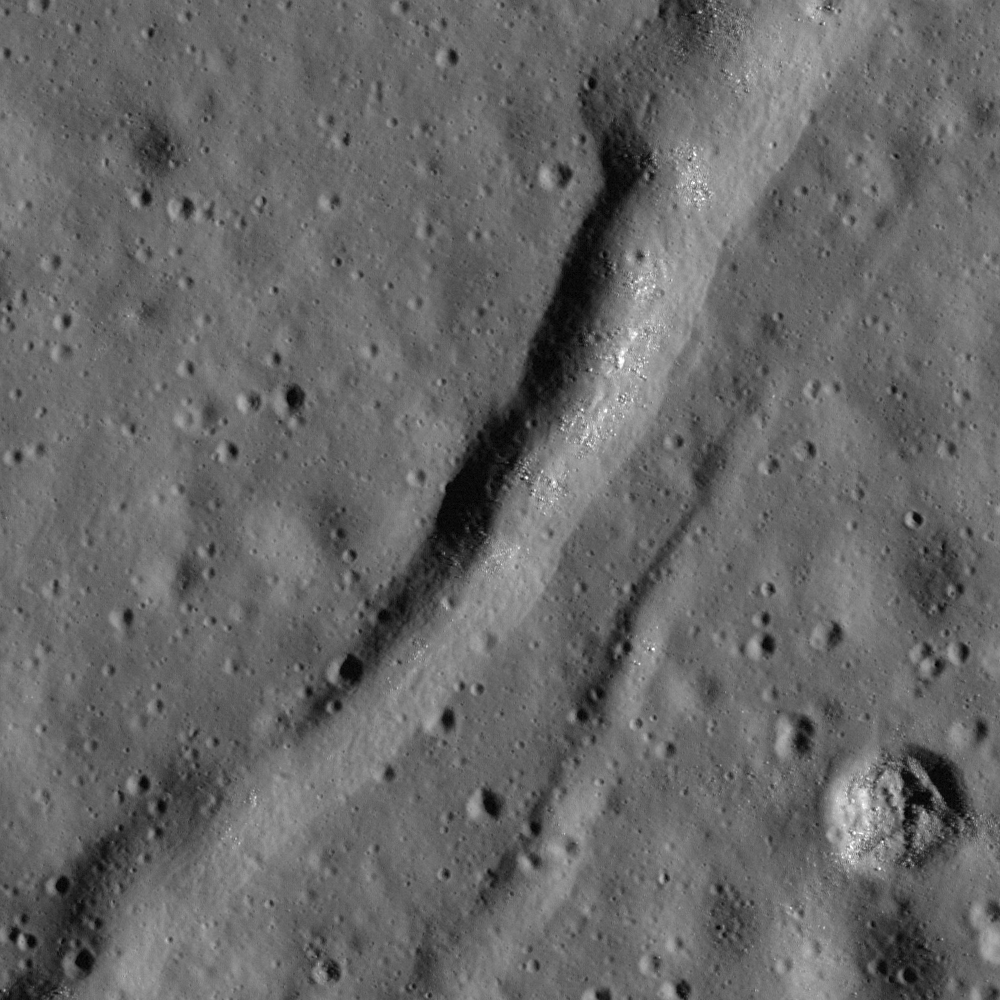
Korolev lobate scarp on the Moon, in 3-D. Lobate scarps, a type of cliff,are found mostly in the highlands on the Moon, and are relatively small and young. Credit: NASA/GSFC/Arizona State University.

Who doesn’t love 3-D images, especially of objects in space? But creating them can be a bit time-consuming for scientists, especially for images from orbiting spacecraft like the Lunar Reconnaissance Orbiter that takes images from just one angle at a time. Usually, it is “amateur” enthusiasts who take the time to find and combine images from different orbital passes to create rich, 3-D views.

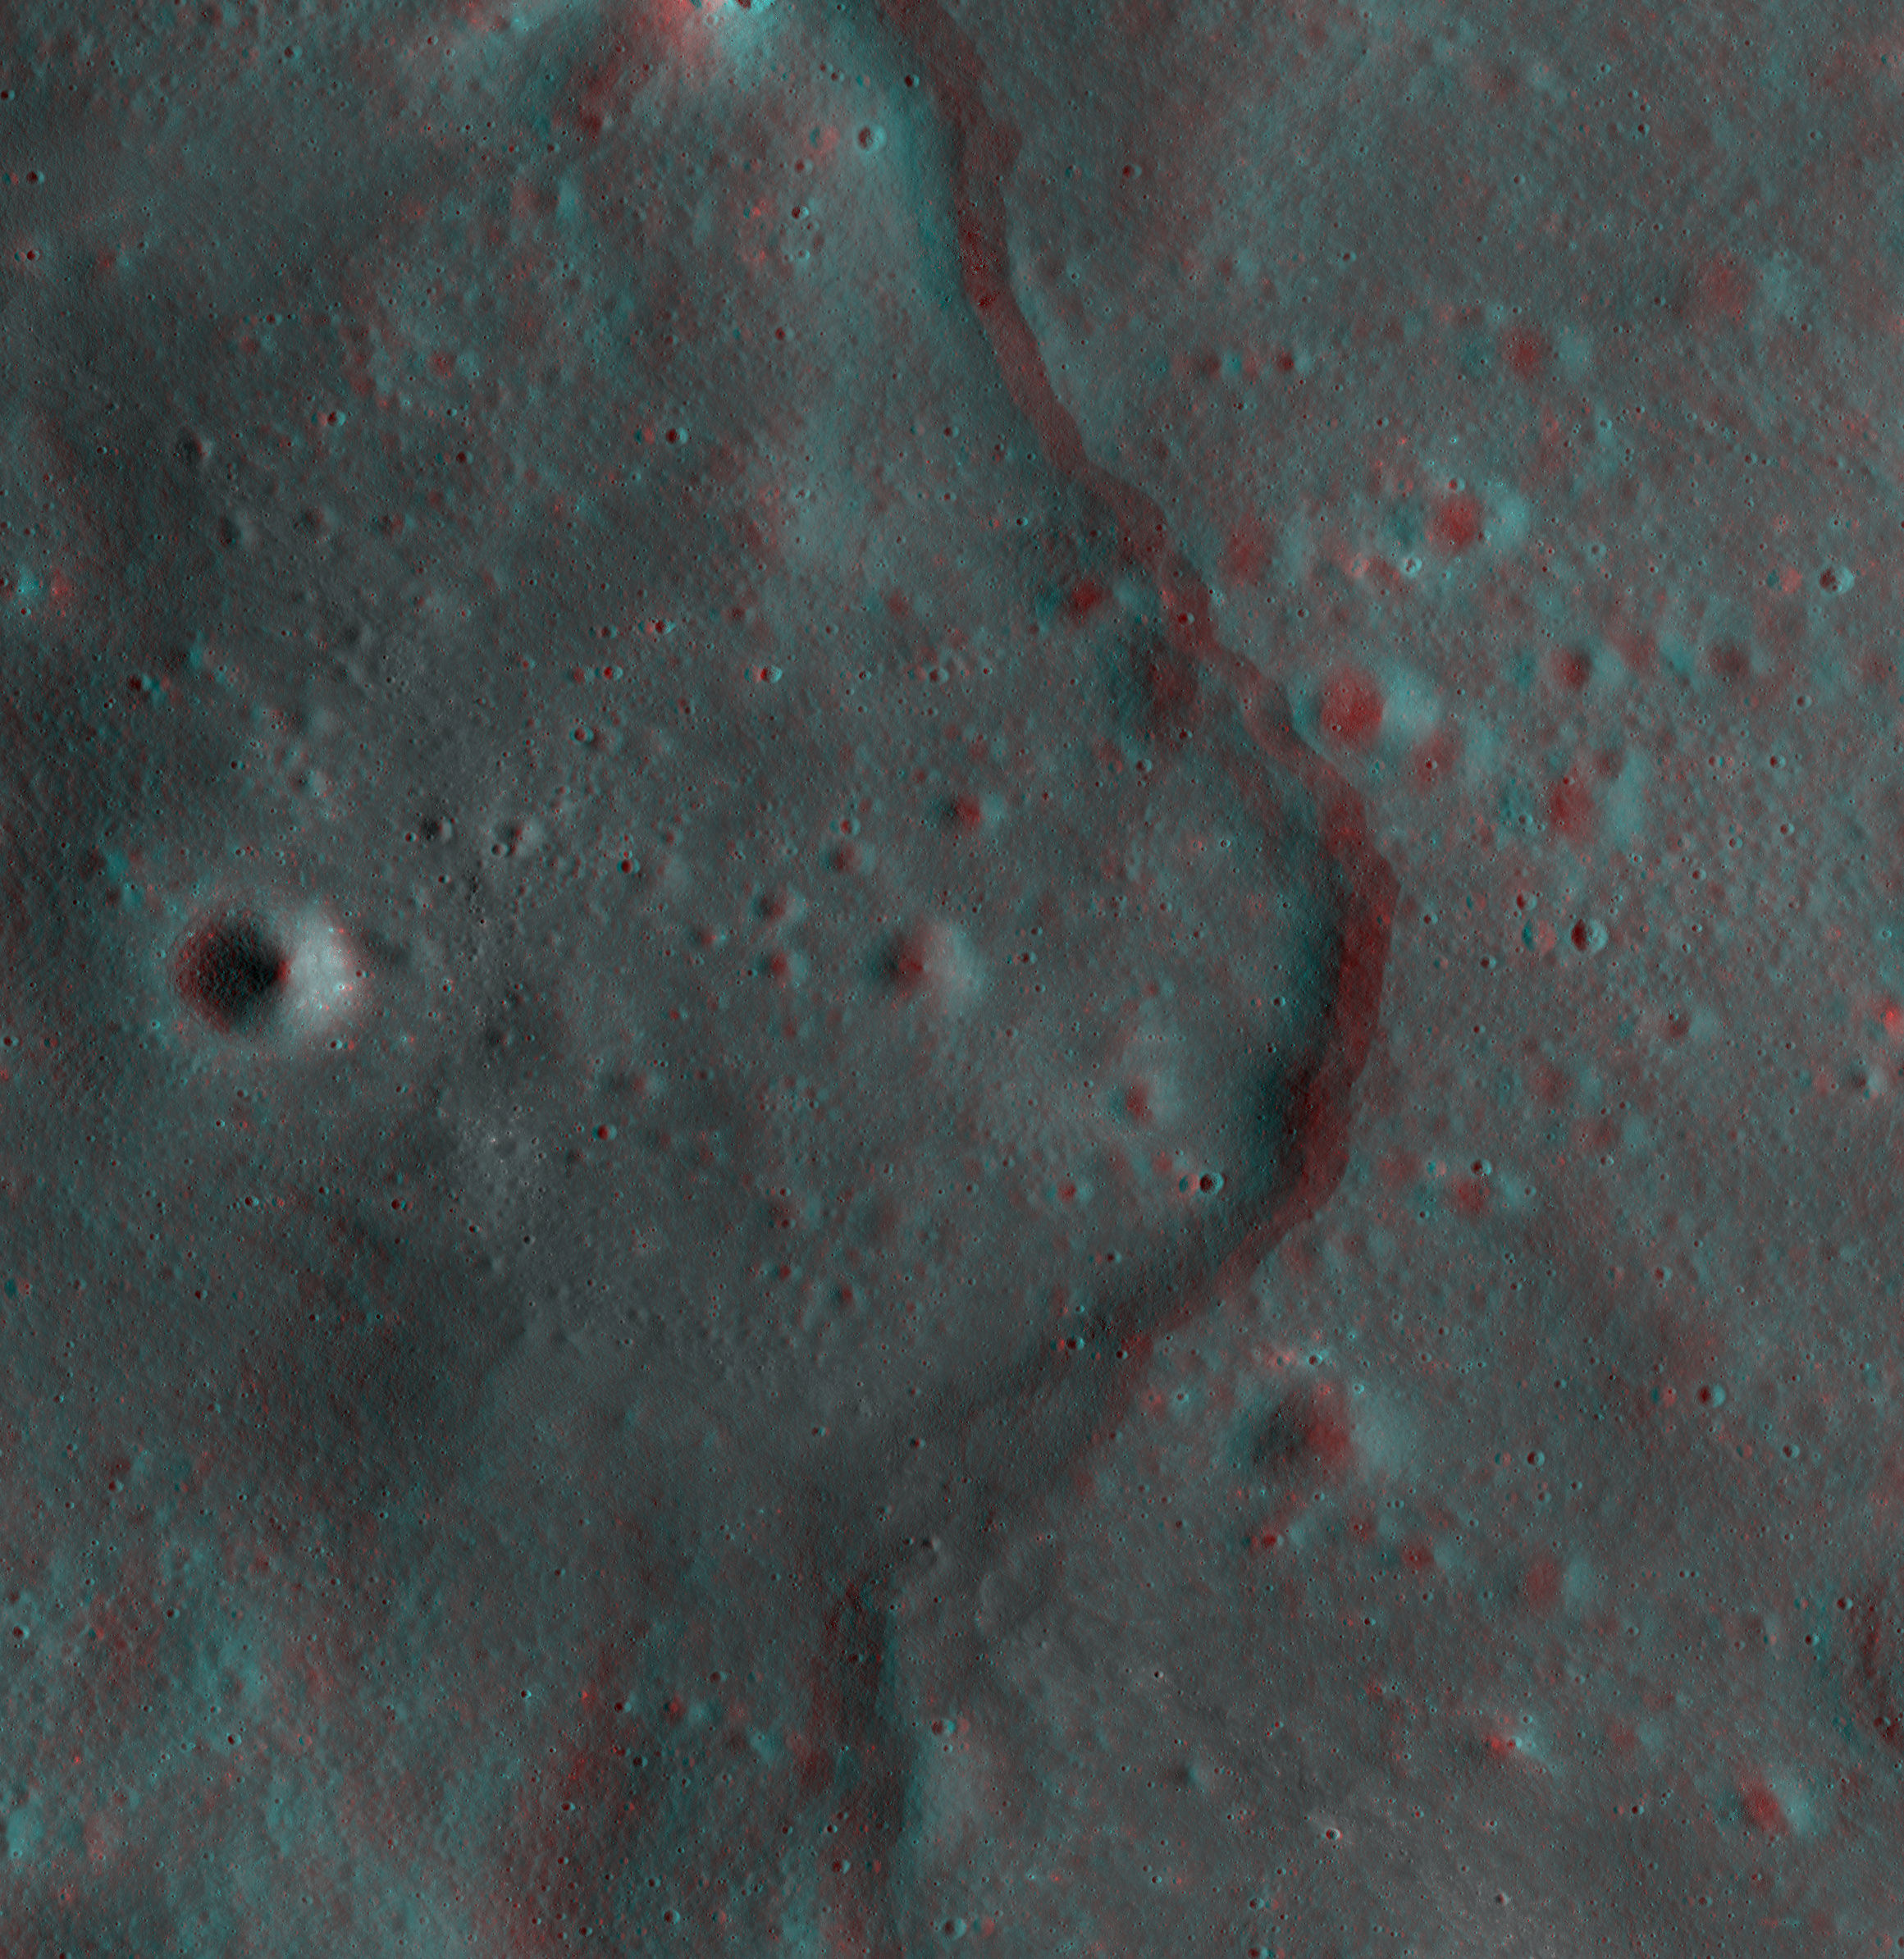
But now, scientists at the University of Arizona and Arizona State University have developed a new automatic “brain” — a new automatic processing system that aligns and adjusts images from LRO, and combines them into images that can be viewed using standard red-cyan 3D glasses.

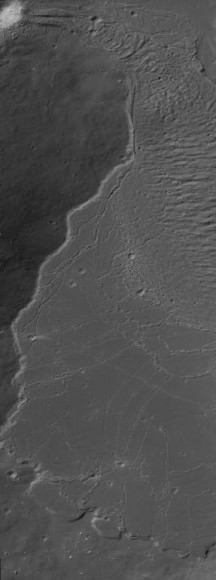
Alpes Sinuous Rille, an ancient channel formed as massive eruptions of very fluid lava poured across the surface of the Moon. Credit: NASA/GSFC/Arizona State University

Human vision sees in three dimensions because our eyes are set slightly apart and see the world from two different angles at once. Our brain then interprets the two images and combines them into a single three dimensional view.

It’s fairly easy to create 3-D views from the Mars rovers like Curiosity and Opportunity, because they have mast cameras and navigation cameras which operate in pairs to provide stereo views of the Martian surface.

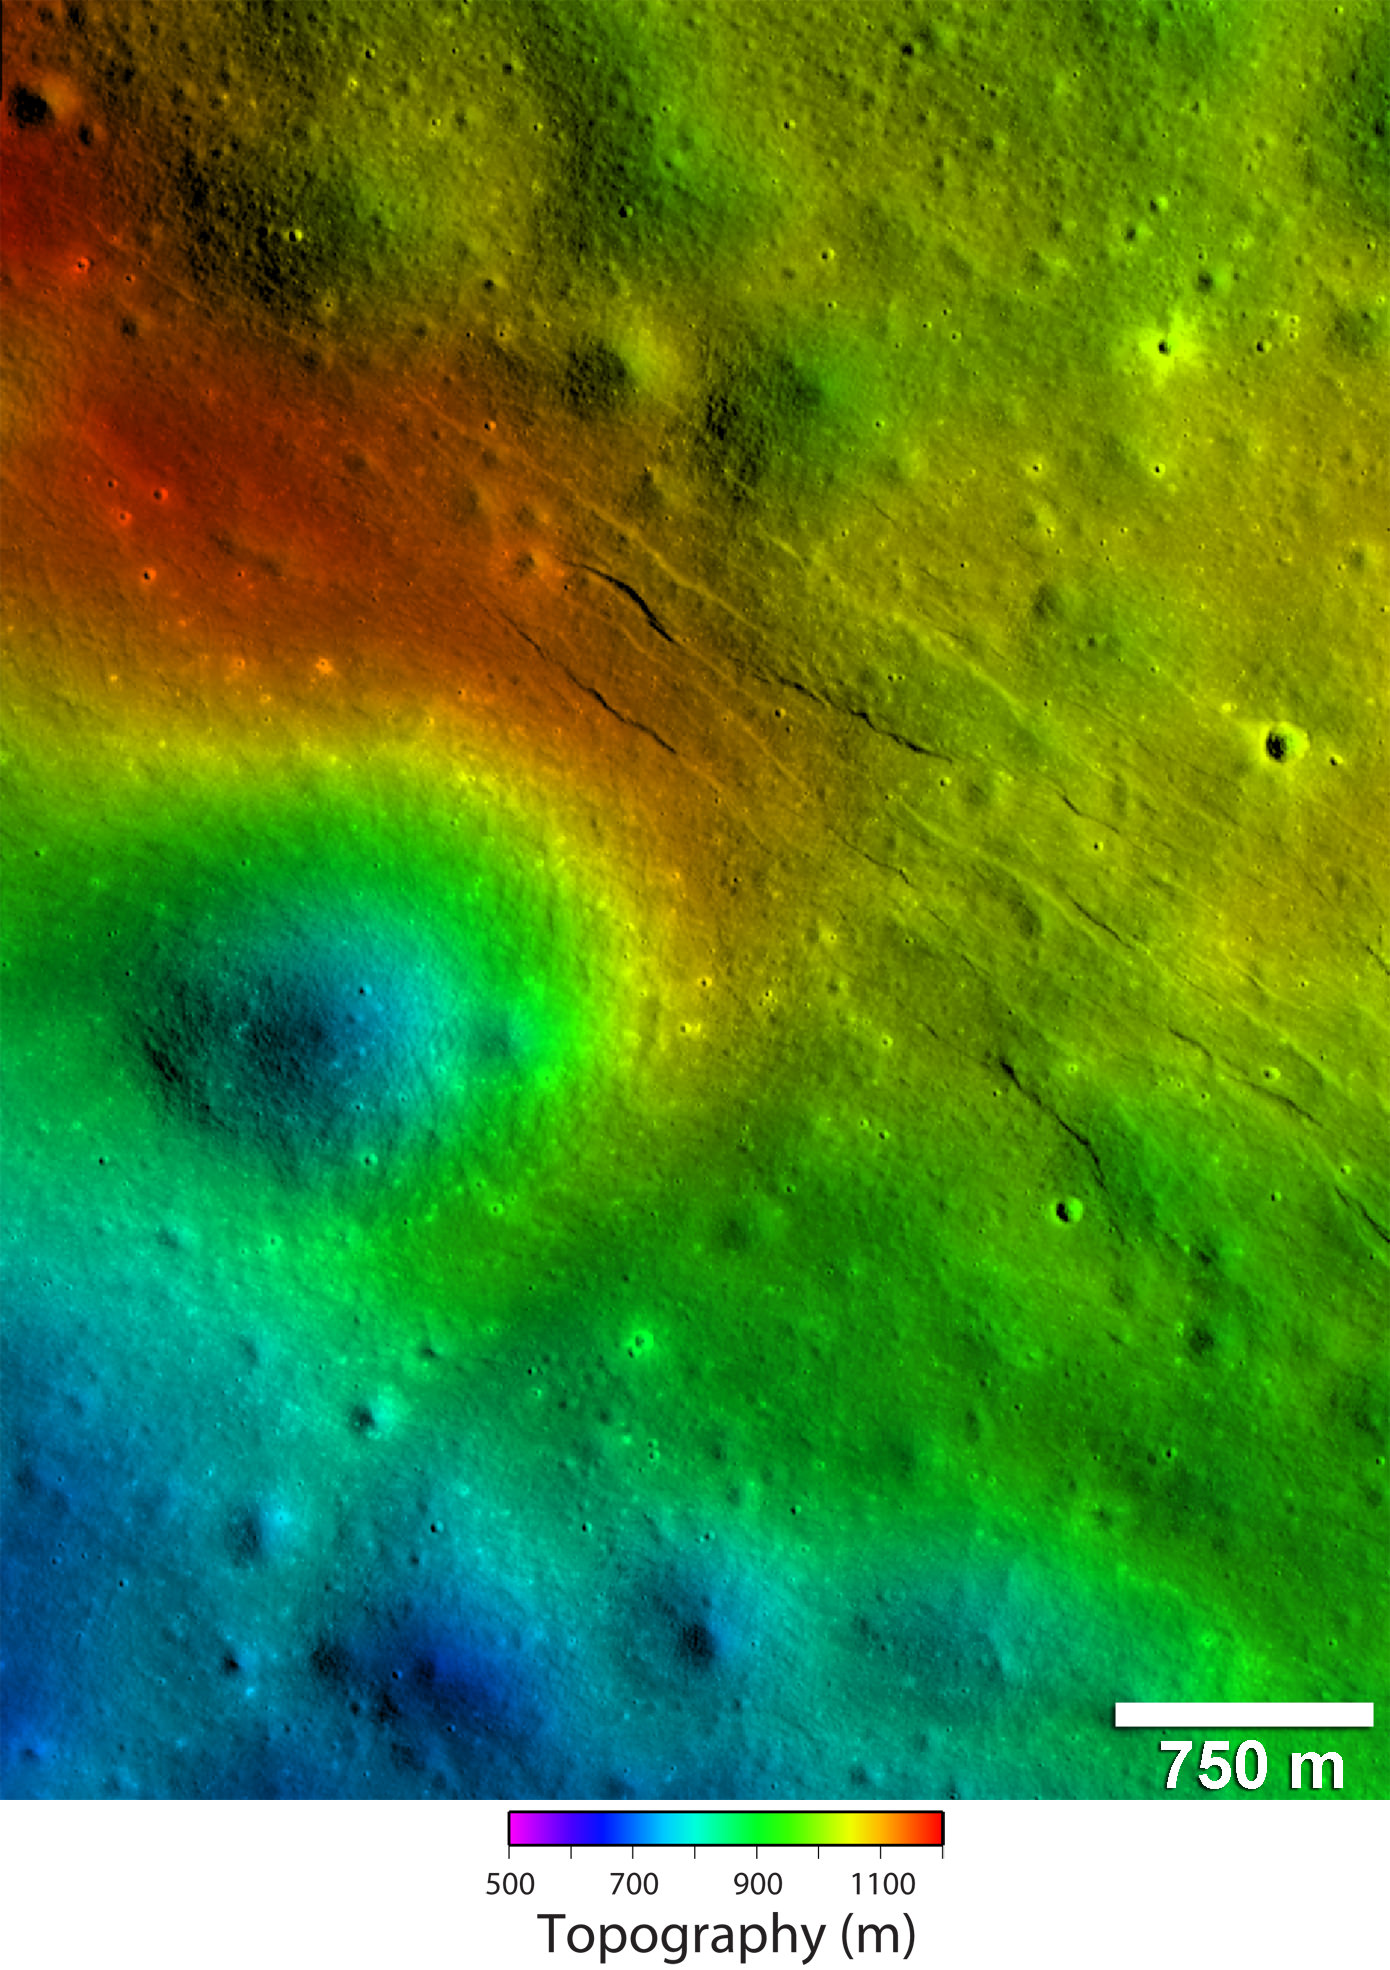
Ancient radial scars of ejecta extend out from the Orientale basin for hundreds of kilometers and consist of aligned craters and massive dune-like forms. They formed as streamers of lunar rock thrown out from the Orientale impact and crashed back to the surface. Credit: NASA/GSFC/Arizona State University

But LRO orbits high above the Moon’s surface, and can see from only one angle at one time. However, images taken in different orbits, from different angles can be combined together to reconstruct a view in three dimensions.

And this new system can automatically combine the disparate shots together. The images here are a sample of what the team has created so far.

This ‘brain’ is provided by a new initiative, presented by team member Sarah Mattson (University of Arizona) to the European Planetary Science Congress on 25 September. The team have developed an This type of image is known as an anaglyph.

“Anaglyphs are used to better understand the 3D structure of the lunar surface,” said Sarah Mattson from the University of Arizona and LRO team member. “This visualization is extremely helpful to scientists in understanding the sequence and structures on the surface of the Moon in a qualitative way. LROC NAC anaglyEuropean Planetary Science Congress on 25 September. LROC NAC anaglyphs will also make detailed images of surface of the Moon accessible in 3D to the general public.”

The Lunar Reconnaissance Orbiter Camera – Narrow Angle Camera (LROC NAC) has acquired hundreds of stereo pairs of the lunar surface, and is acquiring more as the mission progresses. The LROC NAC anaglyphs make lunar features such as craters, volcanic flows, lava tubes and tectonic features jump out in 3D. The anaglyphs will be released through the LROC website as they become available.

Mattson presented the new system at the European Planetary Science Congress on September 25.

Dramatic New Video Brings You to the Dazzling Lunar Surface

This video has been in production for a while and was not originally meant to honor Neil Armstrong, but it very well could memorialize the first human explorer to set foot on the Moon. This short video titled “From the Earth to the Moon” provides a stunning and inspirational view of the lunar surface, and “highlights vast portions of the lunar surface that have yet to be explored, and demonstrates how new images are revealing dramatic details of future landing sites suitable for both robotic and human missions,” writes lunar scientist David Kring, one of the researchers behind creating this video.

All of the footage is from actual images and data from the Lunar Reconnaissance Orbiter; there are no artist renditions or animations.

“The scenes in the video are so dramatic that you may find yourself reaching out to pick up a rock and becoming restless to walk among the lunar peaks,” writes Kring.

As stunning as the video is, it also reminds us that humans have not visited its surface since 1972, even though it is one of the best and most accessible place in the solar system to explore the fundamental principles of our origins, Kring says.

Most of the images and topographical data were obtained in particular by the NASA Lunar Reconnaissance Orbiter Camera (LROC) and Lunar Orbiter Laser Altimeter (LOLA) teams, and rendered by Kring’s team and the Goddard Space Flight Center Scientific Visualization Studio.

Here’s what you are seeing in the video:

The video provides views of (i) the lunar nearside, (ii) a flyover of the heavily cratered lunar highlands, (iii) Oceanus Procellarum, (iv) a zoomed-in perspective of Aristarchus crater, (v) a flight down Vallis Schröteri, (vi) an oblique perspective of Aristarchus crater, (vii) crater walls within Aristarchus, (viii) a pull away perspective of Aristarchus crater, (ix) a zoomed-in rotating view of Tycho crater, (x) flybys of five central peak features within Tycho crater, (xi) a pull away perspective of Tycho crater with distinct panels of images to illustrate a variety of spatial resolutions and albedo, (xii) a rotating view of Tycho crater from a position slightly above its rim, (xiii) a pull away perspective of Tycho crater, (xiv) rotating perspective of Orientale basin, (xv) rotating and pull away perspective from Orientale basin, (xvi) dawn rising over Tsiolkovsky crater, and (xvii) Earth rising over the lunar surface.

Kring leads the Center for Lunar Science and Exploration, and is also well known for another discovery: he was part of the team that discovered the Chicxulub impact crater, and helped link the crater and its ejecta to the K-T boundary mass extinction of dinosaurs and over half of the plants and animals that existed on Earth 65 million years ago.

Source: NLSI

Seeking the Moon’s Rare Atmosphere

Using the dim light of distant stars reflecting off of the surface of the Moon, scientists using a spectrometer aboard NASA’s Lunar Reconnaissance Orbiter have found traces of the Moon’s tenuous atmosphere. But don’t expect to take off your protective spacesuit. The Moon’s atmosphere is made of helium.

“The question now becomes, does the helium originate from inside the Moon, for example, due to radioactive decay in rocks, or from an exterior source, such as the solar wind.” says Dr. Alan Stern, LAMP principal investigator and associate vice president of the Space Science and Engineering Division at Southwest Research Institute, Boulder, Colo.

Scientists designed the Lyman Alpha Mapping Project (LAMP) spectrometer aboard LRO to map the lunar surface but the confirmation that helium surrounds Earth’s largest natural satellite was a bonus, Stern told Universe Today.

“LAMP was designed to simply do what we had not done in 40 years; to look closely at the surface of the Moon,” Stern said. “This really is a breakthrough, a capability discovery.”

LAMP’s findings support work done by the Lunar Atmosphere Composition Experiment, or LACE, that was left behind by Apollo 17 astronauts in 1972. LAMP is designed to examine far ultraviolet emissions in the tenuous atmosphere above the Moon’s surface.

Some elements found on the Moon, such as carbon or sodium, can be studied from Earth. Helium is not one of these, Stern says. Helium only shows very weakly in the far ultraviolet part of the spectrum. The signature is too weak to be seen from the 250,000 miles separating the Moon from Earth. Earth’s ozone layer also absorbs ultraviolet radiation making detection from ground-based detectors impossible.

And with LAMP moving over the lunar surface, we can see more than we’d see with a simple lander, Stern said.

During its mission, LACE detected argon but so far only helium has been confirmed from LAMP’s spectrograph. Although, the noble gas argon is much fainter than helium to the spectrograph, LAMP will seek this and other gases as well.

John Williams is a science writer and owner of TerraZoom, a Colorado-based web development shop specializing in web mapping and online image zooms. He also writes the award-winning blog, StarryCritters, an interactive site devoted to looking at images from NASA’s Great Observatories and other sources in a different way. A former contributing editor for Final Frontier, his work has appeared in the Planetary Society Blog, Air & Space Smithsonian, Astronomy, Earth, MX Developer’s Journal, The Kansas City Star and many other newspapers and magazines.

Loads of Ice Waiting for Explorers at the Moon’s Shackleton Crater

Shackleton crater on the Moon’s south pole has been somewhat of an enigma, as its permanently shadowed interior has made it difficult to detect what is inside. But with new observations using the laser altimeter on the Lunar Reconnaissance Orbiter (LRO) spacecraft, a team of researchers has essentially illuminated the crater’s interior with laser light, measuring its albedo, or natural reflectance. The scientists found that the crater’s floor is quite bright, an observation consistent with the presence of ice. In fact, ice may make up 22 percent of the material on the crater floor, with possibly more ice embedded within the crater walls.

“We decided we would study the living daylights out of this crater,” said Maria Zuber from the Massachuesetts Institute of Technology, who lead a team to study Shackleton Crater. “From the incredible density of observations we were able to make an extremely detailed topographic map.”

For laser altimeter observations, elevation maps can be created by measuring the time it takes for laser light to bounce down to the Moon’s surface and back to the instrument. The longer it takes, the lower the terrain’s elevation. Using these measurements, the group mapped the crater’s floor and the slope of its walls.

The team used over 5 million measurements to create their detailed map.


While the crater’s floor was relatively bright, Zuber and her colleagues observed that its walls were even brighter. The finding was at first puzzling. Scientists had thought that if ice were anywhere in a crater, it would be on the floor, where no direct sunlight penetrates. The upper walls of Shackleton crater are occasionally illuminated, which could evaporate any ice that accumulates. A theory offered by the team to explain the puzzle is that “moonquakes”– seismic shaking brought on by meteorite impacts or gravitational tides from Earth — may have caused Shackleton’s walls to slough off older, darker soil, revealing newer, brighter soil underneath. Zuber’s team’s ultra-high-resolution map provides strong evidence for ice on both the crater’s floor and walls.

“There may be multiple explanations for the observed brightness throughout the crater,” said Zuber. “For example, newer material may be exposed along its walls, while ice may be mixed in with its floor.”

The crater, named after the Antarctic explorer Ernest Shackleton, is nearly 20 km (more than 12 miles) wide and over 3 km (2 miles) deep — about as deep as Earth’s oceans. Zuber described the crater’s interior as “extremely rugged … It would not be easy to crawl around in there.”

She added that the new topographic map will help researchers understand crater formation and study other uncharted areas of the moon.

“I will never get over the thrill when I see a new terrain for the first time,” Zuber said. “It’s that sort of motivation that causes people to explore to begin with. Of course, we’re not risking our lives like the early explorers did, but there is a great personal investment in all of this for a lot of people.”

Ben Bussey, staff scientist at Johns Hopkins University’s Applied Physics Laboratory, said the new evidence for ice in Shackleton crater may indeed help determine the course for future lunar missions.

“Ice in the polar regions has been sort of an enigmatic thing for some time … I think this is another piece of evidence for the possibility of ice,” Bussey says. “To truly answer the question, we’ll have to send a lunar lander, and these results will help us select where to send a lander.”

And for any humans explorers, a crater like Shackleton at the lunar poles may well be the best location for a base, as the poles contain regions of near-permanent sunlight needed for power, and regions of near-permanent darkness containing ice — both of which would be essential resources for any lunar colony.

The team’s research was published today in the Journal Nature.

Sources: MIT, NASA

Lead image caption: Elevation (left) and shaded relief (right) image of Shackleton, a 21-km-diameter (12.5-mile-diameter) permanently shadowed crater adjacent to the lunar south pole. The structure of the crater’s interior was revealed by a digital elevation model constructed from over 5 million elevation measurements from the Lunar Orbiter Laser Altimeter. Credit: NASA/Zuber, M.T. et al., Nature, 2012

Second image caption: This is an elevation map of Shackleton crater made using LRO Lunar Orbiter Laser Altimeter data. The false colors indicate height, with blue lowest and red/white highest. Credit: NASA/Zuber, M.T. et al., Nature, 2012

Watch 4.5 Billion Years of the Moon’s Evolution in 2.5 Minutes

Over time, our Moon has changed from a glowing ball of magma, to being pummeled and pounded by impacts, to evolving to the current constant companion we see in the sky each night. With the Lunar Reconnaissance Orbiter, we’re getting a better understanding of just what has taken place on the Moon over its history. Thanks to the folks at Goddard’s Scientific Visualization Studio, this video provides a look at 4.5 billion years of the Moon in just two and a half minutes.

Look, It’s a Moon Buggy! LRO’s Best Look Ever at the Apollo 15 Landing Site

Apollo 15 landing site imaged from an altitude of 25 km, allowing the highest resolution view from orbit. The Lunar Roving Vehicle (LRV) is parked to the far right, and the Lunar Module descent stage is in the center, LRV tracks indicated with arrows. Credit: NASA/GSFC/Arizona State University.

[/caption]

A new image from the Lunar Reconnaissance Orbiter’s Narrow Angle Camera provides the most detailed orbital look ever at the Apollo 15 landing site on the Moon. The image of the Hadley plains shows the hardware left behind by astronauts Dave Scott and Jim Irwin and the tracks from the lunar rover.

“We like to look at the Apollo landing site images because it’s fun,” said LRO principal investigator Mark Robinson said at a briefing last year on LRO images. And these latest images are really fun, as look how clearly the lunar lander and the ‘Moon buggy’ show up! (Click images for larger views.) Additionally, we can basically follow all the movements of the rover and the astronauts during their 67-hour stay on the Moon’s surface in August of 1971.

See below for a traverse map of their rover travels.

Apollo 15 traverse routes sketched on an image from LRO. Visible is Hadley Rille. Credit: NASA/GSFC/Arizona State University.

Apollo 15 was the first mission to have the Lunar Rover, which allowed the astronauts to traverse far from the Lunar Module and explore much more local geology than the astronauts on the previous missions (Apollo 11, 12, 14).

“Not only did the LRV allow the astronauts to move from place-to-place at a lively rate of eight to sixteen kilometers per hour (five to ten miles per hour), but the LRV also allowed brief periods of rest that in turn helped to conserve oxygen,” said Robinson on the LROC website.

The goals of Apollo 15 were to sample the basalts in the region, search for ancient crustal rocks and explore a lunar rille for the first time – the long, narrow depressions in the lunar surface that resemble channels. Additionally, Scott and Irwin deployed the third Apollo Lunar Surface Experiments Package (ALSEP), which consisted of several experiments that were powered by a Radioisotope Thermoelectric Generator (RTG) and sent back valuable scientific data to the Earth for over six years after the astronauts left.

Details showing Apollo 15 LRV tracks, see traverse map above for locations. Credit: NASA/GSFC/Arizona State University.

Robinson and his team can figure out the details of what pieces of equipment are in each location by comparing what they see in orbital images to images taken from the surface by the astronauts.

One of the most commonly asked questions is if the flags left on the Moon are still visible.

“All we can really see is the spots where the flag was planted because the astronauts tramped down the regolith,” Robinson said last year. “I’m not sure if the flags still exist, given the extreme heat and cold cycle and the harsh UV environment. The flags were made of nylon, and personally I would be surprised if anything was left of them since it has been over 40 years since they were left on the Moon and the flags we have here on Earth fade after they are left outside for one summer. If the flags are still there they are probably in pretty rough shape.”

For two one-month periods last year (2011), the LRO orbit was lowered such that overflights of the Apollo sites were only 25 to 30 kilometers, rather than the usual 50 kilometers. These low passes resulted in NAC pixel scales near 25 centimeters, Robinson said. “LRO has a ground speed of a bit over 1600 meters (5249 feet) per second, and the shortest NAC exposure time is 0.34 millseconds, so images taken from this low altitude are smeared down track a bit. However, the smear is hardly noticeable and features at the Apollo sites definitely come into sharper focus. In this new low-altitude NAC image of the LRV, tracks are visible about half of the time, usually when the tracks are at an angle to the Sun direction, rather than parallel,” he said.

You can see the close-up images of the Apollo 12, 14 and 17 at a previous article on Universe Today.

Source: LROC website

A ‘Melted’ Moon Makes for Bad Future Landing Sites

Very rough melts show up as red in the mini-RF data (left), but still appear smooth in the corresponding LRO wide angle camera image (right). These impact melts are located just outside Tycho crater, whose rim is visible at the top left. Image Credit Left: Carter et al. Image Credit Right: NASA/GSFC/ASU

[/caption]

The miniature radio frequency (min-RF) radar instrument aboard the Lunar Reconnaissance Orbiter (LRO) is revealing some interesting things about how impact melts form around craters on the Moon. Impacts produce a crater, ejecta (pulverized rock that is thrown around the crater), and melt. A lot is known about craters and ejecta, because they form such spectacular features on the planetary surfaces. But melt is a fairly minor component of the impact process, and so is not as easily observed. Relatively little is therefore known about impact melts. Now, new data from the mini-RF radar instrument is helping to fill this knowledge gap and also offering insight into future landing spots on the Moon.

Radar is an active remote sensing system, meaning it transmits a signal and then records what bounces back, providing information about the surfaces that were encountered. If the transmitted signal hits a smooth surface, then the returned signal will have a polarization direction that is opposite to what was transmitted. But, if the surface is rough, the signal may bounce more than once, switching polarization each time, so the returned polarization will be the same as the transmitted signals. By controlling the polarization of the transmitted signal and monitoring the polarization of the returned signals, researchers can calculate the ratio of same-sense to opposite sense circular polarization, a parameter called CPR. Smooth surfaces will have a low CPR, while rough surfaces will have a high CPR.

Tycho Melt close up view with LROC data
Pressure ridges can be seen in the rough part of this melt, where the underlying fluid pushed the chilled crust and bunched it up like a table cloth. But even the smooth parts of this melt contain numerous bits of rock, which can't be seen at the scale of this LRO narrow angle camera image.
Image credit: NASA/GSFC/Arizona State University.
Click on the image to explore the LROC data from this area in greater detail.

The mini-RF transmits in the radar S band, at wavelengths of 12.6 cm, and so tells us about surface roughness at the 12.6 cm scale. For example, a sandy beach covered with sand grains that are about 1-2 mm in size (much smaller than the transmitted wavelength) will appear smooth to the Mini-RF (have low CPR values). But, a beach covered with hand-sized pebbles (about the size of the transmitted wavelength) will appear rough (have high CPR values). It is important to note that this kind of information is not currently available from our existing image data, which even at its best can only resolve things on the 50 cm scale. Furthermore, the mini-RF radar can penetrate up to 1 m below the surface, providing information about buried surfaces as well.

Working with the mini-RF data, Dr. Lynn Carter and a team of researchers from NASA Goddard Space Flight Centre, Johns Hopkins University, and the Lunar and Planetary Institute have taken a look at impact melts around a variety of craters. They found that impact melt ponds and flows tend to have CPR values that are greater than surrounding non-melt regions. This means that mini-RF data can be used to help find and identify melt materials, including buried ones! From their limited survey, Dr. Carter and her team have found that impact melt ponds and flows are more common on the Moon than was previously known. With more work, they will be able to better catalogue the number and size of melt ponds and flows around lunar craters, improving our understanding of how much melt is produced by impacts and how it travels.

Dr. Carter and her team also found that, within individual melt ponds or flows, roughness values can vary. Rough surfaces may represent bunching up of a partially cooled crust as it is pushed by the still fluid melt underneath. Such pressure ridges are seen in terrestrial lava flows. Smooth surfaces may represent melts that cooled quickly, or the last melts to arrive at a pond (and so not subject to pushing from more inflowing melt). But, even the “smooth” melts, which appear quite flat in visual imagery, tend to have very high CPR values, indicating that they are, in fact, very rough. There is probably a lot of solid rock and ejecta debris (something we can’t see in the currently available imagery) entrained in the melt material to make them so rough at this scale. To understand what this kind of surface might look like, we can consider terrestrial a’a flows (which are actually slightly less rough than lunar melts).

This work has important implications for future lunar exploration. Imagine how difficult landing on a surface as rugged at an a’a flow would be. This is why site selection scientists work very hard at identifying smooth areas for spacecraft to land. However, if surfaces that look extremely smooth in visual imagery are actually rough like an a’a flow, this can present a problem. Mini-RF data could be helpful in identifying such rough regions and eliminating them from consideration.

Even "smooth" impact melt flows are rougher than this a'a flow, produced by the Kamoamoa fissure eruption in Hawaii. Image Credit: U.S. Department of Interior, U.S. Geological Survey.

Source: Initial observations of lunar impact melts and ejecta flows with the Mini-RF radar, Carter et al., Journal of Geophysical Research V117, 2012, doi:10.1029/2011JE003911.

Recent Geologic Activity on the Moon?

Newly detected series of narrow linear troughs are known as graben, and they formed in highland materials on the lunar farside. These graben are located on a topographic rise with several hundred meters of relief revealed in topography derived from Lunar Reconnaissance Orbiter Camera (LROC) Narrow Angle Camera (NAC) stereo images (blues are lower elevations and reds are higher elevations). Image Credit: NASA/GSFC/Arizona State University/Smithsonian Institution

[/caption]
Recent images from NASA’s Lunar Reconnaissance Orbiter Camera provide evidence that the lunar crust may be pulling apart in certain areas. The images reveal small trenches less than a kilometer in length, and less than a few hundred meters wide. Only a small number of these features, known as graben, have been discovered on the lunar surface.

There are several clues in the high-resolution images that provide evidence for recent geologic activity on the Moon.

The LROC team detected signs of contraction on the lunar surface as early as August of 2010. The contractions were in the form of lobe-shaped ridges known as lobate scarps. Based on the data, the team suggests the widely-distributed scarps indicate the Moon shrank in diameter, and may be continuing to shrink. Interestingly enough, the new image data featuring graben presents a contradiction, as they indicate lunar crust being pulled apart and theorize that the process that created the graben may have occurred within the past 50 million years.

“We think the Moon is in a general state of global contraction due to cooling of a still hot interior, said thomas Watters from the Center for Earth and Planetary Studies. “The graben tell us that forces acting to shrink the Moon were overcome in places by forces acting to pull it apart. This means the contractional forces shrinking the Moon cannot be large, or the small graben might never form.”

Based on the size of the graben, the forces responsible for contraction of the lunar surface are assumed to be fairly weak. It is further theorized that, unlike the early terrestrial planets, the Moon was not completely molten during its early history.

“It was a big surprise when I spotted graben in the farside highlands,” said Mark Robinson, LROC Principal Investigator at Arizona State University. “I immediately targeted the area for high resolution stereo images so we could create a 3-dimensional view of the graben. It’s exciting when you discover something totally unexpected. Only about half the lunar surface has been imaged in high resolution. There is much more of the Moon to be explored.”

If you’d like to learn more about the recently discovered graben on the moon, you can watch a short video by Thomas Watters below:

To learn more about the Lunar Reconnaissance Orbiter Camera, visit: http://www.lroc.asu.edu/

Source: Arizona State University News

A Wrinkled Moon

Wrinkle Ridge South of Plato
Wrinkle ridges, like this one in the northern part of Mare Imbrium, were studied using telescopic observations, as early as the 1880's. Data from the Apollo era refined our understanding of these interesting features. More recently, data from the Lunar Reconnaissance Orbiter Camera is calling that understanding into question. Image credit: NASA/GSFC/Arizona State University and the author Click on the image to explore the LROC data from this area in greater detail

[/caption]

Wrinkle ridges have been seen on the surface of the Moon for over a century. Studies of these interesting features began as early as 1885, with telescopic photographs, and continued beyond the Apollo era, with satellite and lander observations. Scientists thought they understood them, but the latest images from the Lunar Reconnaissance Orbital Camera (LROC) suggest we may not know the whole story.

By definition, wrinkle ridges are narrow, steep-sided ridges that form predominantly in volcanic regions. They are very complex features, which can be either straight or curved, or even be braided and zig-zagged. Their width can be anything from less than 1 km to over 20 km. And their heights range from a few meters (say the height of an average room) to 300 meters (about the height of a 100-story sky scraper). They are also asymmetric, with one side of the ridge being higher than the other. Often, these things sit on top of a gentle swell in the landscape. Features like this have been found on a number of planets throughout the Solar System, including the Moon, Mars, Mercury, and Venus.


Wrinkle Ridge South of Plato
Wrinkle ridges, like this one in the northern part of Mare Imbrium, were studied using telescopic observations, as early as the 1880's. Data from the Apollo era refined our understanding of these interesting features. More recently, data from the Lunar Reconnaissance Orbiter Camera is calling that understanding into question.

Image credit: NASA/GSFC/Arizona State University and the author
 Click on the image to explore the LROC data from this area in greater detail

The earliest researchers of lunar wrinkle ridges saw them through telescopes. When looking at the terminator (the line between the dark side and the lit side of the Moon), the angle of the Sun causes spectacular shadows to highlight the topography, allowing these otherwise subtle features to be seen. Scientists in the late 19th century believed that these wrinkle ridges, which were found predominantly in the volcanic mare regions, formed when the cooling magma shrank. The chilled crust at the very top of this magma body was now too large, and wrinkles had to form to accommodate the difference. This process was often compared to the wrinkled skin of a shriveled apple, or the skin on our hands as we age.

The dawn of the space age introduced orbiting satellites, which circled the Moon collecting images that were more detailed than had been possible ever before. Data from the 1960’s the Lunar Orbiter (LO) program, whose mission was to photograph the Moon in preparation for the Apollo missions, showed many more of these wrinkle ridge features.

Some researchers felt the LO data pointed to a volcanic origin for wrinkle ridges. They saw lava flows emanating from the wrinkle ridges and embaying impact craters. They suggested that lava flowed to the surface along linear fractures that exploited zones of weakness in the lunar crust (presumably, these weaknesses formed when impacts created the basins that lunar mare occupy). Lava that extruded onto the surface formed the wrinkle ridge features, while magma that intruded below the surface formed the regional swell the ridges sit on.

The Apollo missions, however, were able to provide information about what was happening below the surface, with the Apollo Lunar Sounder Experiment (ALSE). Data collected over a wrinkle ridge in the southeastern portion of Mare Serenitatis showed that there was some kind of topographic structure beneath the thin mare layers in this area. This suggested that wrinkle ridges were the surface expressions of thrust faults in the underlying crust. This interpretation was appealing because it explained why some wrinkle ridges are found outside of mare areas.


Bulging Wrinkle Ridge in Tsiolkovskiy Mare
Wrinkle ridges are generally steep-sided, asymmetric structures, displaying complex braiding or zig-zag patterns. This wrinkle ridge, in the northern mare of Tsiolkovskiy crater, is very different. Described as "bulging", it has a gently curved uniform shape. It is also much smaller than the wrinkle ridges seen before. This unusual wrinkle ridge suggests we may not understand the formation of these features as well as we thought.

Image credit: NASA/GSFC/Arizona State University
 Click on the image to learn more about this discovery from NASA's LROC team.

Later, studies of wrinkle-like features on Earth refined our understanding of how these features form. Now the thinking is that wrinkle ridges form by tectonic buckling of the mare areas and their surroundings. When mare lavas are extruded on the surface of the Moon, they fill up the impact basins in a series of basalt layers. The thinned crust left by the basin-forming process can’t support the weight of the mare, so the entire structure sags. The mare layer can become decoupled from the underlying regolith (the “soil” layer that impacts created between the time the basin was formed and when the first mare lavas extruded) and slide towards the sagging centre. As it does so, it bunches up in places where the decoupling is not complete. This creates a series of thrust faults at the base of the mare layer, which show up as wrinkle ridges at the surface. This decoupling process is more pronounced for thinner mare layers, which explains why we often see wrinkle ridges at the edges of a mare.

Recent findings from the Lunar Reconnaissance Orbiter Camera (LROC) may challenge this current understanding of wrinkle ridge formation. LROC images from the mare in Tsiolkovskiy crater have identified wrinkle ridges that are considerably different from the ones seen before. For one, these wrinkle ridges are not asymmetrical in profile, but have a uniformly curved shape. Also, they are much smaller, measuring less than 100 meters in width, as opposed to the 1-20 km widths seen for other wrinkle ridges.

It remains to be seen if these new wrinkle ridges will again change our understanding of how these enigmatic features form. The discovery of these particular ridges is so new that there is nothing yet published about them! Perhaps this image and others like it will help us learn more about these enigmatic features and answer questions such as: does this new wrinkle ridge represent the beginnings of their formation process and that all such ridges started out so small and symmetrical? Or maybe we’ll find that they are extrusions of particularly viscous lava, which have barely protruded above the surface along a linear fault.

Scientists plan to target this area for further data acquisition, because only more data from LRO and further research will help solve the mysteries of the wrinkled Moon.

ASU Researchers Propose Looking for Ancient Alien Artifacts on the Moon

The "Blair Cuspids" spires photographed by Lunar Orbiter 2 in 1966. Credit: NASA

[/caption]

Two researchers at Arizona State University (ASU) have made a rather controversial proposal: have the public and other researchers study the high-resolution photographs of the Moon already being taken by the Lunar Reconnaissance Orbiter (LRO), to look for anomalies that may possibly be evidence of artifacts leftover from previous alien visitation. The theory is that if our solar system had been visited in the past, the Moon would have made an ideal base from which to study the Earth. The paper has just been recently published in the journal Acta Astronautica.

Professor Paul Davies and research technician Robert Wagner admit that the chances of success are very small, but argue that the endeavour would be worth the minimal investment required. The photographs are already being taken on a regular basis by LRO. Any interesting finds could be examined by others including imaging professionals. Shape-recognizing software could also be used to help discern any possible artificial artifacts from natural ones.

From the abstract:

The Search for Extraterrestrial Intelligence (SETI) has a low probability of success, but it would have a high impact if successful. Therefore it makes sense to widen the search as much as possible within the confines of the modest budget and limited resources currently available. To date, SETI has been dominated by the paradigm of seeking deliberately beamed radio messages.

However, indirect evidence for extraterrestrial intelligence could come from any incontrovertible signatures of non-human technology. Existing searchable databases from astronomy, biology, earth and planetary sciences all offer low-cost opportunities to seek a footprint of extraterrestrial technology. In this paper we take as a case study one particular new and rapidly-expanding database: the photographic mapping of the Moon’s surface by the Lunar Reconnaissance Orbiter (LRO) to 0.5 m resolution. Although there is only a tiny probability that alien technology would have left traces on the moon in the form of an artifact or surface modification of lunar features, this location has the virtue of being close, and of preserving traces for an immense duration.

Systematic scrutiny of the LRO photographic images is being routinely conducted anyway for planetary science purposes, and this program could readily be expanded and outsourced at little extra cost to accommodate SETI goals, after the fashion of the SETI@home and Galaxy Zoo projects.

Of course, it has been said by some that such artifacts have already been found and known about for decades but hidden from the public by NASA, et al. An entire cottage industry has grown around this idea. There are actually a handful of anomalies from various missions that would be interesting to see at much higher resolution via LRO, such as the well-known “Blair Cuspids” photographed by Lunar Orbiter 2 in 1966, although by far most unusual-looking objects are easily explained. It’s the same problem as with Mars; so many anomalies found by amateur observers are the product of pareidolia, lighting effects, image defects or even geology. Separating out any genuine anomalies from all of the noise would be a tedious and time-consuming task. On the other hand, we now have much better cameras in orbit around the Moon (and Mars) and more advanced photographic analysis techniques available.

Yes, the chances of finding anything are very small, maybe even nonexistent in the opinion of some, but if we have the images being taken anyway, and the willingness of some to study them, then why not? If nothing is found, no harm done. It something was found, well that’s another story entirely…

The abstract for the paper is here. (The paper itself costs $31.50 US to download).