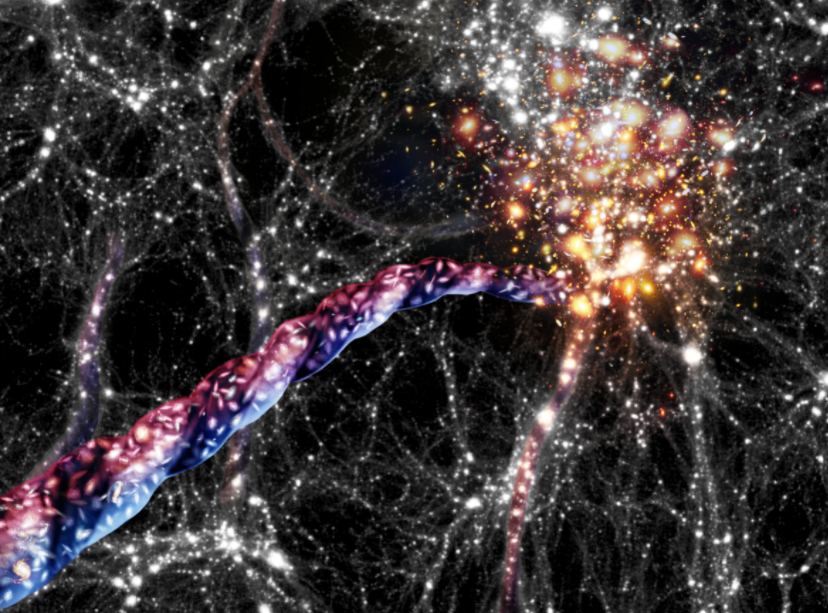
Artist’s impression of cosmic filaments: huge bridges of galaxies and dark matter connect clusters of galaxies to each other. Galaxies are funnelled on corkscrew like orbits towards and into large clusters that sit at their ends. Their light appears blue-shifted when they move towards us, and red-shifted when they move away. Credit: AIP/ A. Khalatyan/ J. Fohlmeister
We’ve known for a while about the large-scale structure of the Universe. Galaxies reside in filaments hundreds of millions of light-years long, on a backbone of dark matter. And, where those filaments meet, there are galaxy clusters. Between them are massive voids, where galaxies are sparse. Now a team of astronomers in Germany and their colleagues in China and Estonia have made an intriguing discovery.
These massive filaments are rotating, and this kind of rotation on such a massive scale has never been seen before.
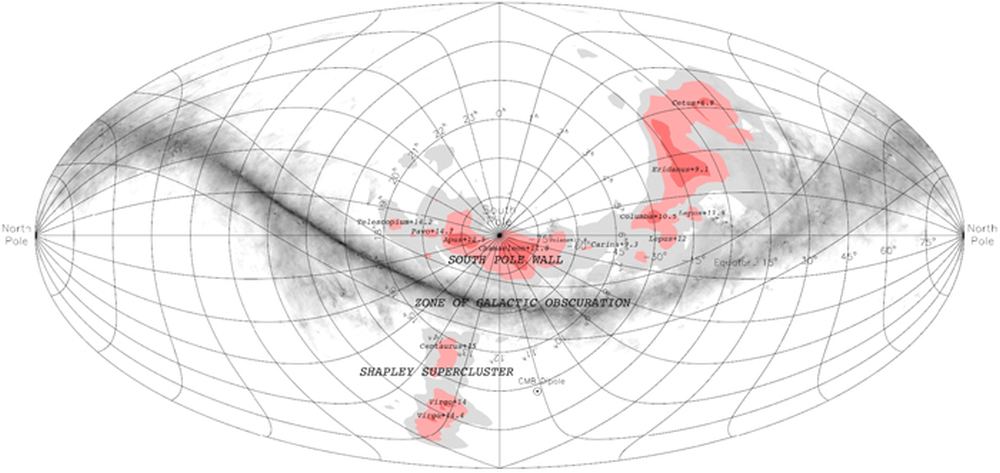
A projection of the South Pole Wall in celestial coordinates. Image Credit: Pomarède et al, 2020.
Galaxies aren’t spread evenly throughout space. They exist in groups, clusters, and superclusters. Our own Milky Way galaxy exists in an impossibly vast structure called the Laniakea supercluster. Laniakea was defined in 2014, and it contains over 100,000 galaxies.
Now a team of astronomers have discovered another immense feature beyond Laniakea, called the South Pole Wall.
Image of the large-scale structure of the Universe, showing filaments and voids within the cosmic structure. The latest FLAMINGO simulation provide more detail about the evolution of the Universe. Credit: Millennium Simulation Project
Matter in the Universe is not distributed equally. It’s dominated by super-clusters and the filaments of matter that string them together, surrounded by huge voids. Galaxy super-clusters are at the top of the hierarchy. Inside those is everything else: galaxy groups and clusters, individual galaxies, and solar systems. This hierarchical structure is called the “Cosmic Web.”
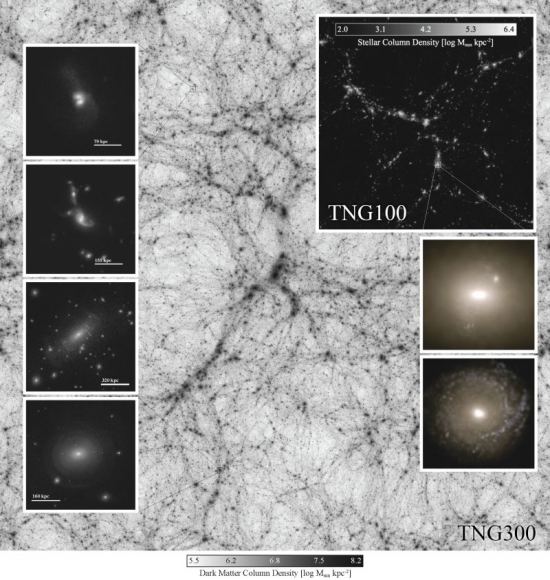
IllustrisTNG is a new simulation model for the Universe. It used over 24,000 processors over the course of more than two months to produce the largest hydrodynamic simulation project to date for the emergence of cosmic structures. Image: IllustrisTNG
The first results of the IllustrisTNG Project have been published in three separate studies, and they’re shedding new light on how black holes shape the cosmos, and how galaxies form and grow. The IllustrisTNG Project bills itself as “The next generation of cosmological hydrodynamical simulations.” The Project is an ongoing series of massive hydrodynamic simulations of our Universe. Its goal is to understand the physical processes that drive the formation of galaxies.
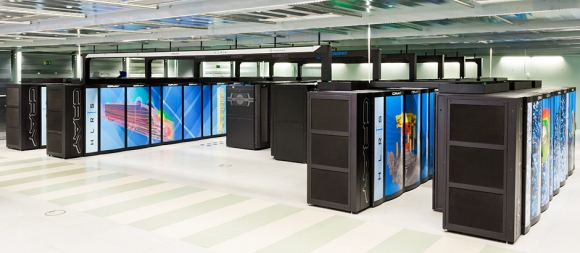
At the heart of IllustriousTNG is a state of the art numerical model of the Universe, running on one of the most powerful supercomputers in the world: the Hazel Hen machine at the High-Performance Computing Center in Stuttgart, Germany. Hazel Hen is Germany’s fastest computer, and the 19th fastest in the world.
The Hazel Hen Supercomputer is based on Intel processors and Cray network technologies. Image: IllustrisTNG
Our current cosmological model suggests that the mass-energy density of the Universe is dominated by dark matter and dark energy. Since we can’t observe either of those things, the only way to test this model is to be able to make precise predictions about the structure of the things we can see, such as stars, diffuse gas, and accreting black holes. These visible things are organized into a cosmic web of sheets, filaments, and voids. Inside these are galaxies, which are the basic units of cosmic structure. To test our ideas about galactic structure, we have to make detailed and realistic simulated galaxies, then compare them to what’s real.
Astrophysicists in the USA and Germany used IllustrisTNG to create their own universe, which could then be studied in detail. IllustrisTNG correlates very strongly with observations of the real Universe, but allows scientists to look at things that are obscured in our own Universe. This has led to some very interesting results so far, and is helping to answer some big questions in cosmology and astrophysics.
How Do Black Holes Affect Galaxies?
Ever since we’ve learned that galaxies host supermassive black holes (SMBHs) at their centers, it’s been widely believed that they have a profound influence on the evolution of galaxies, and possibly on their formation. That’s led to the obvious question: How do these SMBHs influence the galaxies that host them? Illustrious TNG set out to answer this, and the paper by Dr. Dylan Nelson at the Max Planck Institute for Astrophysics shows that “the primary driver of galaxy color transition is supermassive blackhole feedback in its low-accretion state.”
“The only physical entity capable of extinguishing the star formation in our large elliptical galaxies are the supermassive black holes at their centers.” – Dr. Dylan Nelson, Max Planck Institute for Astrophysics,
Galaxies that are still in their star-forming phase shine brightly in the blue light of their young stars. Then something changes and the star formation ends. After that, the galaxy is dominated by older, red stars, and the galaxy joins a graveyard full of “red and dead” galaxies. As Nelson explains, “The only physical entity capable of extinguishing the star formation in our large elliptical galaxies are the supermassive black holes at their centers.” But how do they do that?
Nelson and his colleagues attribute it to supermassive black hole feedback in its low-accretion state. What that means is that as a black hole feeds, it creates a wind, or shock wave, that blows star-forming gas and dust out of the galaxy. This limits the future formation of stars. The existing stars age and turn red, and few new blue stars form.
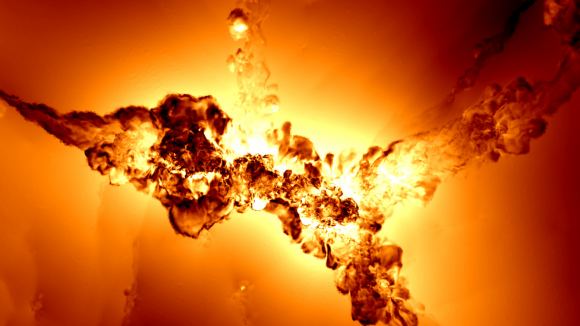
This is a rendering of gas velocity in a massive galaxy cluster in IllustrisTNG. Black areas are hardly moving, and white areas are moving at greater than 1000km/second. The black areas are calm cosmic filaments, the white areas are near super-massive black holes (SMBHs). The SMBHs are blowing away the gas and preventing star formation. Image: IllustrisTNG
How Do Galaxies Form and How Does Their Structure Develop?
It’s long been thought that large galaxies form when smaller galaxies join up. As the galaxy grows larger, its gravity draws more smaller galaxies into it. During these collisions, galaxies are torn apart. Some stars will be scattered, and will take up residence in a halo around the new, larger galaxy. This should give the newly-created galaxy a faint background glow of stellar light. But this is a prediction, and these pale glows are very hard to observe.
“Our predictions can now be systematically checked by observers.” – Dr. Annalisa Pillepich (Max Planck Institute for Astrophysics)
IllustrisTNG was able to predict more accurately what this glow should look like. This gives astronomers a better idea of what to look for when they try to observe this pale stellar glow in the real Universe. “Our predictions can now be systematically checked by observers,” Dr. Annalisa Pillepich (MPIA) points out, who led a further IllustrisTNG study. “This yields a critical test for the theoretical model of hierarchical galaxy formation.”
A composite image from IllustrisTNG. Panels on the left show galaxy-galaxy interactions and the fine-grained structure of extended stellar halos. Panels on the right show stellar light projections from two massive central galaxies at the present day. It’s easy to see how the light from massive central galaxies overwhelms the light from stellar halos. Image: IllustrisTNG
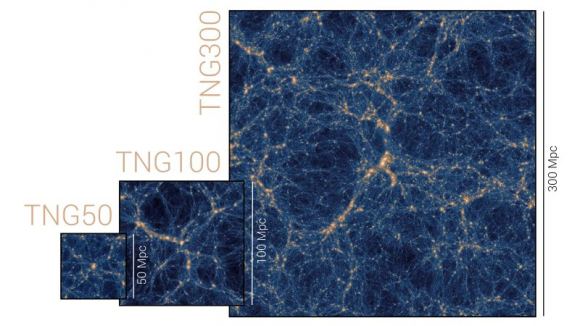
IllustrisTNG is an on-going series of simulations. So far, there have been three IllustrisTNG runs, each one creating a larger simulation than the previous one. They are TNG 50, TNG 100, and TNG 300. TNG300 is much larger than TNG50 and allows a larger area to be studied which reveals clues about large-scale structure. Though TNG50 is much smaller, it has much more precise detail. It gives us a more detailed look at the structural properties of galaxies and the detailed structure of gas around galaxies. TNG100 is somewhere in the middle.
TNG 50, TNG 100, and TNG 300. Image: IllustrisTNG
IllustrisTNG is not the first cosmological hydrodynamical simulation. Others include Eagle, Horizon-AGN, and IllustrisTNG’s predecessor, Illustris. They have shown how powerful these predictive theoretical models can be. As our computers grow more powerful and our understanding of physics and cosmology grow along with them, these types of simulations will yield greater and more detailed results.
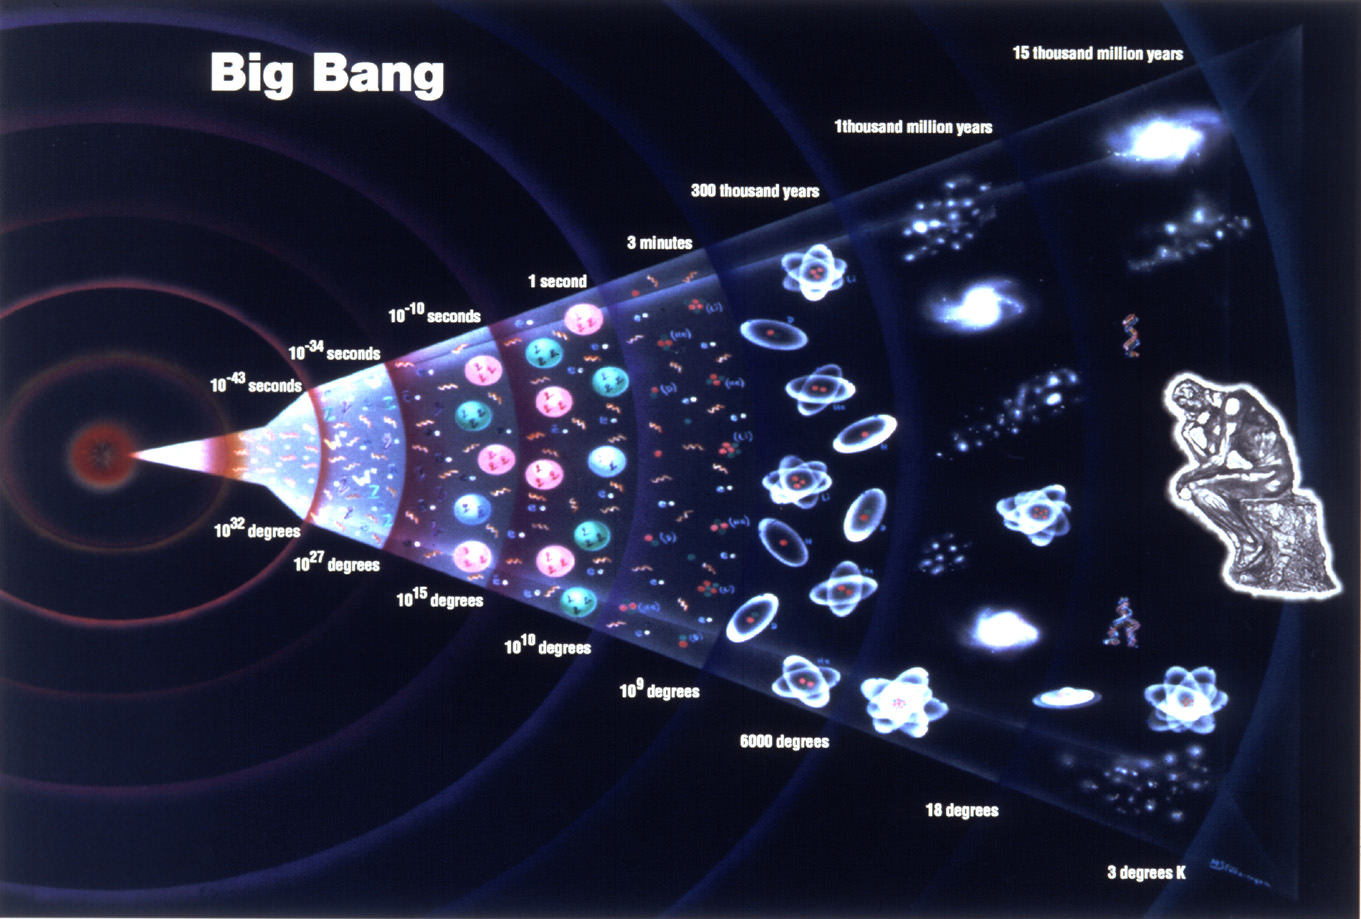
The Big Bang Theory: A history of the Universe starting from a singularity and expanding ever since. Credit: grandunificationtheory.com
How was our Universe created? How did it come to be the seemingly infinite place we know of today? And what will become of it, ages from now? These are the questions that have been puzzling philosophers and scholars since the beginning the time, and led to some pretty wild and interesting theories. Today, the consensus among scientists, astronomers and cosmologists is that the Universe as we know it was created in a massive explosion that not only created the majority of matter, but the physical laws that govern our ever-expanding cosmos. This is known as The Big Bang Theory.
For almost a century, the term has been bandied about by scholars and non-scholars alike. This should come as no surprise, seeing as how it is the most accepted theory of our origins. But what exactly does it mean? How was our Universe conceived in a massive explosion, what proof is there of this, and what does the theory say about the long-term projections for our Universe?
The basics of the Big Bang theory are fairly simple. In short, the Big Bang hypothesis states that all of the current and past matter in the Universe came into existence at the same time, roughly 13.8 billion years ago. At this time, all matter was compacted into a very small ball with infinite density and intense heat called a Singularity. Suddenly, the Singularity began expanding, and the universe as we know it began.
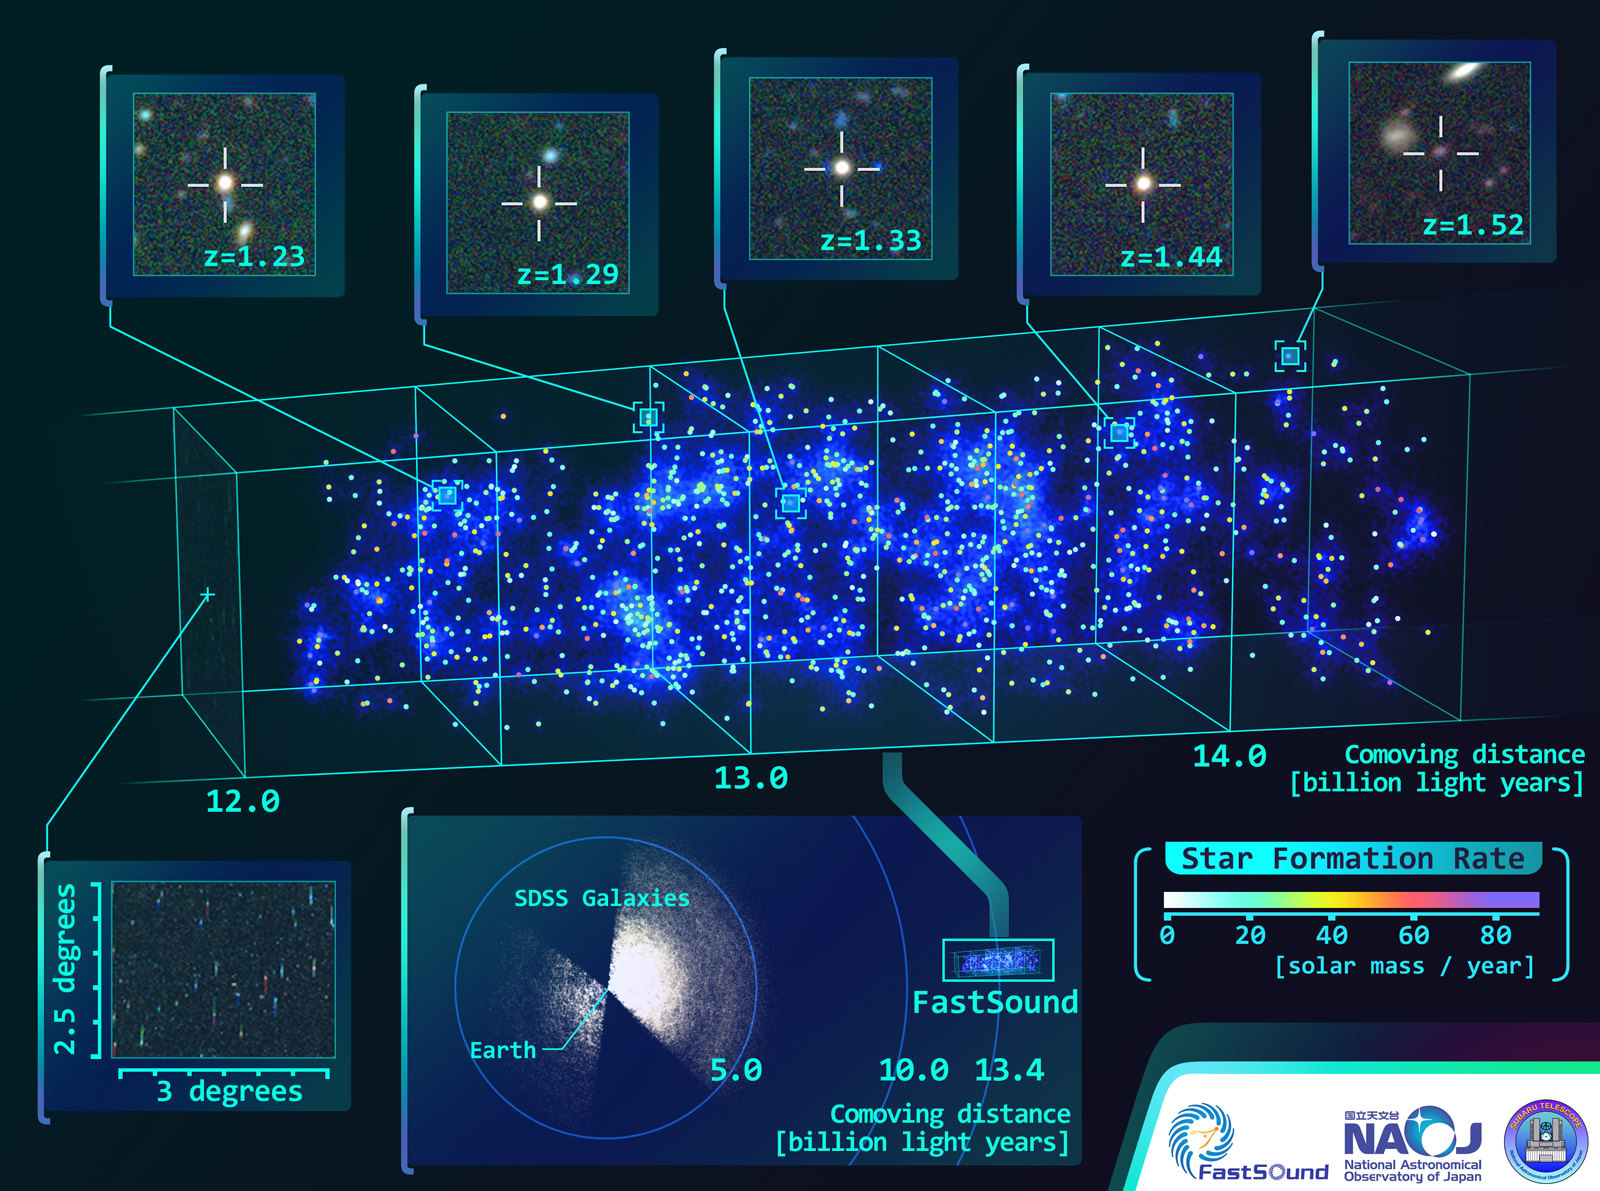
The FastSound project's 3D map of the large-scale structure of a region in the Universe about 4.7 billion years after the Big Bang. This area covers 2.5 times 3 degrees of the sky, with a radial distance spanning 12-14.5 billion light years in comoving distance or 8-9.6 billion light years in light travel distance. Credit: NAOJ, SDSS, CFHT.
I remember seeing the Hubble 3-D IMAX movie in 2010 and literally gasping when the view pulled back from zooming into distant stars and galaxies to show clusters and superclusters of galaxies interwoven like a web, creating the large scale structure of the Universe. In 3-D, the structure looks much like the DNA double helix or a backbone.
Now, a new project that aims to map the Universe’s structure has looked back in time to create a 3-D map showing a portion of the Universe as it looked nine billion years ago. It shows numerous galaxies and interestingly, already-developed large-scale structure of filaments and voids made from galaxy groups.
The map was created by the FastSound project, which is surveying galaxies in the Universe using the Subaru Telescope’s new Fiber Multi-Object Spectrograph (FMOS). The team doing the work is from Kyoto University, the University of Tokyo and the University of Oxford.
The team said that although they can see that the clustering of galaxies is not as strong back when the Universe was 4.7 billion years old as it is in the present-day Universe, gravitational interaction will eventually result in clustering that grows to the current level.
The new map spans 600 million light years along the angular direction and two billion light years in the radial direction. The team will eventually survey a region totaling about 30 square degrees in the sky and then measure precise distances to about 5,000 galaxies that are more than ten billion light years away.
But the FastSound project hopes to create a 3-D map of the very distant Universe by covering the volume of the Universe farther than ten billion light years away. FMOS is a wide-field spectroscopy system that enables near-infrared spectroscopy of over 100 objects at a time, with an exceptionally wide field of view when combined with the light collecting power of the 8.2 meter primary mirror of the telescope.
The map released today is just the first from FastSound. The final 3-D map of the distant Universe will precisely measure the motion of galaxies and then measure the rate of growth of the large-scale structure as a test of Einstein’s general theory of relativity.
Although scientists know that the expansion of the Universe is accelerating, they do not know why – whether it is from dark energy or whether gravity on cosmological scales may differ from that of general relativity, this mystery is one of the biggest questions in contemporary physics and astronomy. A comparison of the 3D map of the young Universe with the predictions of general relativity could eventually reveal the mechanism for the mysterious acceleration of the Universe.
The team said their 3-D map shown in this release uses a measure of “comoving” distance rather than light travel distance. They explained:
Light travel distance refers to the time that has elapsed from the epoch of the observed distant galaxy to the present, multiplied by the speed of light. Since the speed of light is always constant for any observer, it describes the distance of the path that a photon has traveled. However, the expansion of the Universe increases the length of the path that the photon traveled in the past. Comoving distance, the geometrical distance in the current Universe, takes this effect into account. Therefore, comoving distance is always larger than the corresponding light travel distance.
In the lead image above from FastSound, the colors of the galaxies indicate their star formation rate, i.e., the total mass of stars produced in a galaxy every year. The gradation in background color represents the number density of galaxies; the underlying mass distribution (which is dominated by invisible dark matter that accounts for about 30% of the total energy in the Universe) and how it would look like this if we could see it. The lower part of the figure shows the relative locations of the FastSound and the Sloan Digital Sky Survey (SDSS) regions, indicating that the FastSound project is mapping a more distant Universe than SDSS’s 3D map of the nearby Universe.