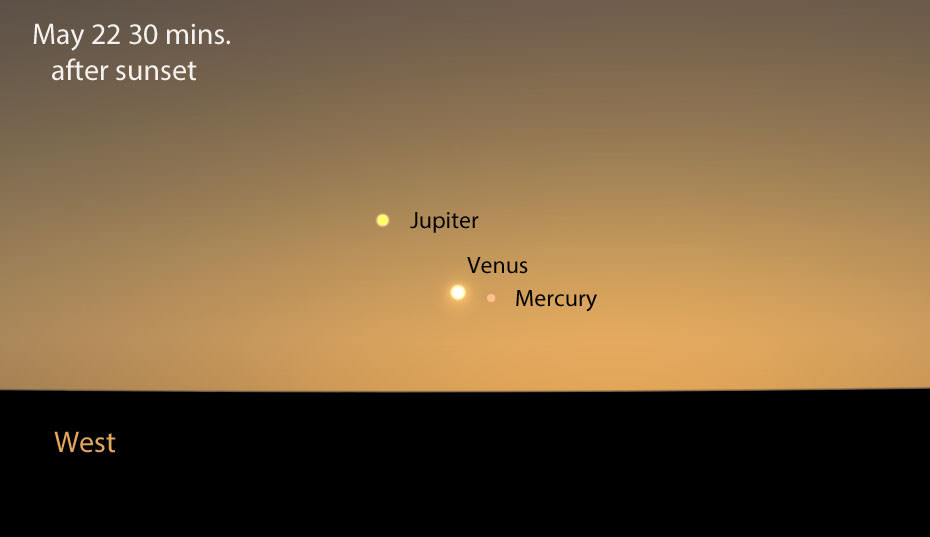
Three bright planets gather in the northwestern sky this week. This map shows the sky 30 minutes after sunset from the middle latitudes. Stellarium
Planning a barbecue this weekend? You may want to top it off with a look at three bright planets shuttling about the western sky at dusk. Jupiter, Venus and Mercury gather for nearly a week of delightful alignments including three separate conjunctions staring right now. Mercury and Venus pair up on Friday; Mercury and Jupiter on Sunday and Venus and Jupiter on Monday. All three form a series of ever-changing triangular arrangements as the nights go by.
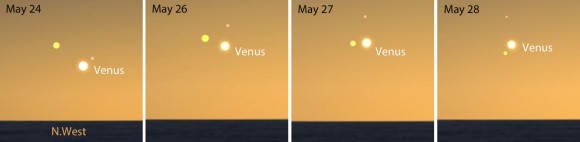
Three bright planets will highlight the northwestern sky this week and early next. Mercury is shown in pink and Jupiter in yellow. Time is 30 minutes after sunset facing northwest. They’ll be closest together – less than 3 degrees apart – on the night of the 26th. Stellarium
Brightest of the bunch is Venus followed by Jupiter and then Mercury. The key to seeing them all is a clear sky and unobstructed view of the west-northwest horizon. Best time for viewing is a half hour to 45 minutes after sunset. Although the diagrams make the planets look like largish disks, difference in size is a device to show their brightness. Bigger means brighter.
Mercury gradually climbs higher in the coming days, Venus will remain in nearly the same spot and Jupiter slowly drops off toward the horizon. Seeing three planets bunch up isn’t rare, but it is unusual – all the more reason to go for a look if your skies are clear. Alignments like this occur because all 8 planets lie in essentially the same flat plane. As we look across the solar system, sometimes near planets and far planets lie along the same line of sight and appear side-by-side in the sky. They may look close to each other but of course they’re millions of miles apart.
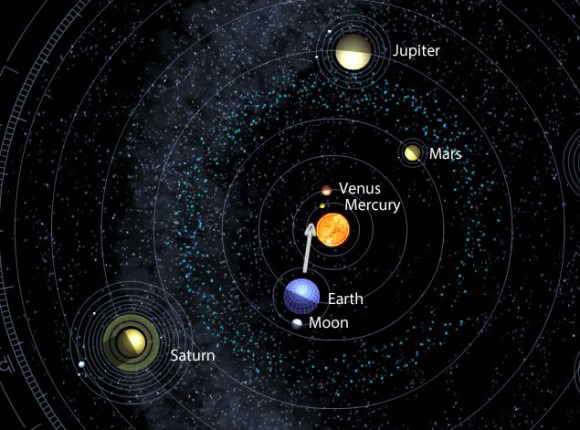
Positions of the planets on May 27. The arrow shows the point of view from Earth. Notice that the line of sight through all three takes our gaze near the sun. That’s why they’re only visible shortly after sunset in a bright sky. Click image to see a cool, interactive planet display. Credit: dd.dynamicdiagrams.com
This week Venus is 154 million miles (248 million km) from Earth, Mercury 113 million (182 million km) and Jupiter a distant 562 million (904 million km). The planet position diagram above will give you a sense of their current arrangement in space.
Whenever you go planet-seeking in bright twilight, I always recommend bringing along a pair of binoculars. They penetrate haze and make finding these bright little dots much easier. Enjoy the show!
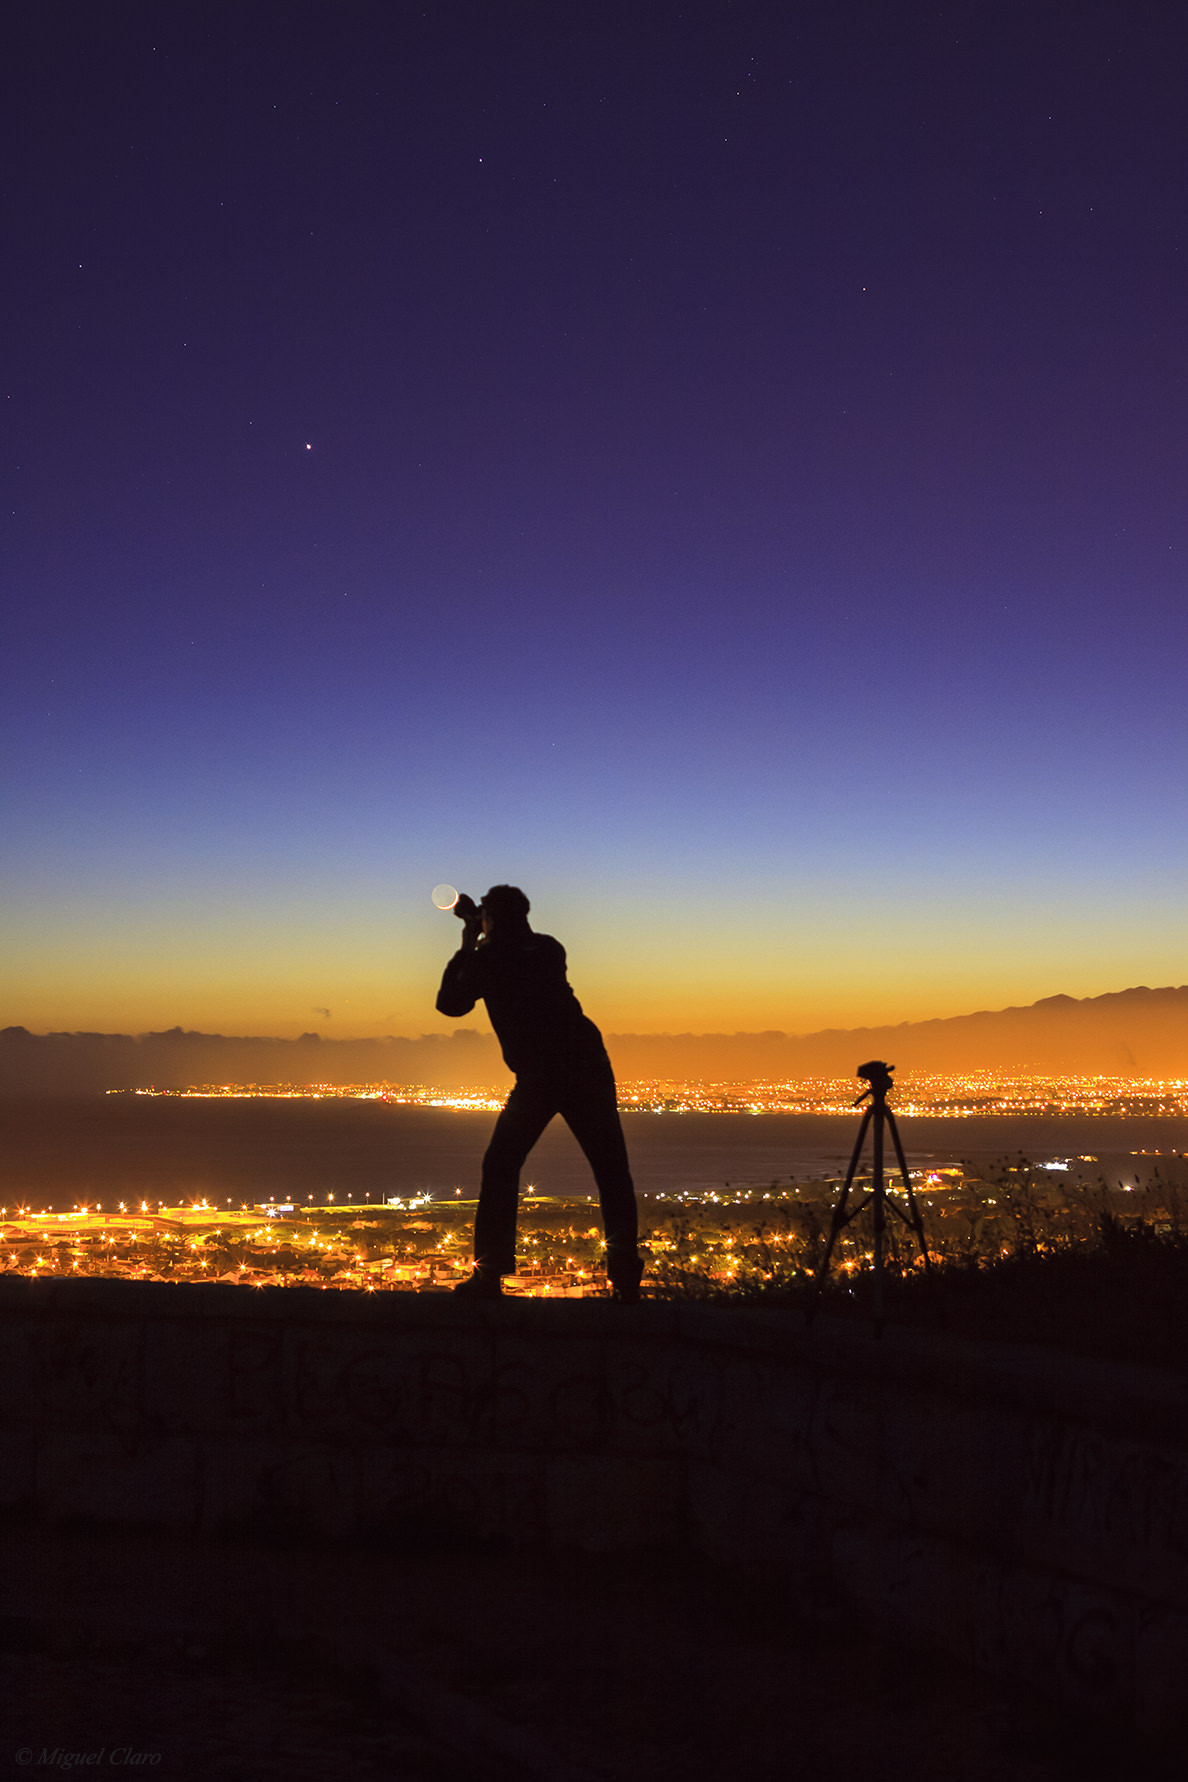
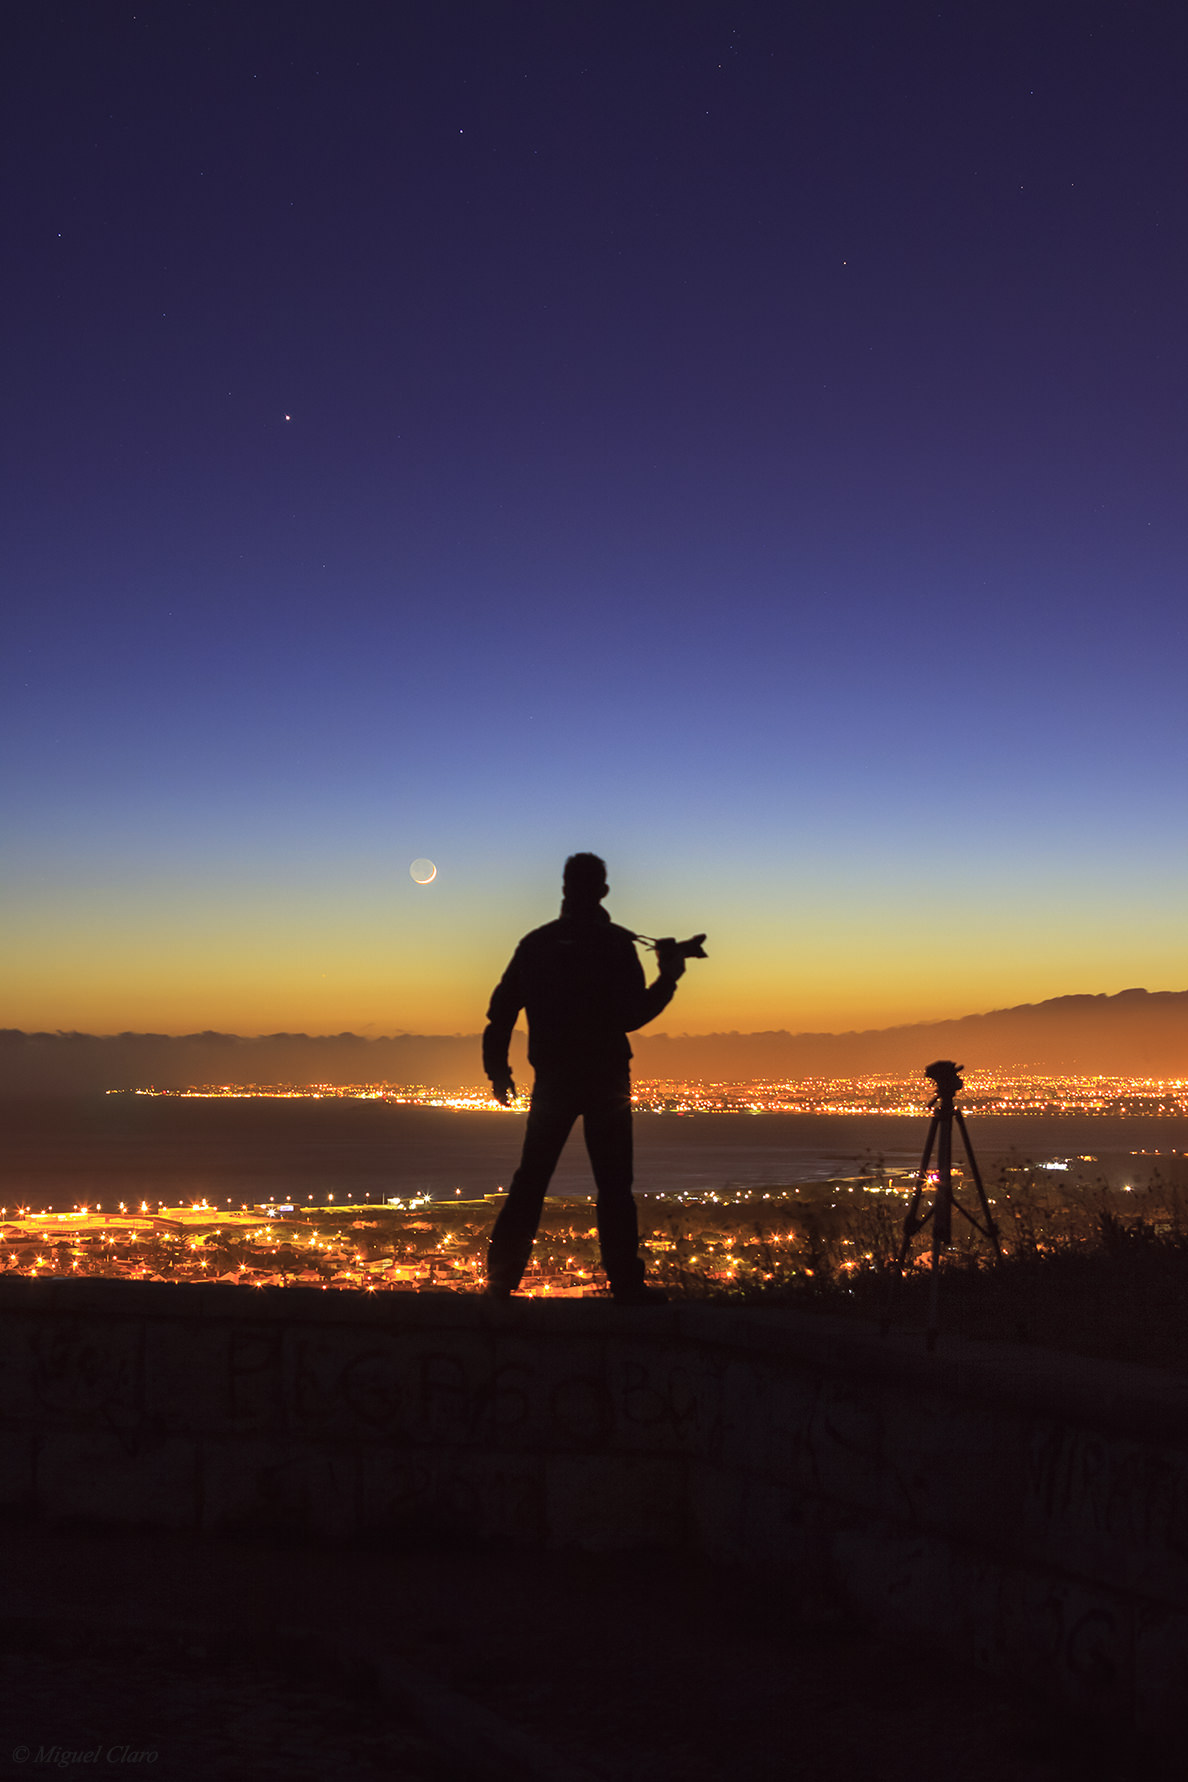
A 'macro' shot of the crescent Moon? Photographer Miguel Claro appears to be taking a closeup shot of the crescent Moon, with an added Earthshine effect. Jupiter joins the scene as the brightest 'star' in the sky. Credit and copyright: Miguel Claro.
This very creative self-portrait by astrophotographer Miguel Claro shows what appears to be the photographer taking a ‘macro’ closeup of the crescent Moon! But there is a lot more going on in this image. The crescent Moon has just 3% of the disc illuminated by the Sun, but there is a stunningly bright Earthshine effect visible. This image was taken on May 11, 2013, so there is a conjunction between the Moon and Jupiter (the brightest star in the image). Venus was also in conjunction, but at the time this image was taken, it was covered by the cloudy band low on the horizon.
Another shot below:
A silhouette of photographer Miguel Claro along with the crescent Moon and Jupiter. Credit and copyright: Miguel Claro.
Images taken from Capuchos, Almada, Portugal with a Canon 50D – ISO400; Exp. 2sec. F/4; 35mm, on May 11, 2013 at 21:41 and 21:43. Enjoy more of Claro’s images at his website.
Want to get your astrophoto featured on Universe Today? Join our Flickr group or send us your images by email (this means you’re giving us permission to post them). Please explain what’s in the picture, when you took it, the equipment you used, etc.
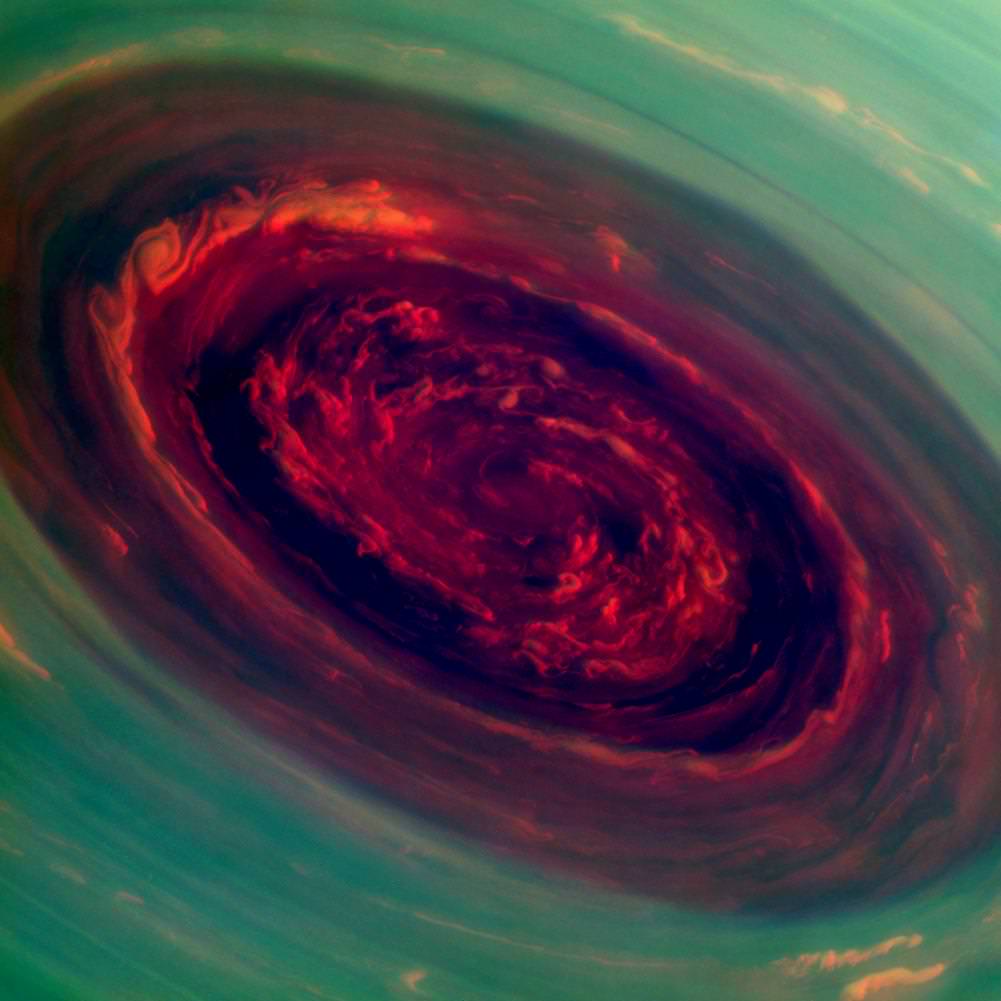
A false-color image, taken by the Cassini spacecraft, of a huge hurricane at Saturn's north pole. Credit: NASA/JPL-Caltech/SSI
Checking out the above pictures of a Saturn hurricane, one can’t help but wonder: how close was the Cassini spacecraft to spiralling down into gassy nothingness?
These dizzying images of a hurricane on Saturn, of course, came as the spacecraft zoomed overhead at a safe distance. NASA’s goal in examining this huge hurricane is to figure out its mechanisms and to compare it to what happens on our home planet.
Hurricanes on Earth munch on water vapor to keep spinning. On Saturn, there’s no vast pool of water to draw from, but there’s still enough water vapor in the clouds to help scientists understand more about how hurricanes on Earth begin, and continue.
“We did a double take when we saw this vortex because it looks so much like a hurricane on Earth,” stated Andrew Ingersoll, a Cassini imaging team member at the California Institute of Technology in Pasadena. “But there it is at Saturn, on a much larger scale, and it is somehow getting by on the small amounts of water vapor in Saturn’s hydrogen atmosphere.”
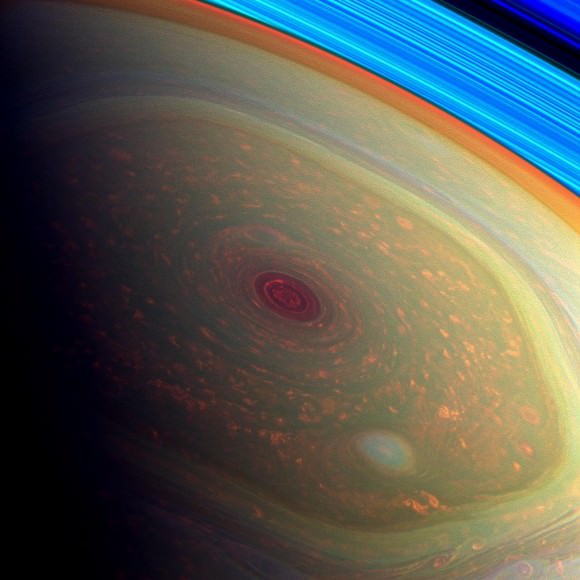
A false-color view of Saturn’s storm, as seen through Cassini’s wide-angle camera. You can see the eye in dark red, the jet stream in yellowish-green, and low-lying clouds in orange. The blue bands at the edge are Saturn’s rings. Credit: NASA/JPL-Caltech/SSI
There’s one big change in hurricane activity you’d observe if suddenly shifted from Earth to Saturn: this behemoth — 1,250 miles (2,000 kilometers) wide, about 20 times its Earthly counterparts — spins a heckuva lot faster.
In the eye, winds in the wall speed more than four times faster than what you’d find on Earth. The hurricane also sticks around at the north pole. On Earth, hurricanes head north (and eventually dissipate) due to wind forces generated by the planet’s rotation.
“The polar hurricane has nowhere else to go, and that’s likely why it’s stuck at the pole,” stated Kunio Sayanagi, a Cassini imaging team associate at Hampton University in Hampton, Va.
Cassini initially spotted the storm in 2004 through its heat-seeking infrared camera, when the north pole was shrouded in darkness during winter.
The spacecraft first caught the storm in visible light in 2009, when NASA controllers altered Cassini’s orbit so that it could view the poles.
Saturn, of course, is not the only gas giant in the solar system with massive hurricanes. Jupiter’s Great Red Spot has been raging since before humans first spotted it in the 1600s. It appears to be shrinking, and could become circular by 2040.
Neptune also has hurricanes that can reach speeds of 1,300 miles (2,100 kilometers) an hour despite its cold nature; it even had a Great Dark Spot spotted during Voyager’s flypast in 1989 that later faded from view. Uranus, which scientists previously believed was quiet, is a pretty stormy place as well.
Check out this YouTube video for more details on how Saturn’s storm works.
This five-frame sequence of images from NASA's New Horizons mission captures the giant plume from Io's Tvashtar volcano in March, 2007. Credit: NASA/Johns Hopkins University Applied Physics Laboratory/Southwest Research Institute.
Jupiter’s moon Io features at least 400 active volcanoes, making it the most volcanically active world in our Solar System. However, the location of the volcanoes on Io just doesn’t match up with scientific models that predict how the moon’s interior is heated.
“Rigorous statistical analysis of the distribution of volcanoes in the new global geologic map of Io,” said Christopher Hamilton of the University of Maryland, College Park and the Goddard Spaceflight Center. “We found a systematic eastward offset between observed and predicted volcano locations that can’t be reconciled with any existing solid body tidal heating models.”
Io’s internal heat is created by the tidal forces inflicted from the giant planet Jupiter on one side and from two neighboring moons that orbit further from Jupiter – Europa and Ganymede on the other.
Researchers say there are questions about how this tidal heating affects the moon’s interior. Some propose it heats up the deep interior, but the prevailing view is that most of the heating occurs within a relatively shallow layer under the crust, called the asthenosphere. The asthenosphere is where rock behaves like putty, slowly deforming under heat and pressure.
“Our analysis supports the prevailing view that most of the heat is generated in the asthenosphere, but we found that volcanic activity is located 30 to 60 degrees East from where we expect it to be,” said Hamilton.
On Earth, a simple explanation how volcanoes are created is that when tectonic plates shift in such a way, the subsurface magma is able to flow onto the surface. On Io, the tidal forces from Jupiter actually force Io’s surface to bulge up and down by as much as 100 m, causing magma to flow continuously.
The scientists explained the tug-of-war between Jupiter’s massive gravity and the smaller but precisely timed pulls from two neighboring moons like this:
Io orbits faster than these other moons, completing two orbits every time Europa finishes one, and four orbits for each one Ganymede makes. This regular timing means that Io feels the strongest gravitational pull from its neighboring moons in the same orbital location, which distorts Io’s orbit into an oval shape. This in turn causes Io to flex as it moves around Jupiter.
For example, as Io gets closer to Jupiter, the giant planet’s powerful gravity deforms the moon toward it and then, as Io moves farther away, the gravitational pull decreases and the moon relaxes. The flexing from gravity causes tidal heating — in the same way that you can heat up a spot on a wire coat hanger by repeatedly bending it, the flexing creates friction in Io’s interior, which generates the tremendous heat that powers the moon’s extreme volcanism.
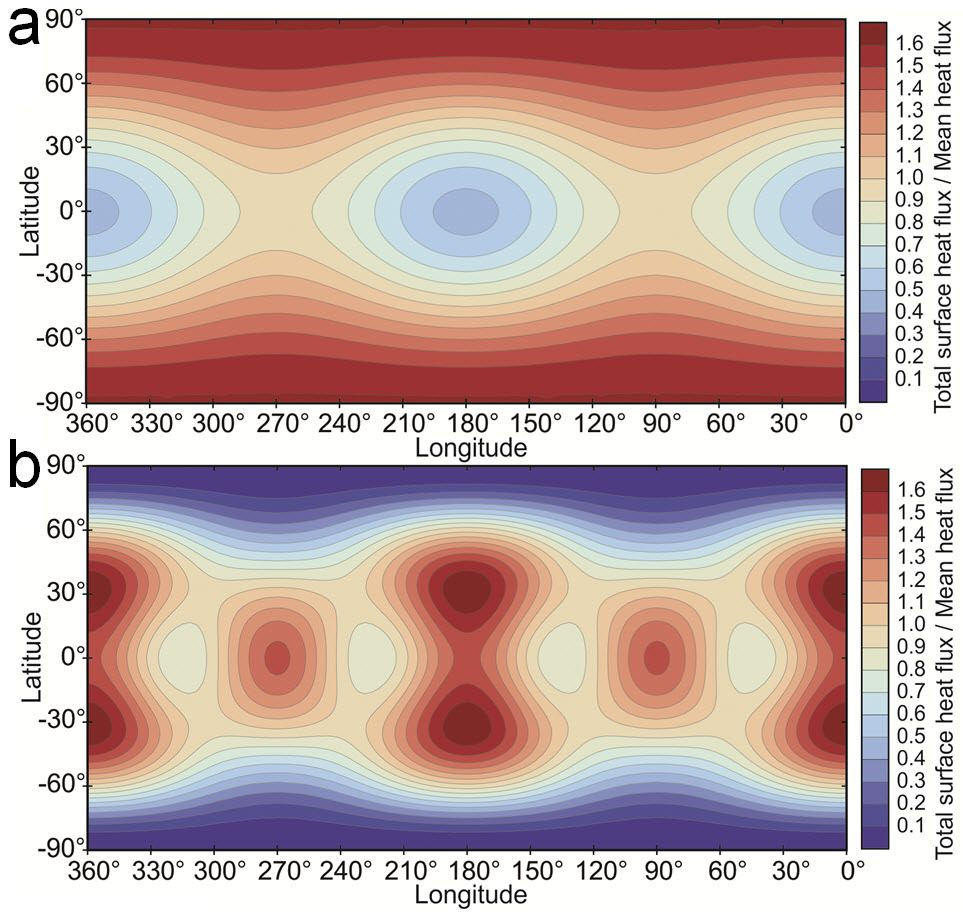
This is a map of the predicted heat flow at the surface of Io from different tidal heating models. Red areas are where more heat is expected at the surface while blue areas are where less heat is expected. Figure A shows the expected distribution of heat on Io’s surface if tidal heating occurred primarily within the deep mantle, and figure B is the surface heat flow pattern expected if heating occurs primarily within the asthenosphere. In the deep mantle scenario, surface heat flow concentrates primarily at the poles, whereas in the asthenospheric heating scenario, surface heat flow concentrates near the equator. Credit: NASA/Christopher Hamilton.
But a new geologic map of Io showed the offset of the volcanoes from where the model predicted them to be.
Possibilities to explain the offset include a faster than expected rotation for Io, an interior structure that permits magma to travel significant distances from where the most heating occurs to the points where it is able erupt on the surface, or a missing component in existing tidal heating models, like fluid tides from an underground magma ocean, according to the team.
The magnetometer instrument on NASA’s Galileo mission detected a magnetic field around Io, suggesting the presence of a global subsurface magma ocean. As Io orbits Jupiter, it moves inside the planet’s vast magnetic field. Researchers think this could induce a magnetic field in Io if it had a global ocean of electrically conducting magma.
“Our analysis supports a global subsurface magma ocean scenario as one possible explanation for the offset between predicted and observed volcano locations on Io,” says Hamilton. “However, Io’s magma ocean would not be like the oceans on Earth. Instead of being a completely fluid layer, Io’s magma ocean would probably be more like a sponge with at least 20 percent silicate melt within a matrix of slowly deformable rock.”
Tidal heating is also thought to be responsible for oceans of liquid water likely to exist beneath the icy crusts of Europa and Saturn’s moon Enceladus. Since liquid water is a necessary ingredient for life, some researchers propose that life might exist in these subsurface seas if a useable energy source and a supply of raw materials are present as well. These worlds are far too cold to support liquid water on their surfaces, so a better understanding of how tidal heating works may reveal how it could sustain life in otherwise inhospitable places throughout the Universe.
“The unexpected eastward offset of the volcano locations is a clue that something is missing in our understanding of Io,” says Hamilton. “In a way, that’s our most important result. Our understanding of tidal heat production and its relationship to surface volcanism is incomplete. The interpretation for why we have the offset and other statistical patterns we observed is open, but I think we’ve enabled a lot of new questions, which is good.”
Io’s volcanism is so extensive that it gets completely resurfaced about once every million years or so, actually quite fast compared to the 4.5-billion-year age of the solar system. So in order to know more about Io’s past, we have to understand its interior structure better, because its surface is too young to record its full history, according to Hamilton.
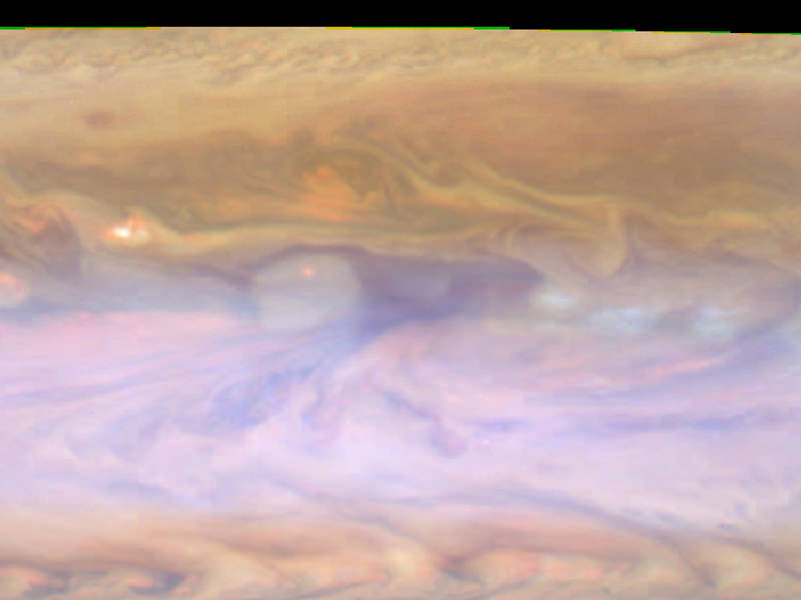
The dark hot spot in this false-color image from NASA's Cassini spacecraft is a window deep into Jupiter's atmosphere. All around it are layers of higher clouds, with colors indicating which layer of the atmosphere the clouds are in. Image credit: NASA/JPL-Caltech/SSI/GSFC
In the swirling canopy of Jupiter’s atmosphere, cloudless patches are so exceptional that the big ones get the special name “hot spots.” Exactly how these clearings form and why they’re only found near the planet’s equator have long been mysteries. Now, using images from NASA’s Cassini spacecraft, scientists have found new evidence that hot spots in Jupiter’s atmosphere are created by a Rossby wave, a pattern also seen in Earth’s atmosphere and oceans. The team found the wave responsible for the hot spots glides up and down through layers of the atmosphere like a carousel horse on a merry-go-round.
“This is the first time anybody has closely tracked the shape of multiple hot spots over a period of time, which is the best way to appreciate the dynamic nature of these features,” said the study’s lead author, David Choi, a NASA Postdoctoral Fellow working at NASA’s Goddard Space Flight Center in Greenbelt, Md. The paper is published online in the April issue of the journal Icarus.
Choi and his colleagues made time-lapse movies from hundreds of observations taken by Cassini during its flyby of Jupiter in late 2000, when the spacecraft made its closest approach to the planet. The movies zoom in on a line of hot spots between one of Jupiter’s dark belts and bright white zones, roughly 7 degrees north of the equator. Covering about two months (in Earth time), the study examines the daily and weekly changes in the sizes and shapes of the hot spots, each of which covers more area than North America, on average.
Much of what scientists know about hot spots came from NASA’s Galileo mission, which released an atmospheric probe that descended into a hot spot in 1995. This was the first, and so far only, in-situ investigation of Jupiter’s atmosphere.
“Galileo’s probe data and a handful of orbiter images hinted at the complex winds swirling around and through these hot spots, and raised questions about whether they fundamentally were waves, cyclones or something in between,” said Ashwin Vasavada, a paper co-author who is based at NASA’s Jet Propulsion Laboratory in Pasadena, Calif., and who was a member of the Cassini imaging team during the Jupiter flyby. “Cassini’s fantastic movies now show the entire life cycle and evolution of hot spots in great detail.”
Because hot spots are breaks in the clouds, they provide windows into a normally unseen layer of Jupiter’s atmosphere, possibly all the way down to the level where water clouds can form. In pictures, hot spots appear shadowy, but because the deeper layers are warmer, hot spots are very bright at the infrared wavelengths where heat is sensed; in fact, this is how they got their name.
One hypothesis is that hot spots occur when big drafts of air sink in the atmosphere and get heated or dried out in the process. But the surprising regularity of hot spots has led some researchers to suspect there is an atmospheric wave involved. Typically, eight to 10 hot spots line up, roughly evenly spaced, with dense white plumes of cloud in between. This pattern could be explained by a wave that pushes cold air down, breaking up any clouds, and then carries warm air up, causing the heavy cloud cover seen in the plumes. Computer modeling has strengthened this line of reasoning.
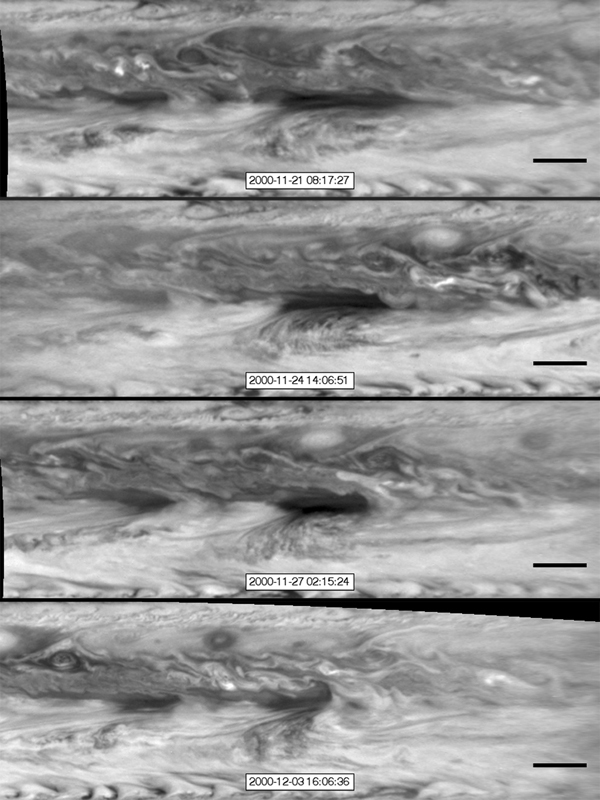
In this series of images from NASA’s Cassini spacecraft, a dark, rectangular hot spot (top) interacts with a line of vortices that approaches from on the upper-right side (second panel). Image credit: NASA/JPL-Caltech/SSI/GSFC
From the Cassini movies, the researchers mapped the winds in and around each hot spot and plume, and examined interactions with vortices that pass by, in addition to wind gyres, or spiraling vortices, that merge with the hot spots. To separate these motions from the jet stream in which the hot spots reside, the scientists also tracked the movements of small “scooter” clouds, similar to cirrus clouds on Earth. This provided what may be the first direct measurement of the true wind speed of the jet stream, which was clocked at about 300 to 450 mph (500 to 720 kilometers per hour) — much faster than anyone previously thought. The hot spots amble at the more leisurely pace of about 225 mph (362 kilometers per hour).
By teasing out these individual movements, the researchers saw that the motions of the hot spots fit the pattern of a Rossby wave in the atmosphere. On Earth, Rossby waves play a major role in weather. For example, when a blast of frigid Arctic air suddenly dips down and freezes Florida’s crops, a Rossby wave is interacting with the polar jet stream and sending it off its typical course. The wave travels around our planet but periodically wanders north and south as it goes.
The wave responsible for the hot spots also circles the planet west to east, but instead of wandering north and south, it glides up and down in the atmosphere. The researchers estimate this wave may rise and fall 15 to 30 miles (24 to 50 kilometers) in altitude.
The new findings should help researchers understand how well the observations returned by the Galileo probe extend to the rest of Jupiter’s atmosphere. “And that is another step in answering more of the questions that still surround hot spots on Jupiter,” said Choi.
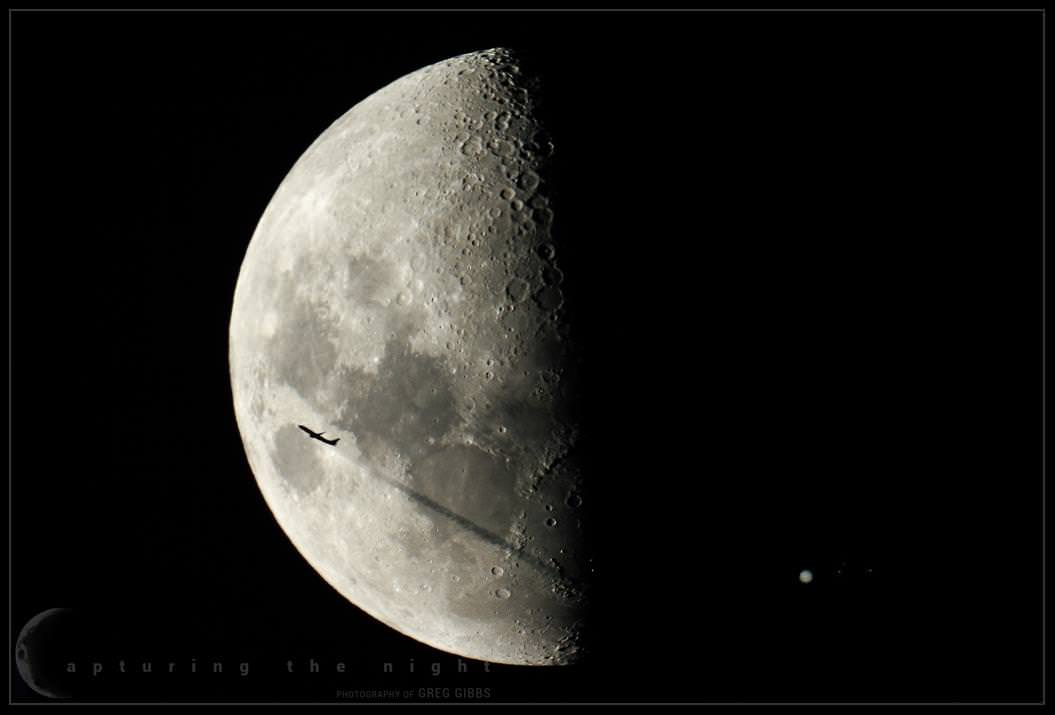
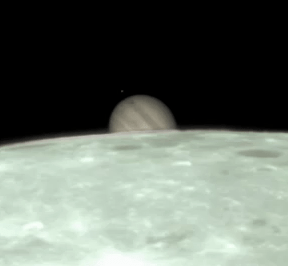
'Fly Me to the Moons' -- a view of the Moon with Jupiter and the four Galilean moons, along with a passing airplane. Credit and copyright: Greg Gibbs.
“No matter how much you plan and prepare,” said photographer Greg Gibbs, “sometimes you just have to be very lucky.”
As we mentioned last week, Jupiter and the Moon were going to have a close encounter in the sky on February 18, with an occultation visible in some areas. And so Gibbs was preparing to get shots of the occultation through his telescope from his location in Victoria, Australia, and was using an automated timer to get shots at about 10 second intervals But then he noticed lights from a plane coming close to the Moon.
“I realised that there was a chance that it would pass in front of the Moon,” he said, “so I quickly canceled the remote timer I was using to take the shots and instead started shooting high speed continuous frames. I managed to get this plane crossing the moon in five individual frames just as Jupiter was about to be occulted by The Moon.”
This final product, as Gibbs notes on his Facebook page, is a two image composite. The Moon, Jupiter and the plane are all one single image. Then he took an overexposed image to bring up the Galilean Moons of (from left to right) Io, Callisto and Europa. At the time of this shot, Ganymede had already been occulted by The Moon.
There’s the old saying, “If you can’t be good, be lucky…”
This shot may have been lucky, but it sure is good, too!
Want to get your astrophoto featured on Universe Today? Join our Flickr group or send us your images by email (this means you’re giving us permission to post them). Please explain what’s in the picture, when you took it, the equipment you used, etc.
Captured on camera by astrophotographer Rafael Defavari from his location in São Bernardo do Campo, Brazil, this video shows the Moon passing in front of Jupiter during an occultation event on December 25, 2012. Nice work!
The video plays at 5x actual speed.
Although Jupiter appeared to be “right next to” the Moon on Christmas night from our viewpoint here on Earth, in reality the two worlds were 388 million miles (625 million km) apart. The Moon blocked the view of the giant planet for a full hour and ten minutes.
‘Tis the season for lunar occultations, too… the last one occurred on November 28, and the next will be on January 22, 2013.
See more photos of the Dec. 25 event from viewers in Brazil here.
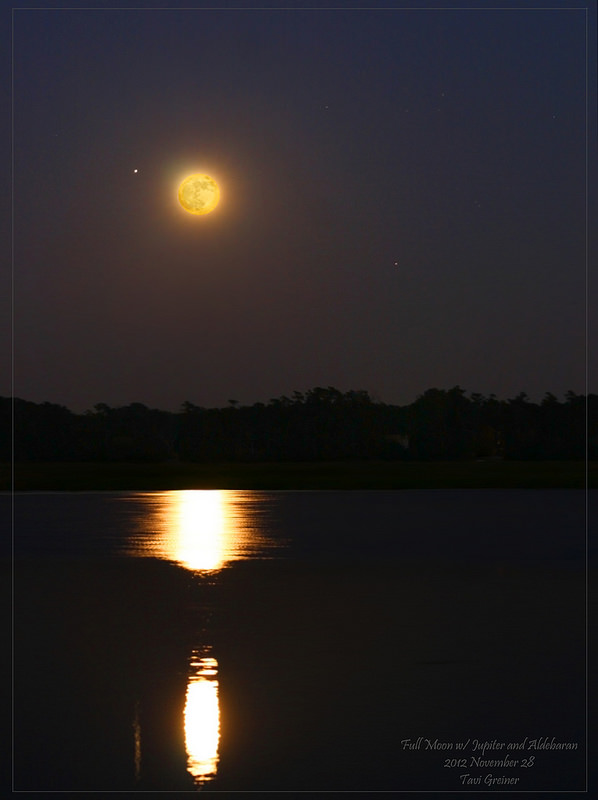
The full Moon rising with Jupiter and Aldebaran on November 28, 2012 in North Carolina, USA. Credit: Tavi Greiner.
The full Moon is a-rising tonight, and it is not alone. There are lots of other bright and beautiful stars and planets out there — some snuggling right up together — and already we’ve got astrophotographers out there capturing the views. Above, Tavi Greiner had a gorgeous view of the Moon, along with bright Jupiter and Aldebaran. November’s full Moon is known as the “Beaver Moon,” or “Frosty Moon,” and this year it is the smallest full Moon of 2012, since the Moon is at apogee, the farthest distance in its orbit around the Earth. There was also a penumbral lunar eclipse earlier today, depending on where you are…
See more below:
The Moon, along with Jupiter and its moons. Credit: Kevin Gassen
“This is a composite of two images of the Moon and Jupiter, taken in Central Texas, November 28th, with my Canon T2i,” writes Kevin Gassen. “The images were taken less than a minute apart, one each with the proper settings to capture the moon and Jupiter as seen. The images were combined in Photoshop Elements 6 with only minor contrast adjustments to the moon. Relative sizes were unchanged.”
Moon – Jupiter Conjunction, November 28, 2012. Credit: Gustavo Sanchez
Speaking of bright Jupiter, here’s a great view of the giant planet in all its glory near the Moon.
Corona around the Full Moon November 27, 2012. (The Pleiades are in amongst the clouds, too). Credit: Sculptor Lil
Visibility of penumbral lunar eclipse of November 28, 2012. Image Credit: Fred Espenak
The penumbral eclipse of the Moon occurred during the early dawn on Wednesday morning for western North America, and during the middle of the night for the longitudes of Australia and Japan, in late evening of the 28th local date for China and Southeast Asia, and early that evening for India. Eastern Canada and the USA couldn’t see it at all as it occurred after Moonset.
Saturn, Venus, & Mercury Conjunction on 11-28-2012. Credit: John Chumack
And early this morning John Chumack was out to capture a plethora of planets together. Saturn, Venus, and Mercury Conjunction – Planetary Alignment on 11-28-2012 06:39am E.S.T. Venus is the brightest between the house and tree , Saturn right above Venus, and Mercury is below in between the power lines.
We’ll add more images as they come in!
And if you want to know when the next full Moon is coming up, check out our Phases of the Moon app on either Google Play or the iTunes Store, and help support Universe Today.
Want to get your astrophoto featured on Universe Today? Join our Flickr group or send us your images by email (this means you’re giving us permission to post them). Please explain what’s in the picture, when you took it, the equipment you used, etc.
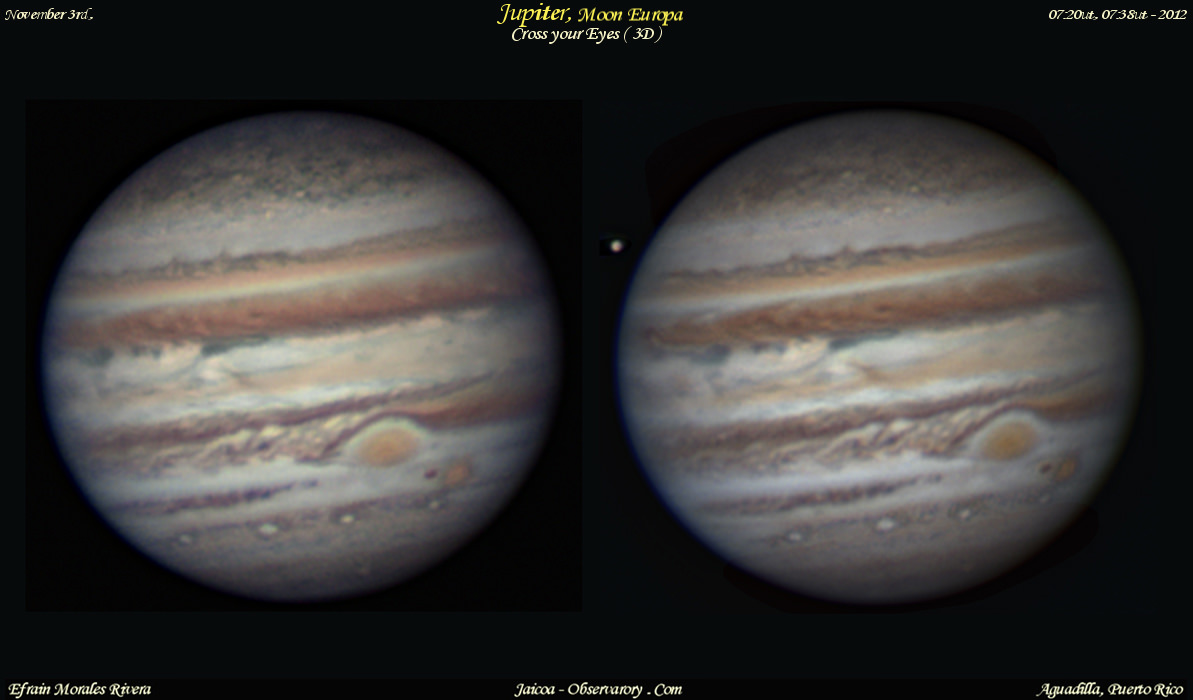
Here’s a recent view of Jupiter, with its moon Europa just coming into view from behind the planet, as seen by Efrain Morales of the Jaicoa Observatory in Puerto Rico. Why two images? This is a different way to see it in 3-D — just focus on the center between the 2 images and kind of cross your eyes. Not everyone can see the effect, but its pretty cool when it works. Click the image for a larger version.
Efrain took the image on November 4th, at 07:20 UTC. Also visible are the Great Red Spot and Oval Ba transiting across the Jovian disk.
Equipment: LX200ACF 12 in. OTA, CGE mount, Flea3 Ccd, TeleVue 3x barlows, Astronomik RGB filter set.
Want to get your astrophoto featured on Universe Today? Join our Flickr group or send us your images by email (this means you’re giving us permission to post them). Please explain what’s in the picture, when you took it, the equipment you used, etc.
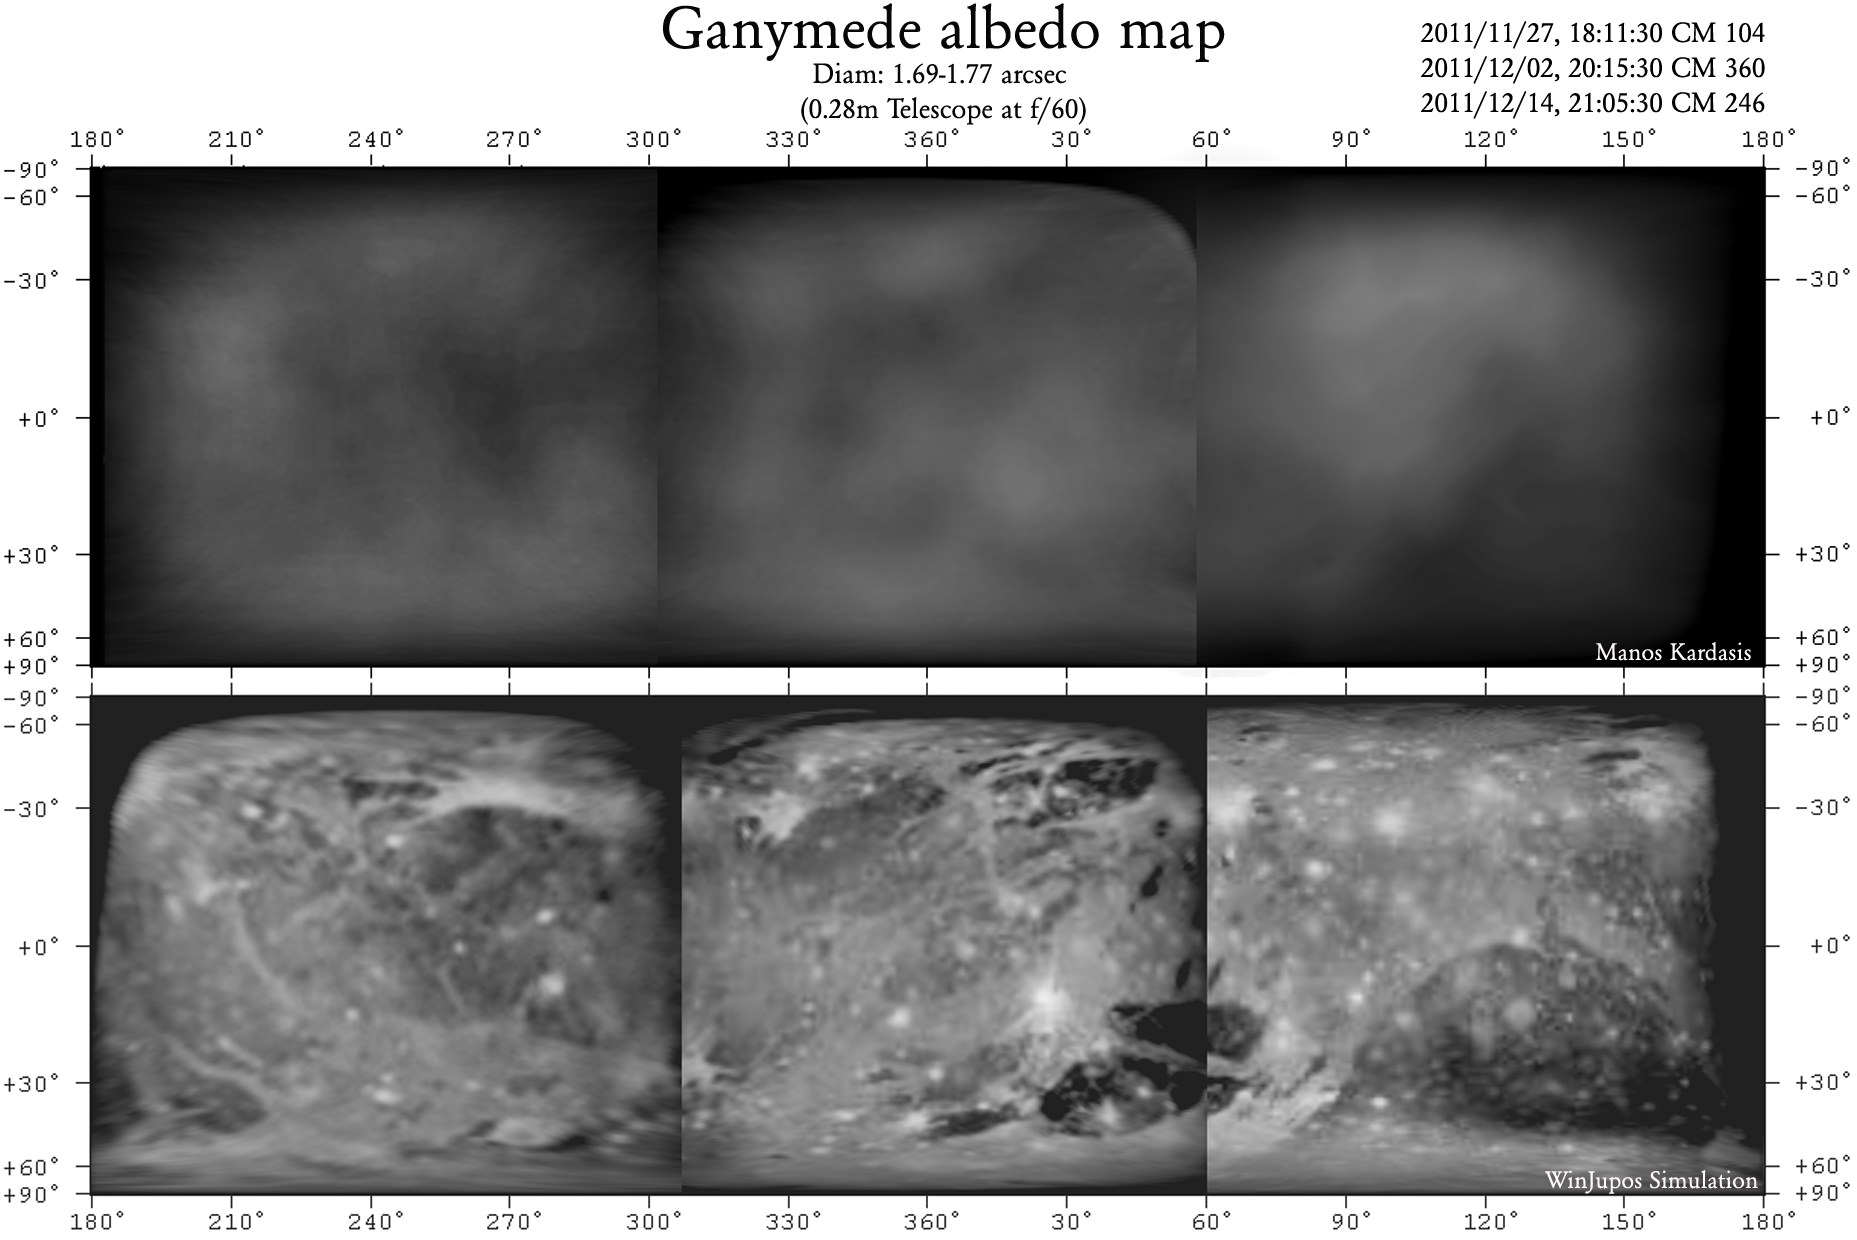
The original observations (top) and interpretations (bottom) of the first ever amateur albedo map of Ganymede. Credit: Manos Kardasis.
As our frequent “Astrophoto” posts from amateur astronomers and photographers attest – as well as the rise of citizen science — , the latest technology allows amatuers to make significant contributions to the field of astronomy. Case in point: Emmanuel I. Kardasis of the Hellenic Amateur Astronomy Association has produced the first amateur albedo map of Jupiter’s moon Ganymede. He used an off-the-shelf telescope, camera and computer equipment, but put his experienced observing skills to the test.
“Ganymede has a tiny disk as seen from Earth so was a good test for my techniques,” said Kardasis. “If the same methods were applied to other worlds, perhaps the volcanic moon Io, we could capture surface fluctuations. Professional observatories may create better images but they cannot monitor our rapidly and ever-changing Universe.”
Albedo maps of Ganymede (left) and how they relate to known surface features (right). Credit: Manos Kardasis.
Like many amateurs, Kardasis attached a camera to his telescope and recorded a video of Ganymede. Selecting only the sharpest frames of the video allowed him to obtain a series of images when the atmospheric conditions – known as ‘seeing’ – were most favorable. These best images were then stacked and aligned, before being enhanced through photo-editing software.
An albedo map details higher areas of reflectivity on an object’s surface recording where material is brighter or darker. Kardasis’ albedo map closely aligns with professional images of Ganymede’s surface, indicating features such as Phrygia Sulcus (furrows and ridges 3,700 km across) and the Nicholson region (a low-lying darker area).
Amateur photographs of Jupiter and Ganymede, accompanied with a professionally-obtained labeled map (bottom right). Credit: Manos Kardasis.
“Creating useful images of planets requires a telescope with a diameter of at least eight inches, said Kardasis. “For tiny discs, such as the moons of Jupiter, bigger is definitely better. My Ganymede images were made using an 11-inch telescope. You also need a good motor drive on your tripod, a sensitive camera, some freely-available software, and lots of patience!”
Kardasis presented his images at the European Planetary Science Congress this week in Madrid, Spain. He suggests that future amateur programs could monitor both surface and atmospheric changes on worlds as varied as Uranus, Neptune and Titan, complementing more detailed but far less regular observations made by professionals. Kardasis says, “I hope my work will inspire anyone interested in astronomy to use whatever equipment they have to make useful observations.”