Scientists Now Suspect More Sea Level Rise from Greenland’s Glaciers

Floating ice at the calving front of Greenland's Kangerdlugssuaq glacier, photographed in 2011 during Operation IceBridge (Credit: NASA/Michael Studinger)

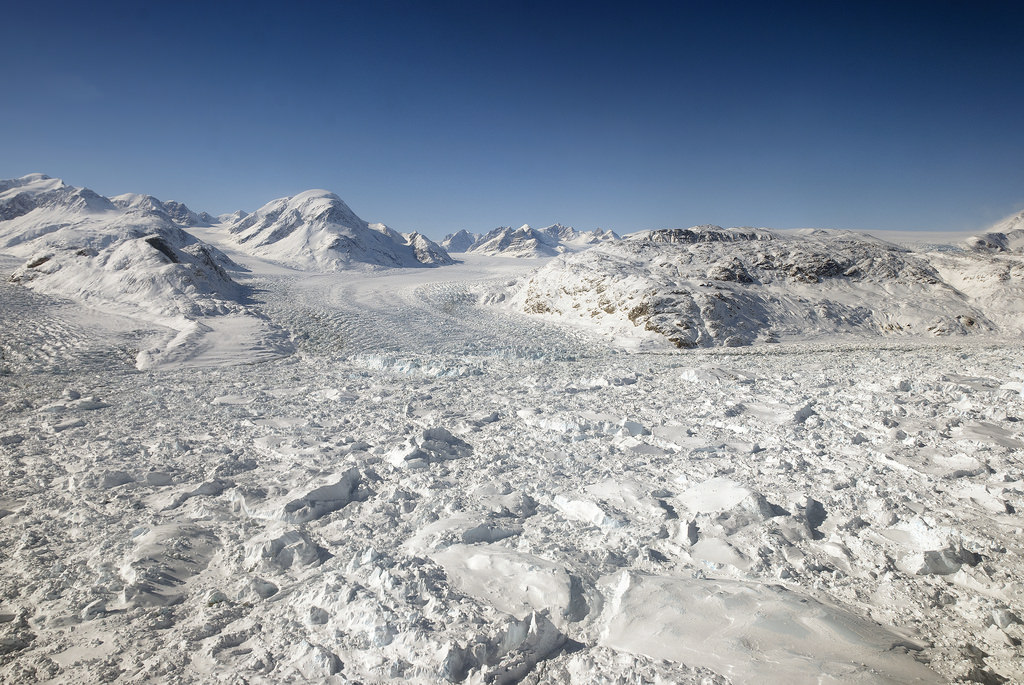
Greenland’s glaciers may contribute more to future sea level rise than once thought, despite earlier reports that their steady seaward advance is a bit slower than expected. This is just more sobering news on the current state of Earth’s ice from the same researchers that recently announced the “unstoppable” retreat of West Antarctic glaciers.

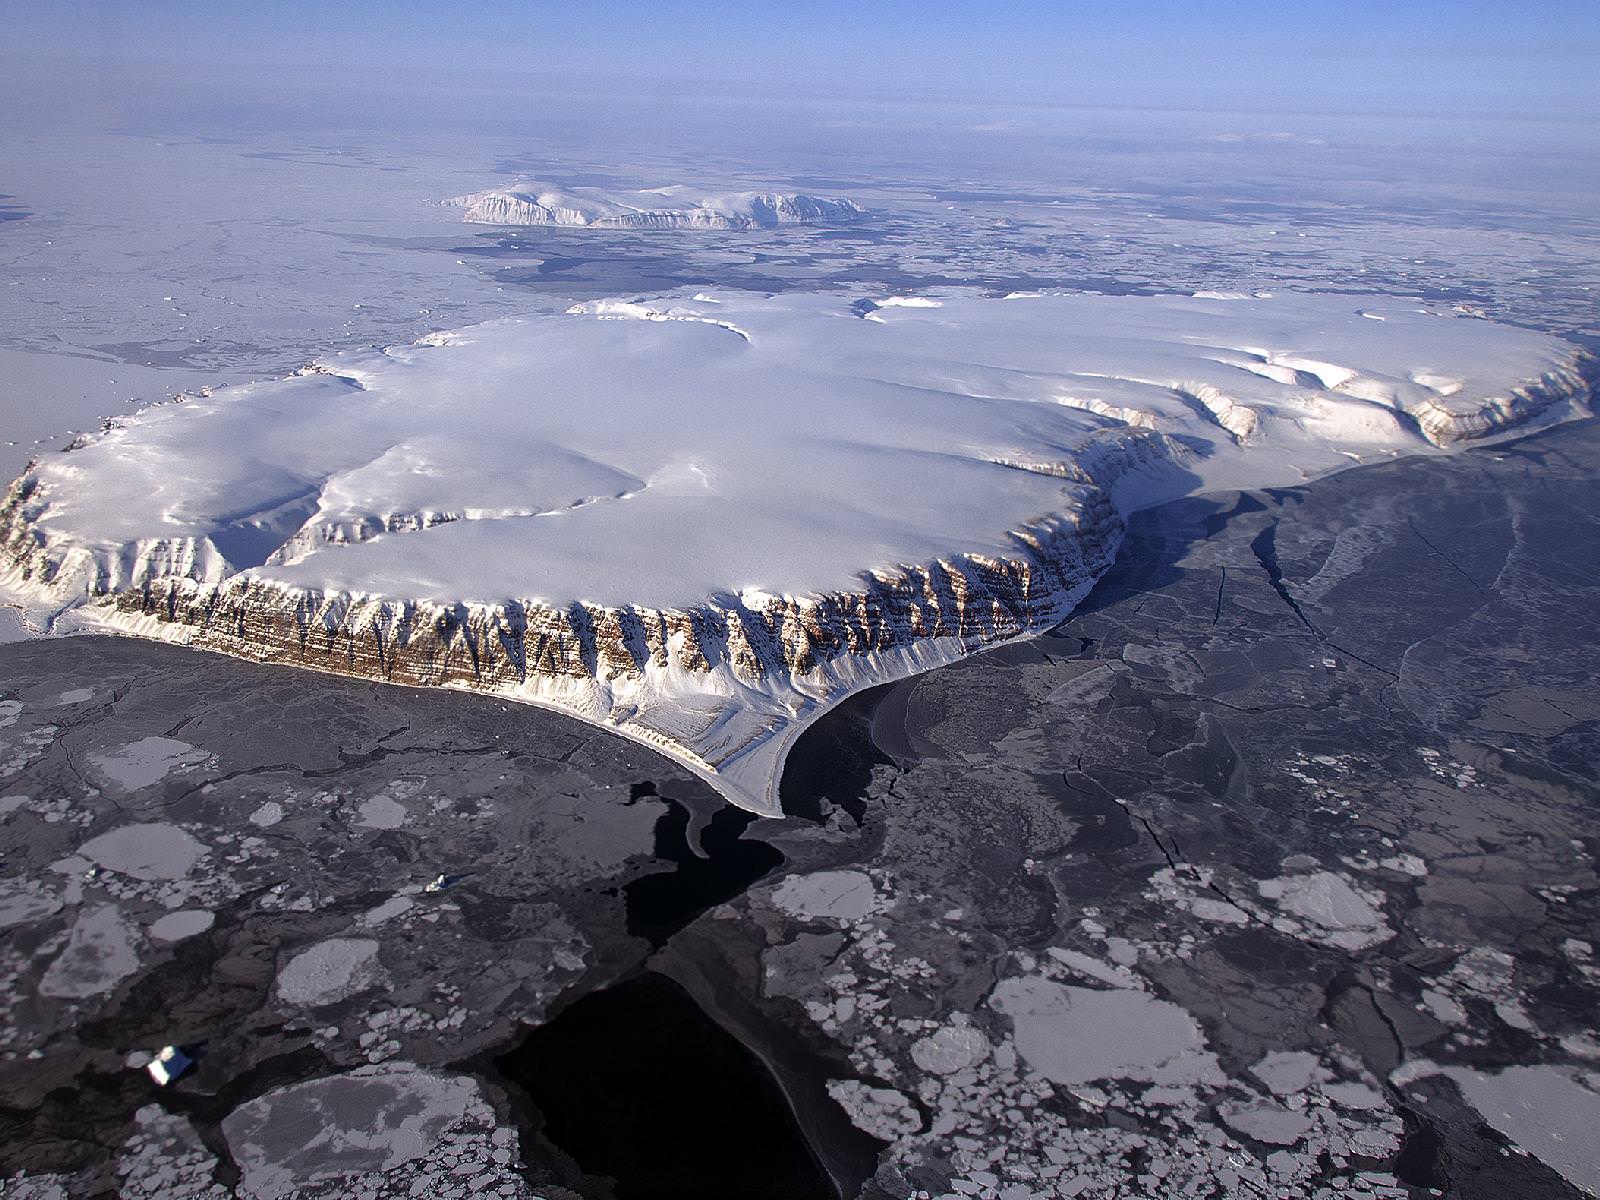
Using data collected by several international radar-mapping satellites and NASA’s airborne Operation IceBridge surveys, scientists at NASA and the University of California, Irvine have discovered deep canyons below the ice sheet along Greenland’s western coast. These canyons cut far inland, and are likely to drive ocean-feeding glaciers into the sea faster and for longer periods of time as Earth’s climate continues to warm.

Some previous models of Greenland’s glaciers expected their retreat to slow once they receded to higher altitudes, making their overall contribution to sea level increase uncertain. But with this new map of the terrain far below the ice, modeled with radar soundings and high-resolution ice motion data, it doesn’t seem that the ice sheets’ recession will halt any time soon.

According to the team’s paper, the findings “imply that the outlet glaciers of Greenland, and the ice sheet as a whole, are probably more vulnerable to ocean thermal forcing and peripheral thinning than inferred previously from existing numerical ice-sheet models.”

Read more: Scientists Set Their Sights on Arctic Ice Loss

Watch a video of the new topography map below:

“The glaciers of Greenland are likely to retreat faster and farther inland than anticipated, and for much longer, according to this very different topography we have discovered. This has major implications, because the glacier melt will contribute much more to rising seas around the globe.

– Mathieu Morlighem, project scientist, University of California, Irving

Many of the newly-discovered canyons descend below sea level and extend over 65 miles (100 kilometers) inland, making them vulnerable — like the glaciers in West Antarctica — to undercutting by warmer ocean currents.

The team’s findings were published on May 18 in a report titled Deeply Incised Submarine Glacial Valleys Beneath the Greenland Ice Sheet in the journal Nature Geoscience.

Source: NASA/JPL press release & University of California,Irvine News

_______________

What would happen if all the ice on land melted into the ocean? Find out what the world would look like here.

What Does Antarctica Look Like Under the Ice?

New topography map of Antarctica by the British Antarctic Survey's Bedmap2 (NASA/GSFC)

Although it sits isolated at the “bottom of the world” Antarctica is one of the most influential continents on Earth, affecting weather, climate, and ocean current patterns over the entire planet. But Antarctica is also one of the most enigmatic landmasses too, incredibly remote, extremely harsh, and covered by a layer of ice over 2 km thick. And as Earth’s global temperature continues to climb steadily higher, the future of ice in Antarctica — a continent half again as large as the contiguous United States — is a big concern for scientists… but in order to know exactly how its ice will behave to changing conditions, they need to know what’s under it.

This is where the British Antarctic Survey — using data gathered by NASA’s ICESat and Operation IceBridge missions — comes in, giving us a better view of what lies beneath the southern continent’s frozen veil.

A new dataset called Bedmap2 gives a clearer picture of Antarctica from the ice surface down to the bedrock below. Bedmap2 is a significant improvement on the previous collection of Antarctic data — known as Bedmap — that was produced more than 10 years ago. The product was a result of work led by the British Antarctic Survey, where researchers compiled decades worth of geophysical measurements, such as surface elevation measurements from NASA’s Ice, Cloud and Land Elevation Satellite (ICESat) and ice thickness data collected by Operation IceBridge.

Bedmap2, like the original Bedmap, is a collection of three datasets—surface elevation, ice thickness and bedrock topography. Both Bedmap and Bedmap2 are laid out as grids covering the entire continent, but with a tighter grid spacing Bedmap2 includes many surface and sub-ice features too small to be seen in the previous dataset. Additionally, the extensive use of GPS data in more recent surveys improves the precision of the new dataset.

Improvements in resolution, coverage and precision will lead to more accurate calculations of ice volume and potential contribution to sea level rise.

Ice sheet researchers use computer models to simulate how ice sheets will respond to changes in ocean and air temperatures. An advantage of these simulations is that they allow testing of many different climate scenarios, but the models are limited by how accurate the data on ice volume and sub-ice terrain are.

Only the tips of many of Antarctica's mountains are visible above thousands of feet of ice. (Oct. 2012 IceBridge photo. Credit: NASA / Christy Hansen)
Only the tips of many of Antarctica’s mountains are visible above thousands of feet of ice. (Oct. 2012 IceBridge photo. Credit: NASA / Christy Hansen)

“In order to accurately simulate the dynamic response of ice sheets to changing environmental conditions, such as temperature and snow accumulation, we need to know the shape and structure of the bedrock below the ice sheets in great detail,” said Michael Studinger, IceBridge project scientist at NASA Goddard.

Knowing what the bedrock looks like is important for ice sheet modeling because features in the bed control the ice’s shape and affect how it moves. Ice will flow faster on a downhill slope, while an uphill slope or bumpy terrain can slow an ice sheet down or even hold it in place temporarily. “The shape of the bed is the most important unknown, and affect how ice can flow,” said Nowicki. “You can influence how honey spreads on your plate, by simply varying how you hold your plate.” The vastly improved bedrock data included in Bedmap2 should provide the level of detail needed for models to be realistic.

Bedmap2 data of Antarctica's bedrock. Verical elevation has been exaggerated by 17x. (NASA/GSFC)
Bedmap2 data of Antarctica’s bedrock. Verical elevation has been exaggerated by 17x. (NASA/GSFC)

“It will be an important resource for the next generation of ice sheet modelers, physical oceanographers and structural geologists,” said Peter Fretwell, BAS scientist and lead author.

The BAS’ work was published recently in the journal The Cryosphere. Read more on the original release by George Hale here.

Source: NASA Earth

NASA Scientists Soar Over a Mini Ice Cap

Saunders Island and Wolstenholme Fjord with Kap Atholl in the background photographed during a NASA IceBridge flight. (NASA/Michael Studinger)

It’s quite a long way from Mars, but I can’t help but be reminded of the Red Planet’s ice-covered north pole when looking at this photo taken by Michael Studinger earlier this month, during a recent IceBridge survey flight over Greenland.

Called Saunders Island (also Appat Island) the 82-square-mile frozen slab of rock rises from the sea off the coast of northwestern Greenland, one of many islands within the Wolstenholme (Uummannaq) Fjord on the shore of Baffin Bay. Operation IceBridge, a six-year aerial survey of the changing ice coverage at our planet’s poles, is run by NASA to provide valuable ground-level information to supplement satellite data.

To me, the shape of the island’s steep rock faces and rugged inlets slice into its interior bear a striking resemblance to Mars’ ice cap.

Mars' north polar ice cap
Mars’ north polar ice cap

While Mars’ ice cap is shaped by very different processes — and obviously much bigger — you might see the connection too!

But rather than dark Martian dunes, sea ice can be seen surrounding the islands in varying thicknesses in the IceBridge photo above. Sea ice coverage in the fjord ranges from thicker, white ice in the background to thinner “grease” ice and leads with dark, open ocean water in the foreground.

The IceBridge P-3B airborne laboratory in a hangar at Wallops Flight Facility (NASA/George Hale)

As the amount of darker, ice-free water surfaces increase over the course of the year due to rising global temperatures, the more heat from solar radiation is collected in the ocean — thus speeding up the process of seasonal sea ice loss and overall Arctic warming.

Read more about the IceBridge mission here, and see a collection of more photos from this season’s flights here.

NASA’s Operation IceBridge images Earth’s polar ice in unprecedented detail to better understand processes that connect the polar regions with the global climate system. IceBridge utilizes a highly specialized fleet of research aircraft and the most sophisticated suite of innovative science instruments ever assembled to characterize annual changes in thickness of sea ice, glaciers, and ice sheets. In addition, IceBridge collects critical data used to predict the response of earth’s polar ice to climate change and resulting sea-level rise.