Monster Blizzard of 2016 Strikes US East Coast, Tracked by NASA and NOAA Satellites

NASA-NOAA's Suomi NPP satellite snapped this image of the approaching blizzard around 2:35 a.m. EST on Jan. 22, 2016 using the Visible Infrared Imaging Radiometer Suite (VIIRS) instrument's Day-Night band. Credit: NOAA/NASA
NASA-NOAA's Suomi NPP satellite snapped this image of the approaching blizzard around 2:35 a.m. EST on Jan. 22, 2016 using the Visible Infrared Imaging Radiometer Suite (VIIRS) instrument's Day-Night band.   Credit: NOAA/NASA
NASA-NOAA’s Suomi NPP satellite snapped this image of the approaching blizzard around 2:35 a.m. EST on Jan. 22, 2016 using the Visible Infrared Imaging Radiometer Suite (VIIRS) instrument’s Day-Night band. Credit: NOAA/NASA

NEW JERSEY- The monstrous ‘Blizzard of 2016’ predicted by weather forecasters for days has struck a wide swath of the US East Coast from the Gulf coast to the Carolinas to New York and soon into New England, with full fury today, Friday, Jan. 22.

NASA and NOAA satellites are tracking the storm which is already inundating the biggest population centers, affecting some 85 million people in 20 states up and down the Atlantic Coast, as it moves in a northeasterly direction.

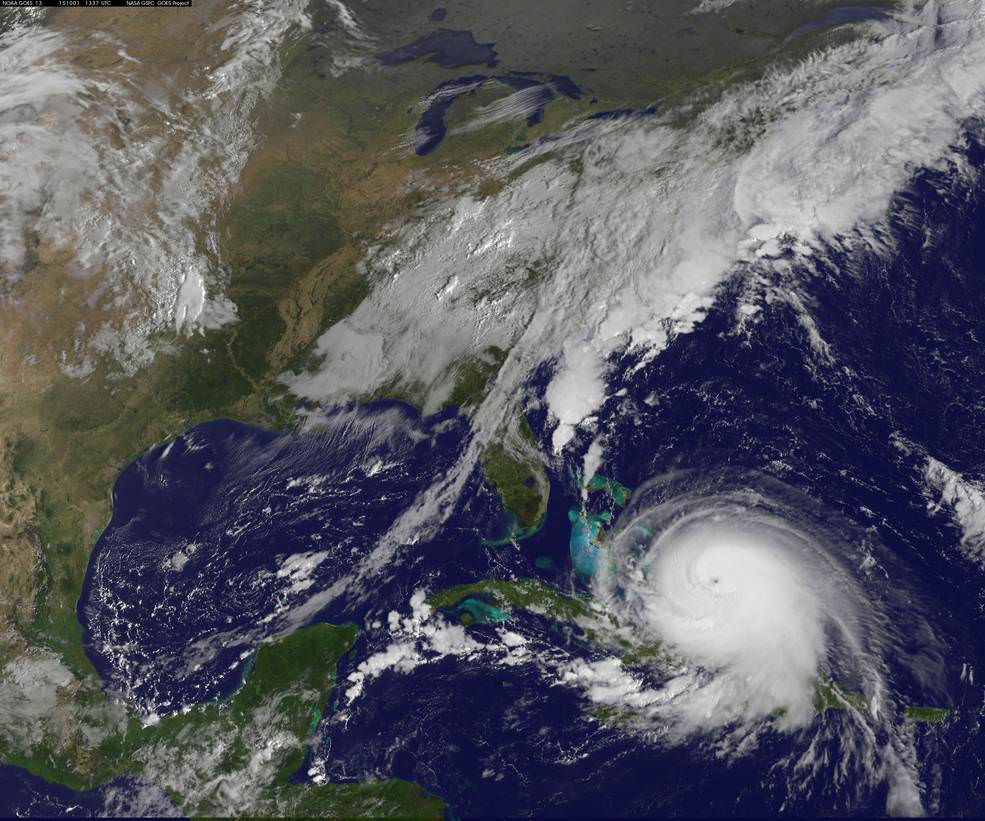
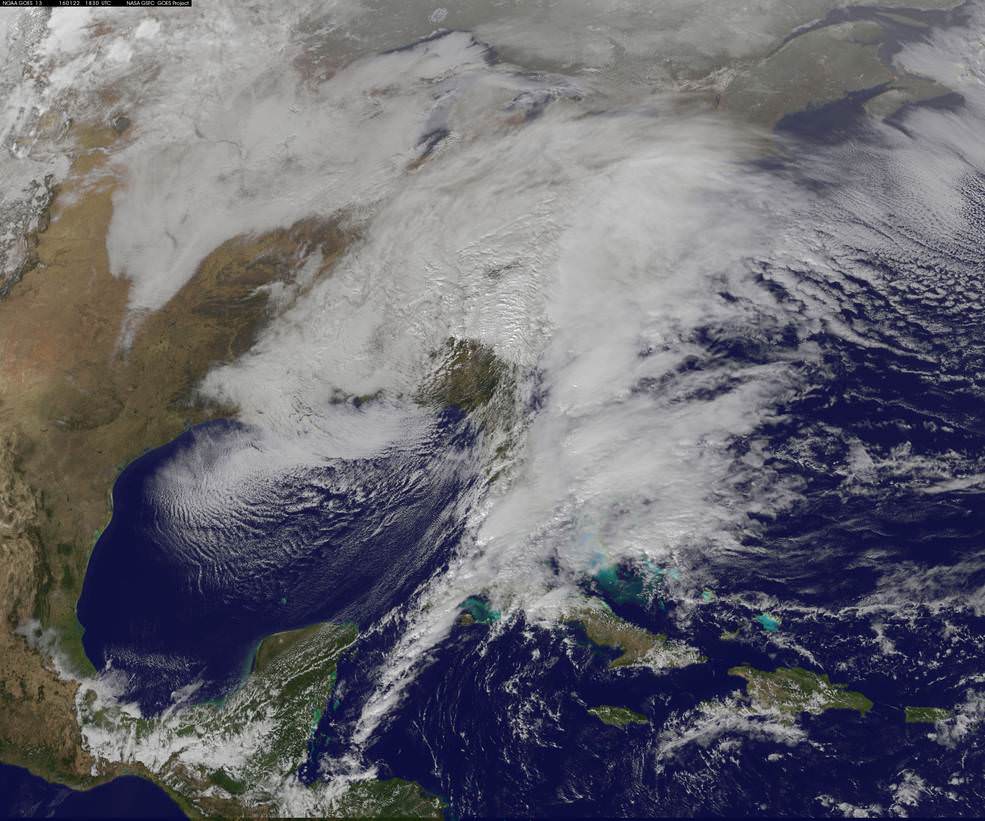
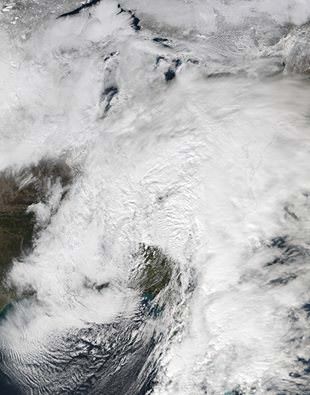
This afternoon, NASA and NOAA released a series of eyepopping satellite images showing the massive extent of the storm, which may drop historic amounts of snow on Washington DC and other cities over the next 24 to 48 hours.

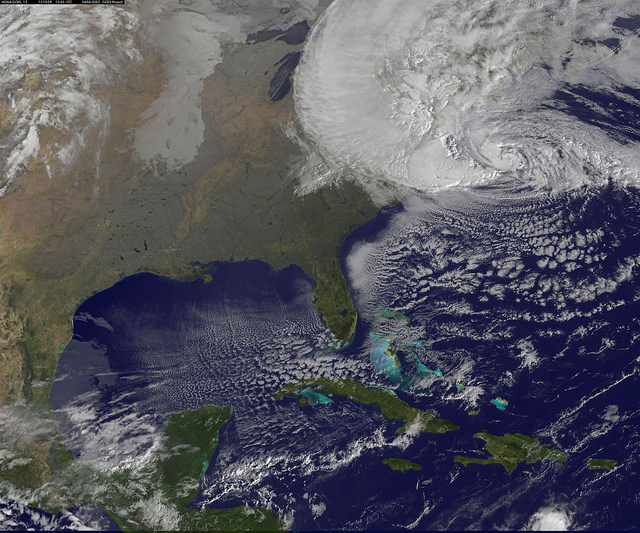
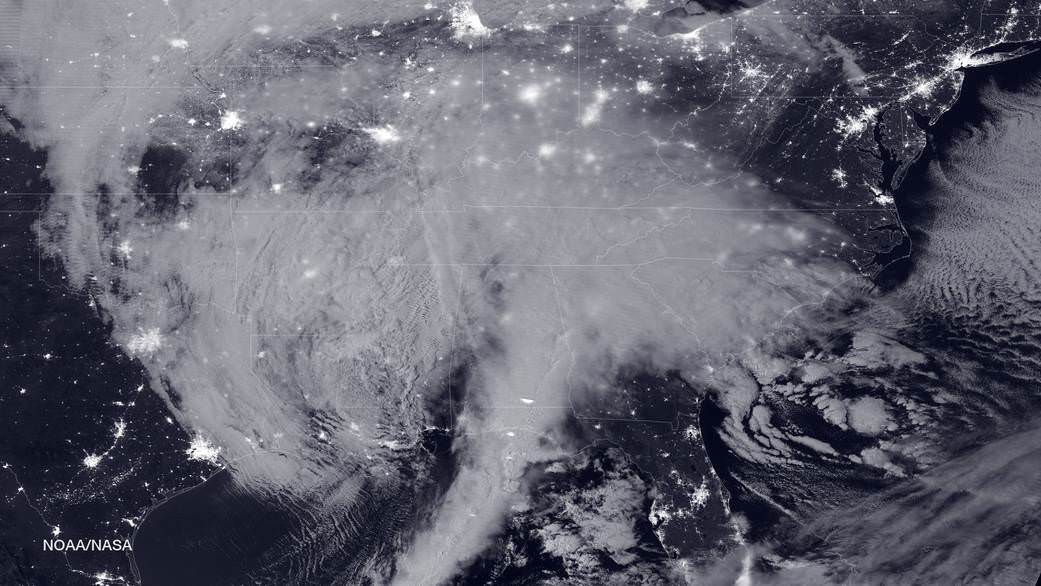
The two agencies released a particularly striking image, shown above, showing the storm swarming over virtually the entire eastern half of the continental US as it was barreling towards the East coast cites.

It was taken Friday afternoon by the NASA-NOAA’s Suomi NPP satellite showing the approaching blizzard around 2:35 a.m. EST on Jan. 22, 2016 using the Visible Infrared Imaging Radiometer Suite (VIIRS) instrument’s Day-Night band.

States of Emergency have been declared by Governors of states from the mid-Atlantic to New England, including North Carolina, Virginia, Maryland, New York, Pennsylvania, New Jersey, Kentucky, Georgia, Tennessee, West Virginia, the District of Columbia and the list is growing.

The heaviest snowfall is expected in and around Washington DC with estimates of 24 inches of snow or more. 18 to 24 inches may fall along the metropolitan Northeast corridor on Baltimore, Philadelphia, Trenton and New York City.

This visible image from NOAA's GOES-East satellite at 1830 UTC (1:30 p.m. EST) on Jan. 22, 2016 shows the major winter storm now affecting the U.S. East coast.  Credits: NASA/NOAA GOES Project
This visible image from NOAA’s GOES-East satellite at 1830 UTC (1:30 p.m. EST) on Jan. 22, 2016 shows the major winter storm now affecting the U.S. East coast. Credits: NASA/NOAA GOES Project

The heavy, blinding snow was already hitting Virginia and Washington by Friday afternoon. Governors, Mayors and Federal officials warned drivers to get off the roads by early Friday afternoon.

Stay off the roadways !!

Widespread treacherous driving with icy roads, sleet, rain, low visibility and whiteout conditions are causing numerous auto accidents as the blizzard bashes the region.

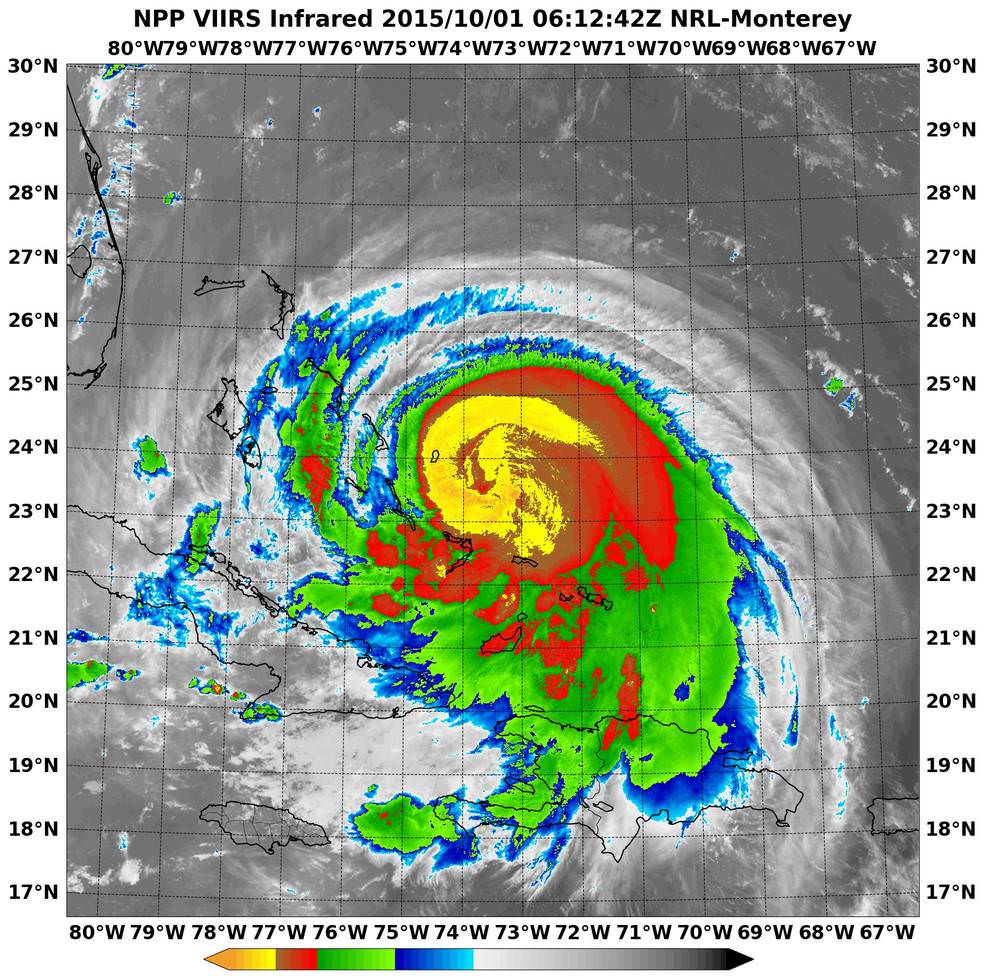
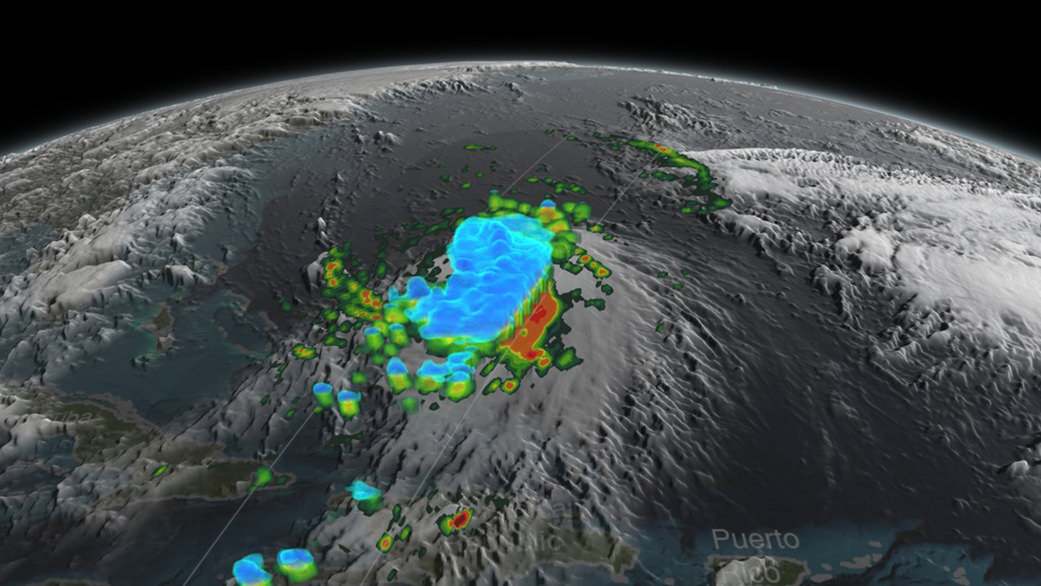
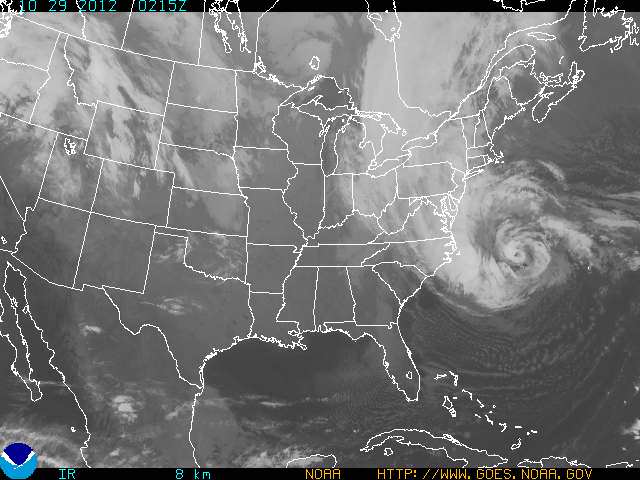
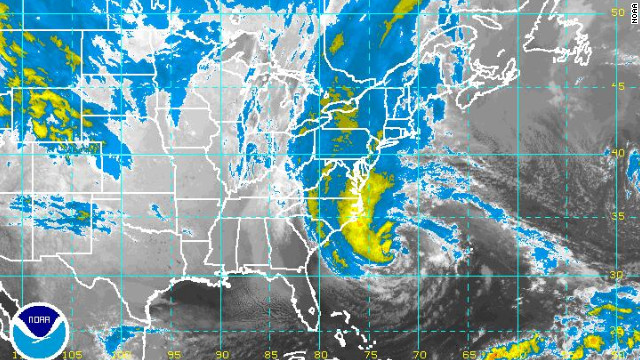
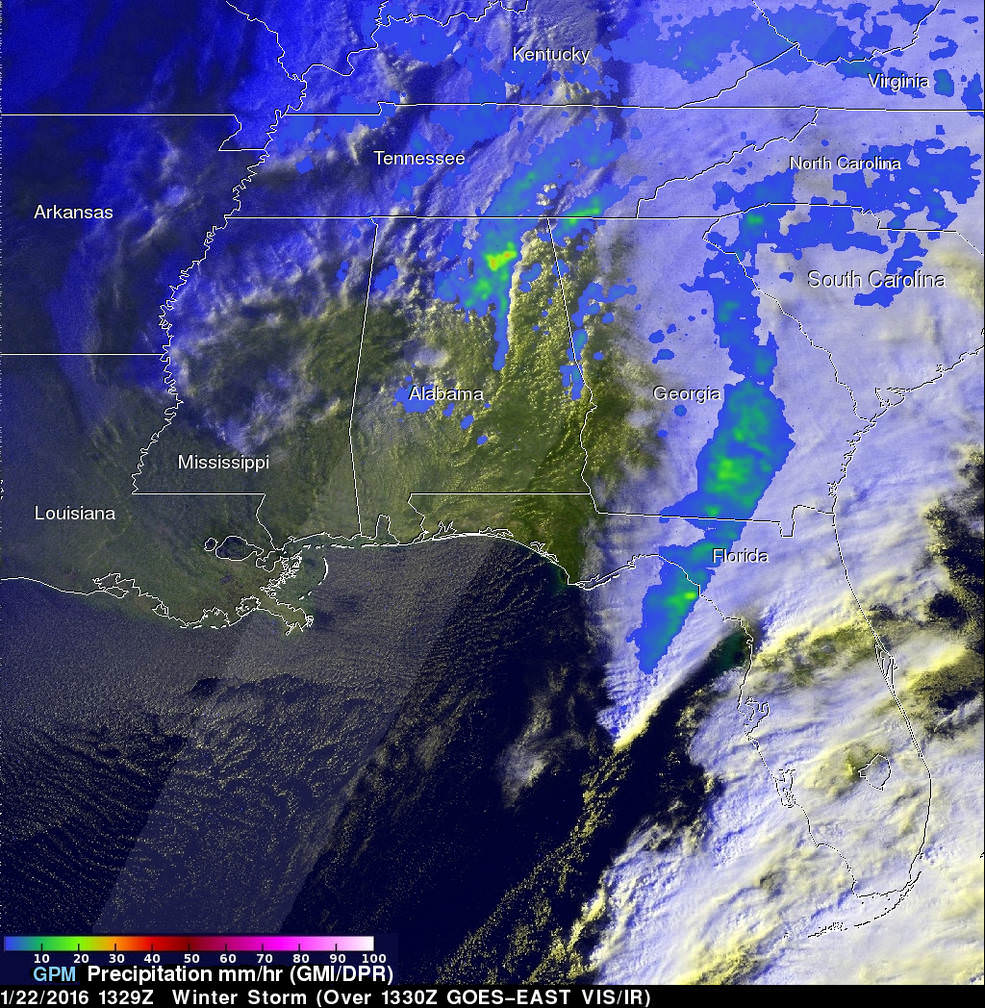
“The winter storm that caused damage during the night along the Gulf Coast has deepened and has started to spread heavy rain, freezing rain, sleet and snow northward into the Mid-Atlantic region. NASA’s GPM and NOAA’s GOES satellites are providing data on rainfall, cloud heights, extent and movement of the storm” wrote NASA’s Rob Gutro in an update on Friday.

On January 22 at 1329 UTC (8:29 a.m. EST) the GPM core satellite saw precipitation falling at a rate of over 64 mm (2.5 inches) per hour in storms over northern Alabama.  Credits: SSAI/NASA/JAXA, Hal Pierce
On January 22 at 1329 UTC (8:29 a.m. EST) the GPM core satellite saw precipitation falling at a rate of over 64 mm (2.5 inches) per hour in storms over northern Alabama. Credits: SSAI/NASA/JAXA, Hal Pierce

The National Weather Service (NWS) Weather Prediction Center in College Park, Maryland said “An area of low pressure centered over the southeastern U.S. will continue developing into a major winter storm which will impact a large portion of the East Coast from the southern Appalachians through the Mid-Atlantic States from Friday into the weekend. Snowfall totals may exceed 2 feet in portions of these areas, including the Baltimore and Washington D.C. metropolitan areas.”

The monster storm has already caused at least ten deaths. Thousands of motorists are stranded.

High winds up to 55 mph are expected to batter the New Jersey shore, causing significant beach erosion, coastal flooding and property destruction in the same areas devastated by Superstorm Sandy. Thousands of people have been evacuated.

The blizzard has also impacted the US Presidential campaigns and forced New Jersey Governor Chris Christie to temporary cancel campaign appearances in New Hampshire on Friday and Saturday, to deal first hand with the storm back home.

Heavy ice and snow accumulations could cause falling tress resulting in downed power lines and days long power outages during brutally cold temperatures.

Here’s a cool supercomputer animation model:

Video caption: A NASA Center for Climate Simulation supercomputer model that shows the flow of #Blizzard2016 thru Sunday, January 24, 2015. Credit: NASA

Many airports have been closed and some seven thousand flights have also been canceled.

The storm is expected to last into Sunday, Jan. 24

Looking massive from space....  This view of the winter storm over the eastern United States was captured on Friday, January 22, 2016 at 1:55 pm ET via the Visible Infrared Imaging Radiometer Suite (VIIRS) instrument on the Suomi NPP satellite.   Credit: NASA/Goddard/Suomi NPP/VIIRS
Looking massive from space…. This view of the winter storm over the eastern United States was captured on Friday, January 22, 2016 at 1:55 pm ET via the Visible Infrared Imaging Radiometer Suite (VIIRS) instrument on the Suomi NPP satellite. Credit: NASA/Goddard/Suomi NPP/VIIRS

Stay tuned here for Ken’s continuing Earth and Planetary science and human spaceflight news.

Ken Kremer

US Braces for Cat 4 Hurricane as ‘Joaquin’ Barrels to East Coast and ULA Readies 100th Launch on Oct. 2: Watch Live

NOAA's GOES-East satellite captured this visible image of Hurricane Joaquin affecting the Bahamas on Thursday, Oct. 1 at 1255 UTC. Credits: NASA/NOAA GOES Project

Video caption: This animation of images captured from September 29 to October 1, 2015 from NOAA’s GOES-East satellite shows Hurricane Joaquin become a major hurricane in the Bahamas. Credits: NASA/NOAA GOES Project

NEW JERSEY – A wide swath of the US East Coast is bracing for impact in the coming days as ‘Hurricane Joaquin’ strengthened to a major and dangerous Category 4 storm, today, Thursday, Oct. 1, as NASA and NOAA satellites keep constant watch as it barrels potentially towards tens of millions of coastal residents.

Joaquin is already packing winds exceeding 130 mph with even higher wind gusts as the storm continues to strengthen at this hour and the pressure is decreasing. See the latest Hurricane Joaquin animation and imagery from NASA and NOAA, above and below.

Meanwhile amidst the hurricane watch, launch preparations are underway by United Launch Alliance (ULA) for the firms 100th rocket blastoff on Friday morning, Oct. 2 from Cape Canaveral Air Force Station in Florida with an Atlas V booster as Joaquin nears the US eastern seaboard.

A ULA Atlas V is slated to lift off Friday from Cape Canaveral Air Force Station in Florida at 6:08 a.m. EDT with the Morelos-3 communications satellite for Mexico, before the hurricane gets closer to Florida.

The National Hurricane Center declared Joaquin had intensified into a massive Category 4 hurricane on the Saffir-Simpson Wind Scale, as of 2 PM EDT today, Oct. 1.

You can watch the launch on ULA’s live webcast starting at 5:48 a.m. Oct 2: http://www.ulalaunch.com

The governors of three states – New Jersey, Virginia and North Carolina – have already declared ‘States of Emergency’ in anticipation of potentially destructive winds, potentially life threatening drenching rains and floods, downed power lines and ocean rip currents with high waves in local areas.

Multiple NASA and NOAA satellites are intensively and continuously observing Joaquin, and are providing absolutely critical data to forecasters and government officials with the most current and best information available.

NASA’s GPM, Terra and NPP-Suomi satellites and NOAA’s GOES-East satellite are tracking Joaquin and have seen powerful thunderstorms today which indicates continued strengthening.

At this time we still don’t whether the US eastern seaboard will suffer a major hit but officials are taking no chances after suffering through Superstorm Sandy which caused many deaths, widespread power outages and billions and billions of dollars of damage – from which we are still recovering.

Joaquin is currently over The Bahamas in the Caribbean and is expected to make a sharp right turn on Friday Oct 2 and head northwards to the east coast and the Atlantic Ocean. It could start impacting the Carolinas and regions further north as soon as Sunday, Oct. 4, based on current forecasts, and drop double digits inches of torrential rainfall.

NASA-NOAA's Suomi NPP satellite passed over Joaquin at 06:10 UTC (2:10 a.m. EDT) on Oct. 1 as it was strengthening from a Category 2 to a Category 3 hurricane. It’s now a Category 4. Imagery showed cloud top temperatures colder than -63F/-53C (yellow).  Credits: NRL/NASA/NOAA
NASA-NOAA’s Suomi NPP satellite passed over Joaquin at 06:10 UTC (2:10 a.m. EDT) on Oct. 1 as it was strengthening from a Category 2 to a Category 3 hurricane. It’s now a Category 4. Imagery showed cloud top temperatures colder than -63F/-53C (yellow). Credits: NRL/NASA/NOAA

Its pounding the Bahamas right now and is creating a disaster with hurricane force winds and heavy rainfall, say weather forecasters, as it remains over the island for some 24 hours or more and may drop over 10 inches of rain.

But there is a very wide cone of uncertainly of where it could hit as the possible storm track extends from the Carolinas to Maine. It may or may not directly impact the eastern US. The storm may shift to the right and spare the east coast. But no one knows at this time.

Some areas on the US East coast stretching from Virginia to Maine have already suffered from torrential rains and severe flooding from an unrelated storm the past few days and also right now today, Thursday.

So the grounds are already saturated in parts of the Carolina’s, Virginia, Maine and elsewhere.

NASA/JAXA's GPM satellite provided a 3-D side view of Tropical Storm Joaquin on Sept. 29 showing the internal precipitation structure. The areas in blue are frozen precipitation. Areas in green and red are liquid precipitation.  Credits: Scientific Visualization Studio, NASA’s Goddard Space Flight Center
NASA/JAXA’s GPM satellite provided a 3-D side view of Tropical Storm Joaquin on Sept. 29 showing the internal precipitation structure. The areas in blue are frozen precipitation. Areas in green and red are liquid precipitation. Credits: Scientific Visualization Studio, NASA’s Goddard Space Flight Center

Coastal flood warnings and watches are already in effect in many areas along the eastern seaboard where local areas could be drenched by some 12 to 18 inches of additional rain which could fall even before the hurricane hits.

Significant beach erosion has already occurred in the Carolinas over the past few days and more is expected up and down the entire coast up to Maine.

And 10 foot high defense berms of sand are being constructed at this moment along miles and miles of the Jersey Shore – areas that suffered devastating damage from Superstorm Sandy.

There is a potential risk of deadly flooding, flash flooding and damage to houses, buildings, businesses, roadways and infrastructure.

“At 2 p.m. EDT (1800 UTC), the center of Hurricane Joaquin was located near latitude 23.0 North, longitude 74.2 West. Joaquin was moving generally southwestward at about 6 mph (9 kph), and the National Hurricane Center forecast a turn toward the northwest and north on Friday, Oct. 2. On the forecast track, the center of Joaquin will move near or over portions of the central Bahamas today and tonight and pass near or over portions of the northwestern Bahamas on Friday, Oct. 2,” according to NASAs Rob Gutro.

The weather forecast for Friday’s launch from Cape Canaveral , Florida is currently 70 percent GO for liftoff of the United Launch Alliance Atlas V rocket at 6:08 a.m. EDT. The Atlas V will launch with the Morelos-3 mission for Mexico’s Secretaria de Comunicaciones y Transportes (Ministry of Communications and Transportation).

Morelos-3 will be part of the Mexsat constellation of satellites that delivers advanced telecommunications throughout Mexico.

United Launch Alliance Atlas V rocket after rollout to Pad 41 at Cape Canaveral Air Force Station, Florida for planned Oct. 2 launch at 6:08 a.m. EDT with the Morelos-3 mission for Mexico’s Ministry of Communications and Transportation.  In progress assembly of the commercial crew access tower is seen at right, now under construction for the Boeing Starliner space taxi for astronaut crews launching to the ISS. Credit: Julian Leek
United Launch Alliance Atlas V rocket after rollout to Pad 41 at Cape Canaveral Air Force Station, Florida for planned Oct. 2 launch at 6:08 a.m. EDT with the Morelos-3 mission for Mexico’s Ministry of Communications and Transportation. In progress assembly of the commercial crew access tower is seen at right, now under construction for the Boeing Starliner space taxi for astronaut crews launching to the ISS. Credit: Julian Leek

Stay tuned here for Ken’s continuing Earth and planetary science and human spaceflight news.

Ken Kremer

United Launch Alliance Atlas V rocket during rollout to Space Launch Complex-41 at Cape Canaveral Air Force Station, Florida on Oct. 1 for planned Oct. 2 launch at 6:08 a.m. EDT with the Morelos-3 mission for Mexico’s Ministry of Communications and Transportation.  Credit: Julian Leek
United Launch Alliance Atlas V rocket during rollout to Space Launch Complex-41 at Cape Canaveral Air Force Station, Florida on Oct. 1 for planned Oct. 2 launch at 6:08 a.m. EDT with the Morelos-3 mission for Mexico’s Ministry of Communications and Transportation. Credit: Julian Leek

Satellites Provide 3-D Views and More of Hurricane Sandy

Hurricane Sandy as viewed by the TRMM Precipitation Radar at 2:20 EDT on Oct. 28, 2012. Credit: NASA

Satellite imagery and data has been invaluable in predicting the path and intensity of storms like Hurricane Sandy. Satellites like NASA’s Tropical Rainfall Measuring Mission (TRMM) can measure rainfall rates and cloud heights in tropical cyclones, and was used to create a 3-D image, above, to allow forecasters to look inside the hurricane, and predict fairly spot-on what locations would be affected the worst. There’s even a 3-D video view from the CloudSat satellite, and much more, including a stunning wind map, and this round-up from JPL of various satellite views of the storm. You can also see a slideshow of NASA satellite images and videos on the NASA Goddard Flickr site.

This exemplifies just one reason why space exploration is important, and why people are maybe now starting to realize how our failure to plan ahead and invest in weather satellites may become a problem. Without those eyes in the sky we are blind to the minute-to-minute and hour-to-hour development of storms and weather, not to mention overall study of the climate.

Below is a stunning high-speed satellite view from the GOES-14 satellite:

Focusing just on the area of the storm, the GOES-14 Super Rapid Scan Operation (SRSO) captures infrared and visible data every minute and relays that information to forecasters on the ground. This animation shows the GOES-14 SRSO for October 29, 2012 as Hurricane Sandy approached the U.S. coastline.

Video: Hurricane Sandy Seen by Space Station Astronauts

Here’s the view of Hurricane Sandy from an altitude of 254 statute miles from external cameras on the International Space Station. This video was shot as the ISS flew over the US’s eastern seaboard at 12:52 Eastern time October 29, 2012. Sandy has yet to officially make landfall, but the huge storm is already battering a region that makes up the most densely populated area of the US. The combination of three different storms has caused it to be dubbed as “Frankenstorm,” but it could turn into a “Blizzicane” as a winter storm merges with Sandy. The hurricane itself is strengthening as it barrels toward a landfall along the New Jersey coastline.

Below is video of the ISS pass at 11:16 a.m on Monday:

At the time of the flyover, Sandy was located 420 km (260 miles) south-southeast of New York City, moving north-northwest at 18 miles an hour with winds measured at 90 miles an hour as a Category 1 hurricane, according to the National Hurricane Center.

The huge slow moving combination of storms stretches about 1,600 km (1,000 miles) from north to south and significant impacts of storm surge and flooding are expected, with at least 7-10 inches of rain. This comes along with a snow advisory in some regions, creating a “Blizzicane” in the mountains of West Virgina, with 2-4 feet of snow predicted.

Forecasters are predicting this to be a multi-billion dollar storm disaster.

Here are some recent images of the storm:

Satellite View of Hurricane Sandy on Oct. 29 at 9:10 EDT by NOAA’s GOES-13 satellite.

Hurricane Sandy Viewed in the Dark of Night. Image acquired by the Visible Infrared Imaging Radiometer Suite (VIIRS) on the Suomi NPP satellite around 2:42 a.m. Eastern Daylight Time (06:42 Universal Time) on October 28, 2012.

For more images, see the Goddard Space Flight Center’s Flickr page.

Incredible Video of Sandy’s Swirling Progression

Just released, this mesmerizing animation was created by Kevin Ward from images acquired by NOAA’s GOES-O/14 satellite. It shows the progression of Hurricane Sandy, currently a Category 1 hurricane off the coast of the eastern U.S. that’s poised to make a devastating impact when its heavy rains, winds and storm surges strike the shores of many major metropolitan coastal areas — including New York City and Washington, D.C.

Nearly 12 hours of time are compressed into 30 seconds, revealing the evolution of Sandy as it churned over the Atlantic on Sunday, October 28.

 From NASA’s Earth Observatory’s YouTube page:
This time-lapse animation shows Hurricane Sandy from the vantage point of geostationary orbit—35,800 km (22,300 miles) above the Earth. The animation shows Sandy on October 28, 2012, from 7:15 to 6:26 EDT. Light from the changing angles of the sun highlight the structure of the clouds. The images were collected by NOAA’s GOES-14 satellite. The “super rapid scan” images — one every minute from 7:15 a.m. until 6:30 p.m. EDT — reveal details of the storm’s motion.

Launched by NASA as GOES-O on June 27, 2009, GOES-14 is now under control by the NOAA, keeping an eye on the mid-Atlantic region from a geostationary position approximately 22,300 miles (35,800 km) above the Earth.

Sandy is expected to bring up to 10 inches of rain into New York, with a surge possible over 6 feet above high tide and wind gusts in excess of 75 mph. Once the hurricane moves inland there could be millions left without electricity. States of emergency have already been declared in many areas within Sandy’s projected path.

Read: Hurricane Sandy Barreling to Eastern Seaboard, Menacing Millions

Currently Sandy is off the coast of North Carolina (at the time of this writing, 34.5 N / 70.5 W) moving northeast at 14 mph (22  km/h) with a low pressure of 950 mb… that’s as low or lower than some of the most powerful storms to hit the eastern U.S. over the past century, including the “perfect storm” of 1991 (a low system which also struck at Halloween) and the deadly 1938 “Great Hurricane”, which devastated coastal regions all across southern New England.

Stay up to date on Hurricane Sandy’s progress on the NOAA page here, with the latest public advisories being posted here.

NASA animation by Kevin Ward, using images from NOAA and the University of Wisconsin-Madison Cooperative Institute for Meteorological Satellite Studies.

Hurricane Sandy Barreling to Eastern Seaboard Menacing Millions

Image Caption: NOAA Satellite image of Hurricane Sandy threatening millions of people living along US Eastern Seaboard. See NASA satellite imagery below. Credit: NOAA

Hurricane Sandy, a powerfully monstrous and unprecedented late season storm, is barreling mightily towards the US Eastern Seaboard, menacing tens of millions of residents living in the path of her sustained destructive winds, rains and life threatening storm surges.

Mandatory mass evacuations involving hundreds of thousands of people are already in progress in anticipation of a devastating storm strike on Monday (Oct 29).

First effects from Sandy are expected on Sunday night (Oct 28) in the New York/ New Jersey/Connecticut/Pennsylvania metropolitan area. Wind gusts are already exceeding 40 MPH as of Sunday afternoon, here in New Jersey – and steadily worsening.

Coastal Wave heights of 6 to 11 feet are predicted – possibly breaking records.

Public transit systems in New York City/New York, New Jersey, Philadelphia, Pennsylvania, Connecticut and Washington, D.C. have been ordered to shut down later today – Sunday – by the Governors’ of the affected states. Most schools and government offices will also be closed on Monday.

Amtrak has just announced it will shutdown trains in the Northeast Corridor.

Image Caption: Hurricane Sandy off the southeastern United States was imaged at noon Eastern Daylight Time (16:00 UT) on October 28, 2012, acquired by the Moderate Resolution Imaging Spectroradiometer (MODIS) on NASA’s Terra satellite. Credit: NASA Terra satellite

As of Sunday afternoon (Oct. 28) Sandy is predicted to make a dramatic, sharp left hook on Monday morning and most likely will make a violent direct hit slamming somewhere along the Jersey shore which borders from Maryland to New York City and beyond – sending high waves surging into coastal towns and cities overwhelming protective barriers.

Image Caption: Predicted path of Hurricane Sandy. Credit: NOAA

Inland areas will also suffer widespread destruction and power losses as Sandy slowly moves onshore and lingers over an extraordinarily wide path spanning several hundred miles in diameter.

Heavy rains and hurricane force wind gusts will soak the ground, taking down trees and power lines. Leaves may block storm drains.

Hurricane Sandy is currently classified as a Category 1 Hurricane. Its effects could be catastrophic and should not be taken lightly.

Making matters even worse, Sandy will hit during a full moon and the astronomical highest tides.

The National Hurricane Service warns that major flooding effecting millions of homes and businesses is expected along the US East Coast stretching from North Carolina to New England.

Millions and millions of people have more than a 50% chance of losing power.

Local power companies learned hard lessons from the devastating effects of Hurricane Irene just 1 year ago, which caused widespread and serious misery, flooding and deaths throughout the Northeast. Some people went without power for more than 2 weeks in the aftermath of Hurricane Irene in 2011. This author lost power for several days and now we are in for another direct hit.

Additional Power crews have been called in from across the country and prepositioned as a precautionary measure. NEVER touch any downed power lines.

States of Emergency have been declared in 9 eastern States from North Carolina to Maine as well as the District of Columbia.

Mandatory evacuations of low lying coastal areas have been ordered by the Governors’ of New Jersey, New York and Connecticut. State Shelters are being opened now.

Ocean wave heights of 20 to 50 feet have already been reported near the Hurricane’s eye.

Even the US Presidential election is being affected by Hurricane Sandy. Campaign events by both candidates Obama and Romney have been cancelled in several key battleground states. It is possible that polling stations may lose power – and the consequences are unknown on the closely contested election that could hinge on a handful of votes !

Stay tuned to NOAA, NASA and local and national news for continuing Hurricane updates.

Ken Kremer

Satellite Views: Will Hurricane Sandy Turn into ‘Frankenstorm’?

Hurricane Sandy made landfall on Cuba early Thursday Oct. 25, 2012 as strong Category 2. Credit: NOAA/National Hurricane Center

Meteorologists keeping an eye on Hurricane Sandy say the storm threatens to move up along the east coast of the United States and could mix with a wintery storm coming from the west to form a monster storm that has been informally dubbed “Frankenstorm.” The hurricane could reach the US coast by this weekend and when the two storms collide, it could continue to pound the eastern seaboard well into the week of Halloween.

Hurricane Sandy is now in the Caribbean as a Category 2 storm coastal areas from Florida to Maine will feel some effects, forecasters predict. The mix of the two storms could cause weather problems in the Washington DC area to New York city, some of the most populous areas of the US.

Satellite image of then Tropical Storm Sandy taken on October 23, 2012 as it was over the Caribbean Sea taken by the Moderate Resolution Imaging Spectroradiometer (MODIS) on NASA’s Terra satellite. NASA image courtesy Jeff Schmaltz, LANCE MODIS Rapid Response Team at NASA GSFC.

Forecasters are saying this could be a major mess, with a 90 percent chance that the East will get steady gale-force winds, heavy rain, flooding and maybe snow.

While no one can positively predict what Hurricane Sandy will do and how the two storms might mesh into one monster storm, the Washington Post’s Capital Weather Gang has outlined the possible scenarios from worst case to where the storms collide and remained parked over the region for days, to best case, where Sandy heads to the northeast sparing the East Coast from a direct hit.

We’ll post additional updated satellite views as they become available.

Sources: NASA Earth Observatory, CBS News, Climate Central
, NOAA