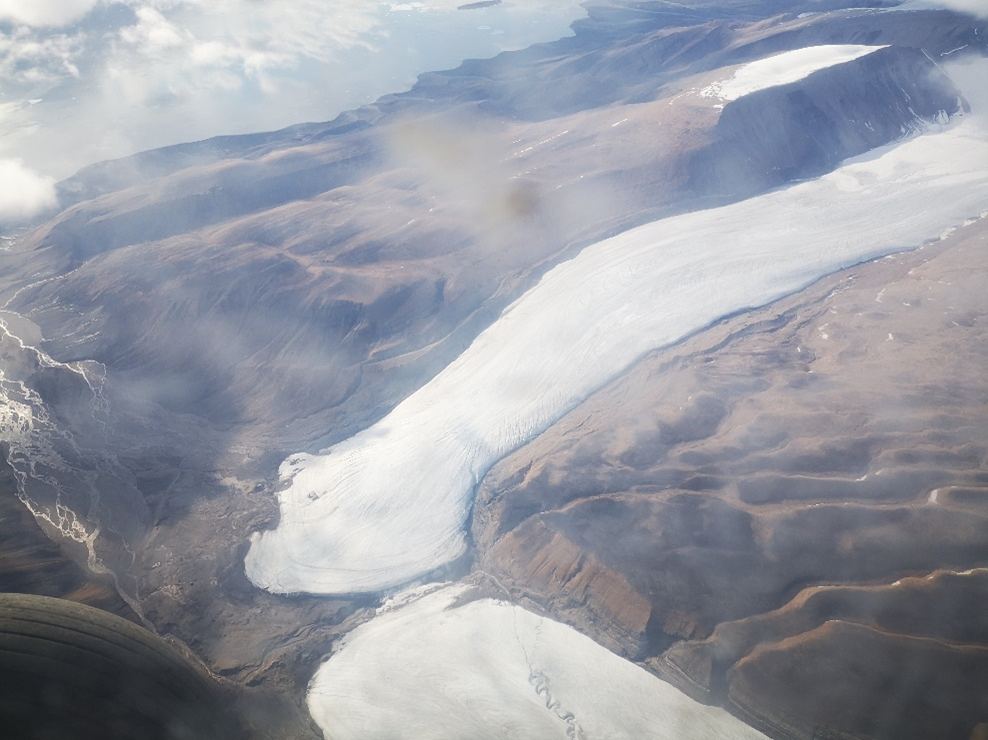
Glacial landscapes on Axel Heiberg Island (Canadian Arctic Archipelago) showing typical (glaciers) and atypical (subglacial channels, bottom right) glacial landscapes. Credit: A. Grau Galofre
On Earth, shifts in our climate have caused glaciers to advance and recede throughout our geological history (known as glacial and inter-glacial periods). The movement of these glaciers has carved features on the surface, including U-shaped valleys, hanging valleys, and fjords. These features are missing on Mars, leading scientists to conclude that any glaciers on its surface in the distant past were stationary. However, new research by a team of U.S. and French planetary scientists suggests that Martian glaciers did move more slowly than those on Earth.
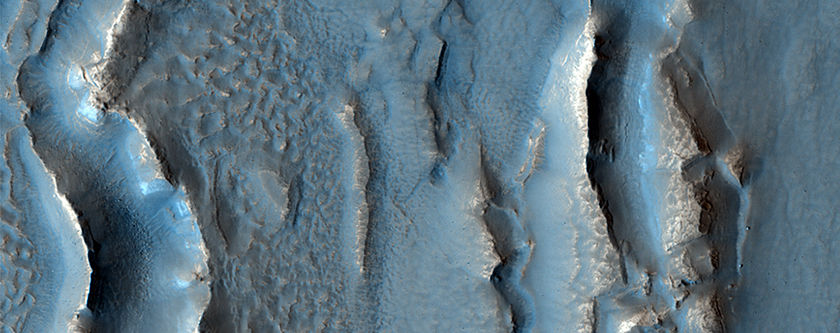
Deuteronilus Mensae (DM)has many rough surface features. The Mars Reconnaissance Orbiter has shown that many areas in DM are sub-surface glaciers covered by a thin layer of debris. Image: NASA/JPL/University of Arizona
Like Earth, Mars has experienced periods of extreme glaciation or ice sheet coverage, which are known as ice ages. As these ice ages come and go, glaciers expand and contract along the planet’s surface, grinding huge boulders down to smaller rocks. By examining the size of boulders and rocks at specific locations on Mars, we should be able to understand the history of the Martian ice ages.
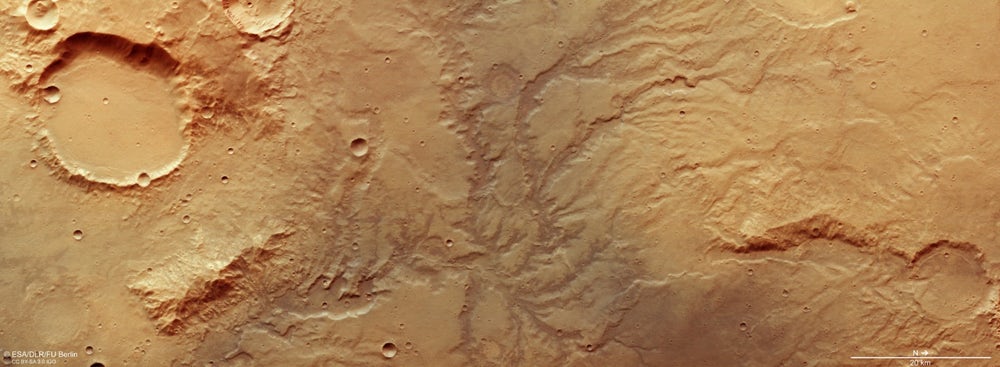
Orbiters are giving us a chance to study the surface of Mars closely, and some of the features that pop to prominence are dry river channels. There are over 10,000 of them. But a new study suggests that glaciers on ancient Mars are responsible for many of them.
According to the study, those glaciers and the water flowing under them are resonsible for carving out some of those riverbeds, rather than free-flowing rivers.
Jeff Kargel is a Senior Scientist at the Planetary Science Institute in Tucson, Arizona. He is a geologist, a glaciologist, and a planetary scientist. Climate change is a major thread, and that is what he is here today to talk about.
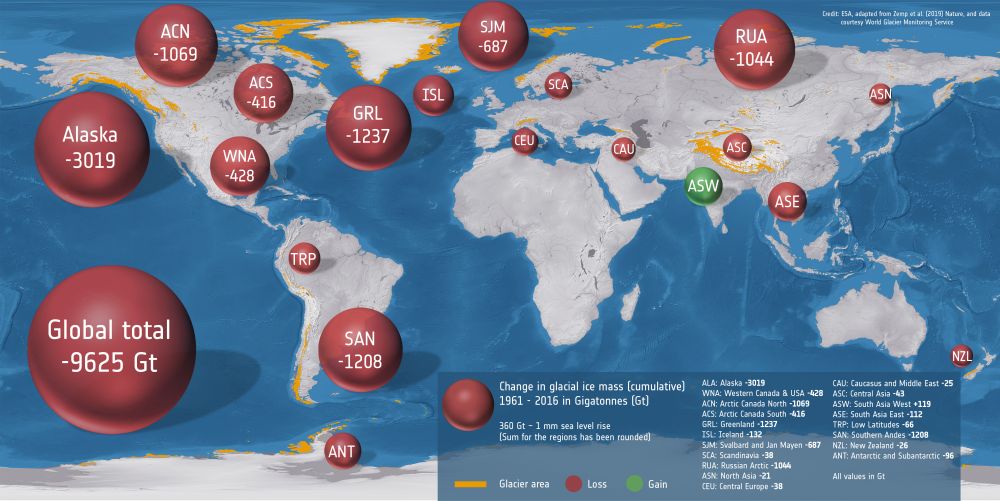
This graphic shows the change in cumulative ice mass over the last 50 years in different glacial regions on Earth. Image Credit: ESA, adapted from Zemp et al. (2019) Nature, and data courtesy of World Glacier Monitoring Service
Things are not looking good for Earth’s glaciers. Usually, when it comes to climate change and melting ice, we think of the Earth’s polar regions. But they’re not the only important ice formations, and they’re not the only ice that’s melting due to climate change.
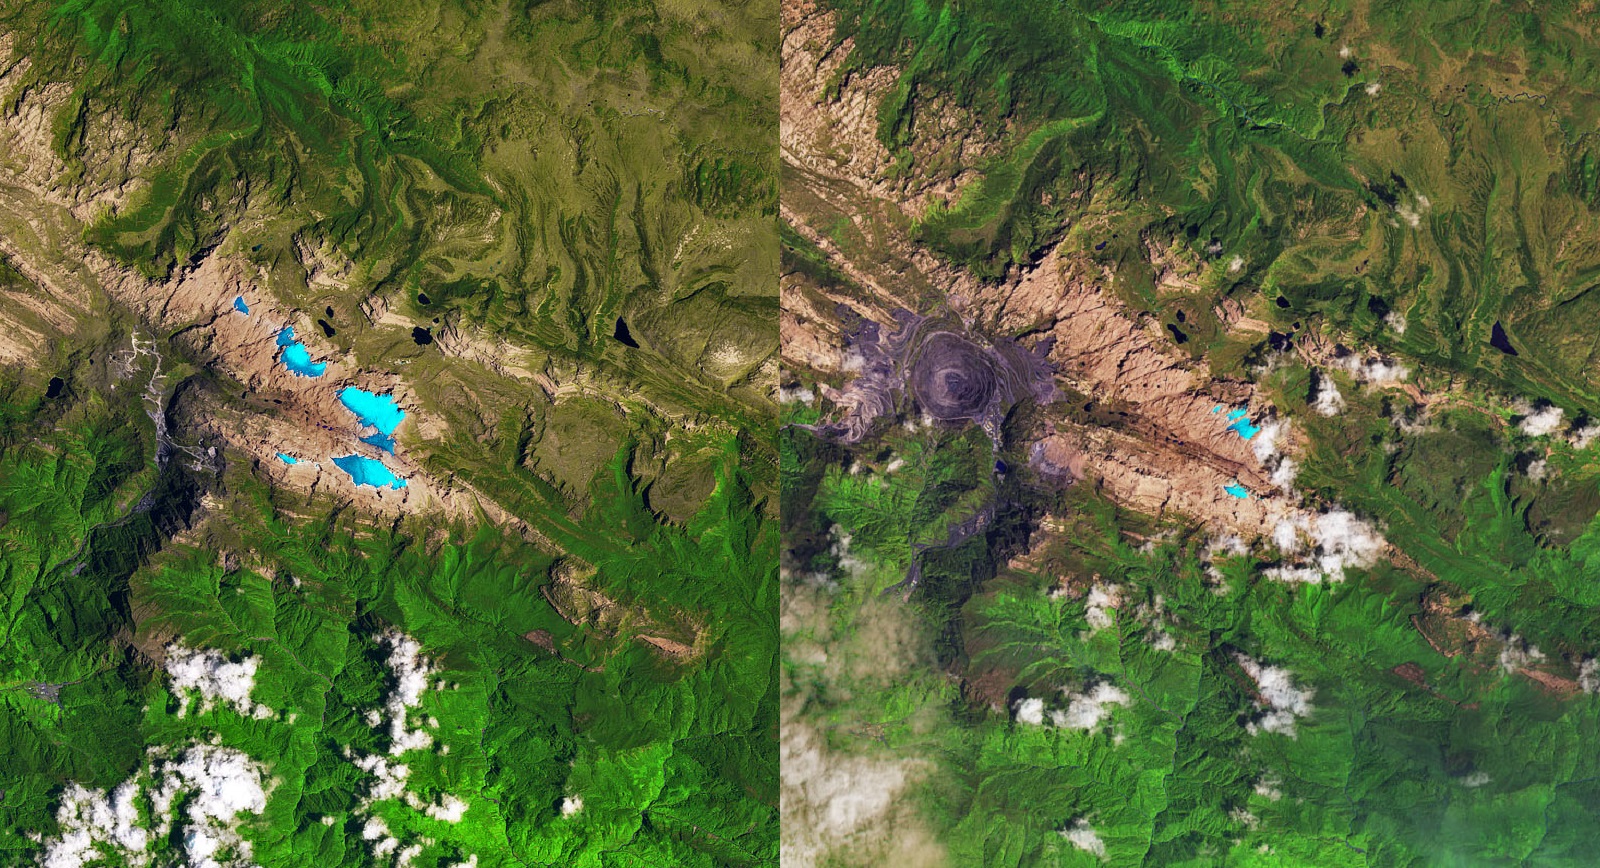
Side by side comparison of images taken of the Puncak Jaya icefields in New Guinea on Nov. 3rd, 1988 (left) and Dec. 5th, 2017 (right). Credit: NASA/EO
One of the most visible signs of Climate Change are the ways in which glaciers and ice sheets have been disappearing all over the world. This trend is not reserved to the Arctic ice cap or the Antarctic Basin, of course. On every part of the planet, scientists have been monitoring glaciers that have been shrinking in the past few decades to determine their rate of loss.
These activities are overseen by NASA’s Earth Observatory, which relies on instruments like the Landsat satellites to monitor seasonal ice losses from orbit. As these satellites demonstrated with a series of recently released images, the Puncak Jaya ice sheets on the south pacific island of Papua/New Guinea have been receding in the past three decades, and are at risk of disappearing in just a decade.
The Papau province of New Guinea has a very rugged landscape that consists of the mountains that make up Sudirman Range. The tallest peaks in this range are Puncak Jaya and Ngga Pulu, which stand 4,884 meters (16,020 feet) and 4,862 meters (15,950 feet) above sea level, respectively. Despite being located in the tropics, the natural elevation of these peaks allows them to sustain small fields of “permanent” ice.
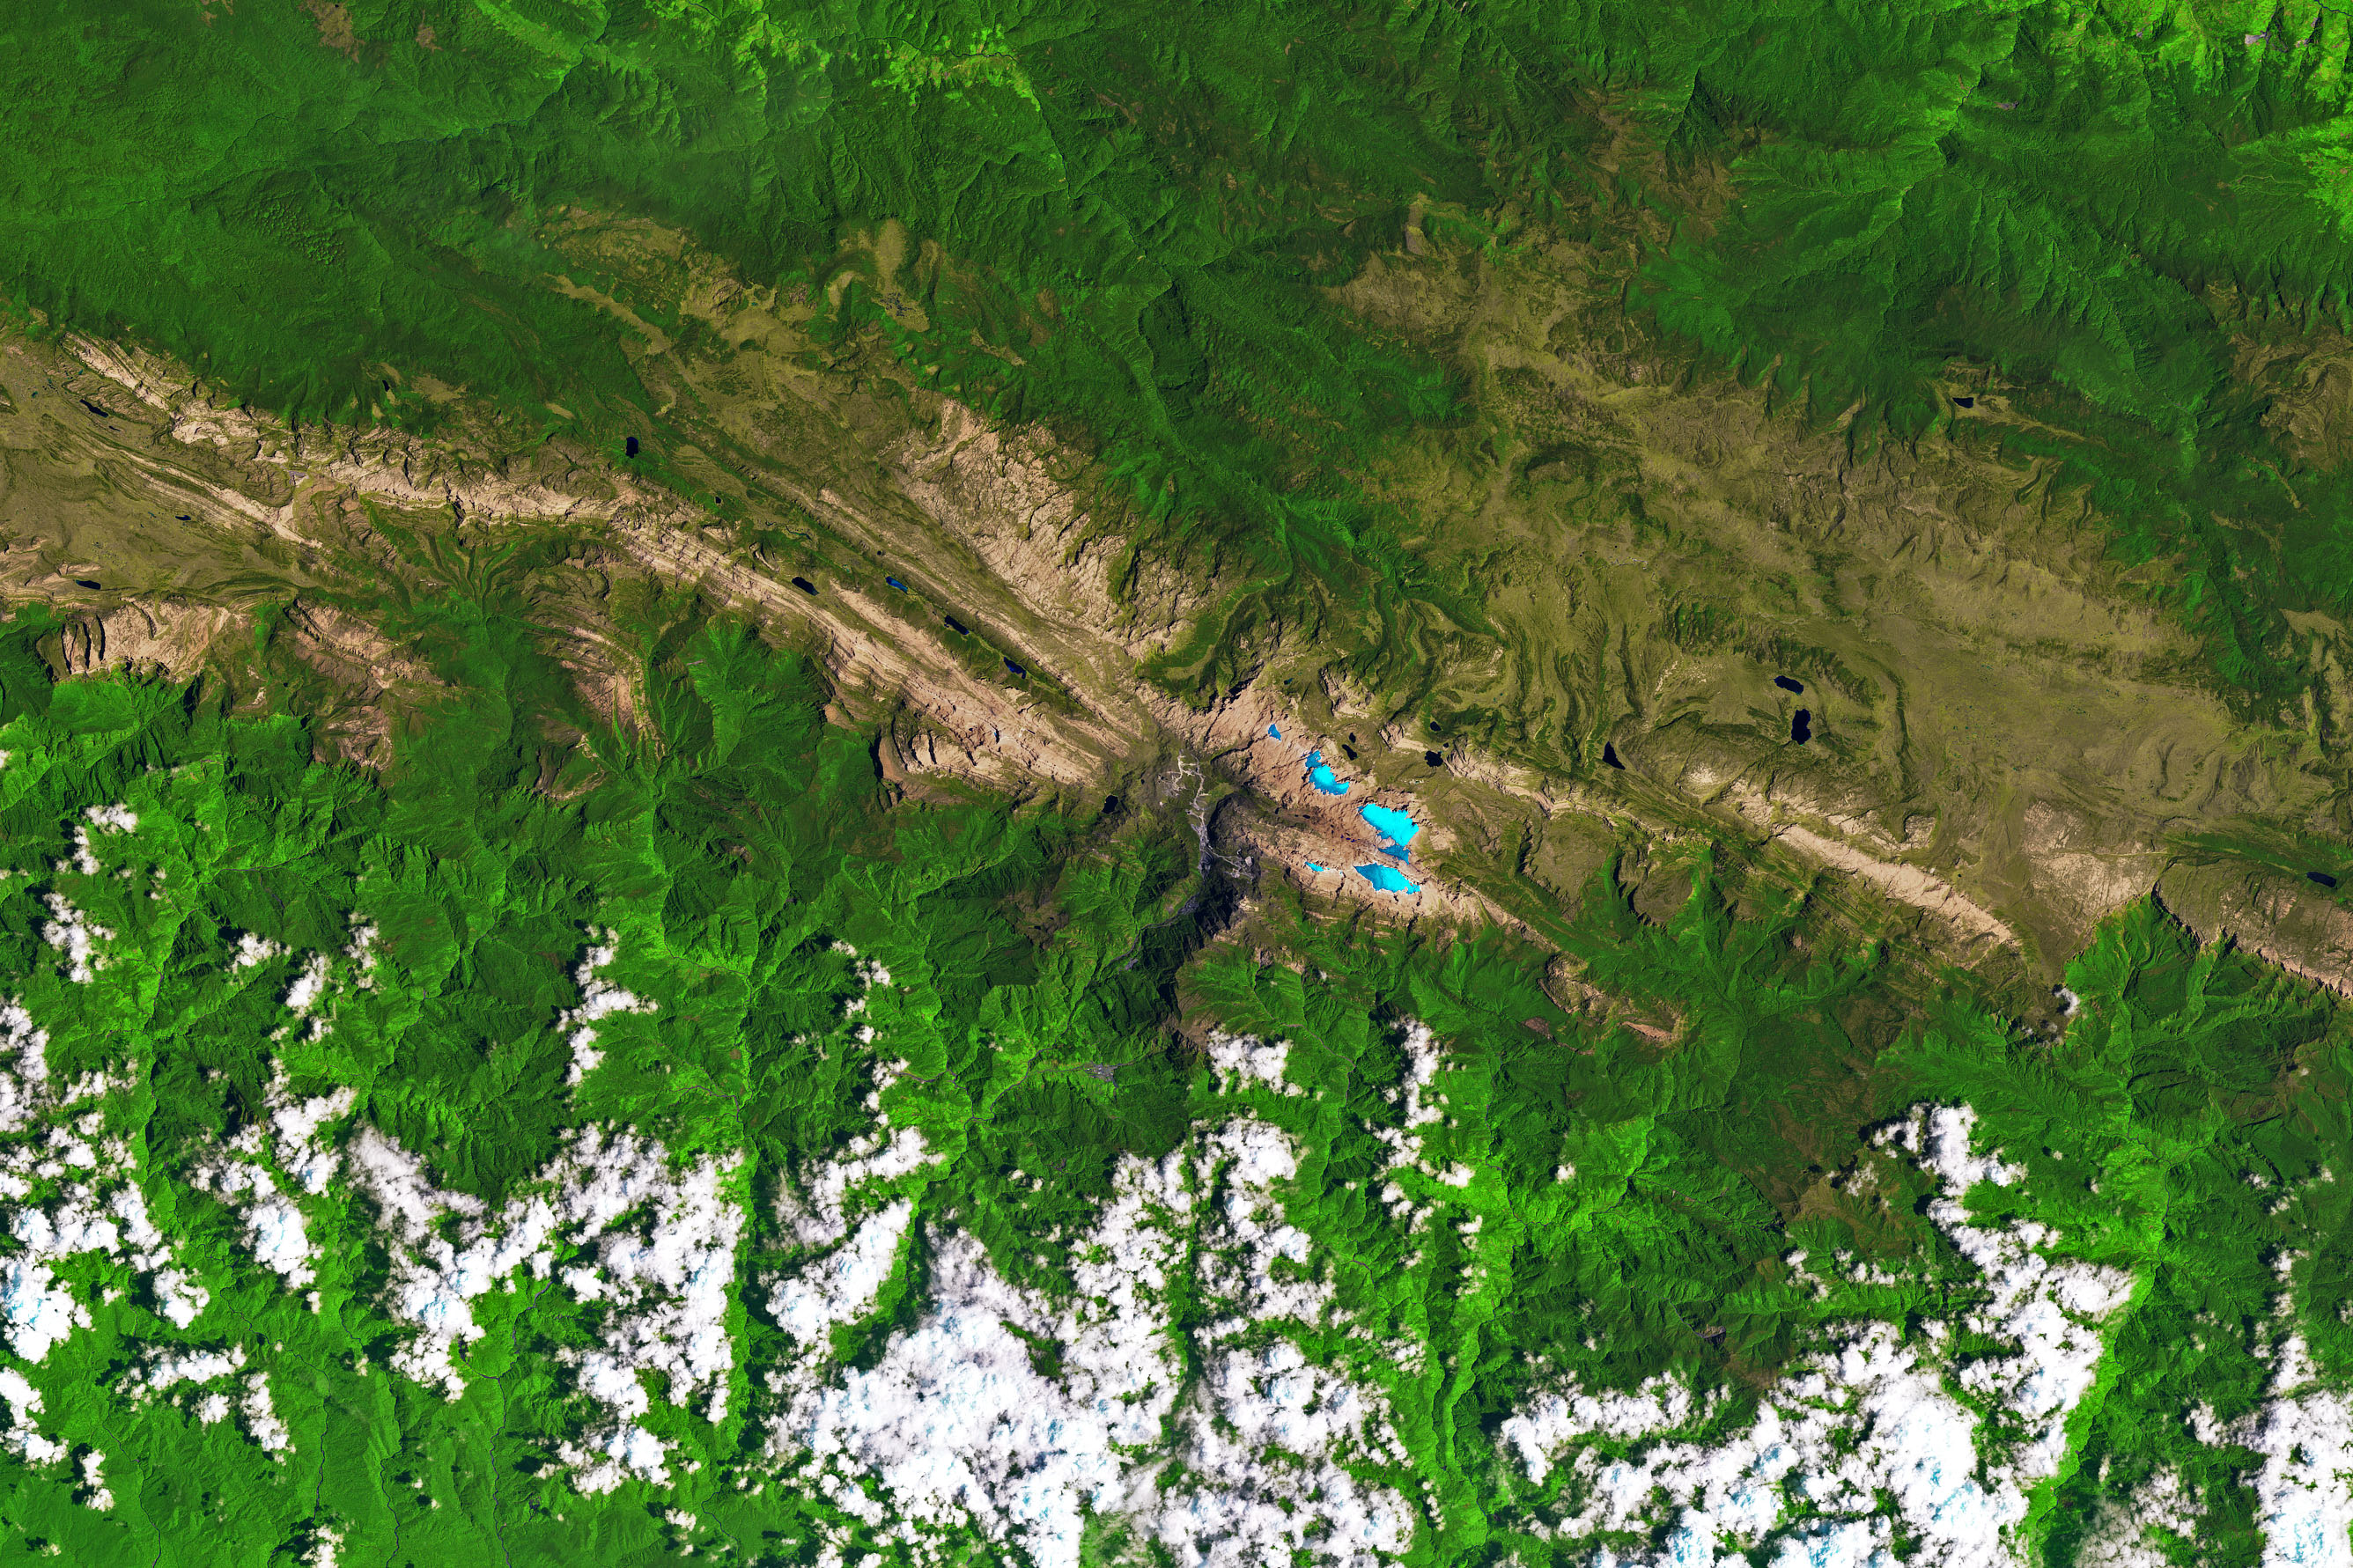
Image of the Puncak Jaya icefields, taken on Nov 3, 1988. Credit: NASA/EO
Given the geography, these ice fields are incredibly rare. In fact, within the tropics, the closest glacial ice is found 11,200 km (6,900 mi) away on Mount Kenya in Africa. Otherwise, one has to venture north for about 4,500 km (2,800 mi) to Mount Tate in central Japan, where glacial ice is more common since it is much farther away from the equator.
Sadly, these rare glaciers are becoming more threatened with every passing year. Like all tropical glaciers in the world today, the glaciers on the slopes around Puncak Jaya have been shrinking at a such a rate that scientists estimate that they could be gone within a decade. This was illustrated by a pair of Landsat images that show how the ice fields have shrunk over the past thirty years.
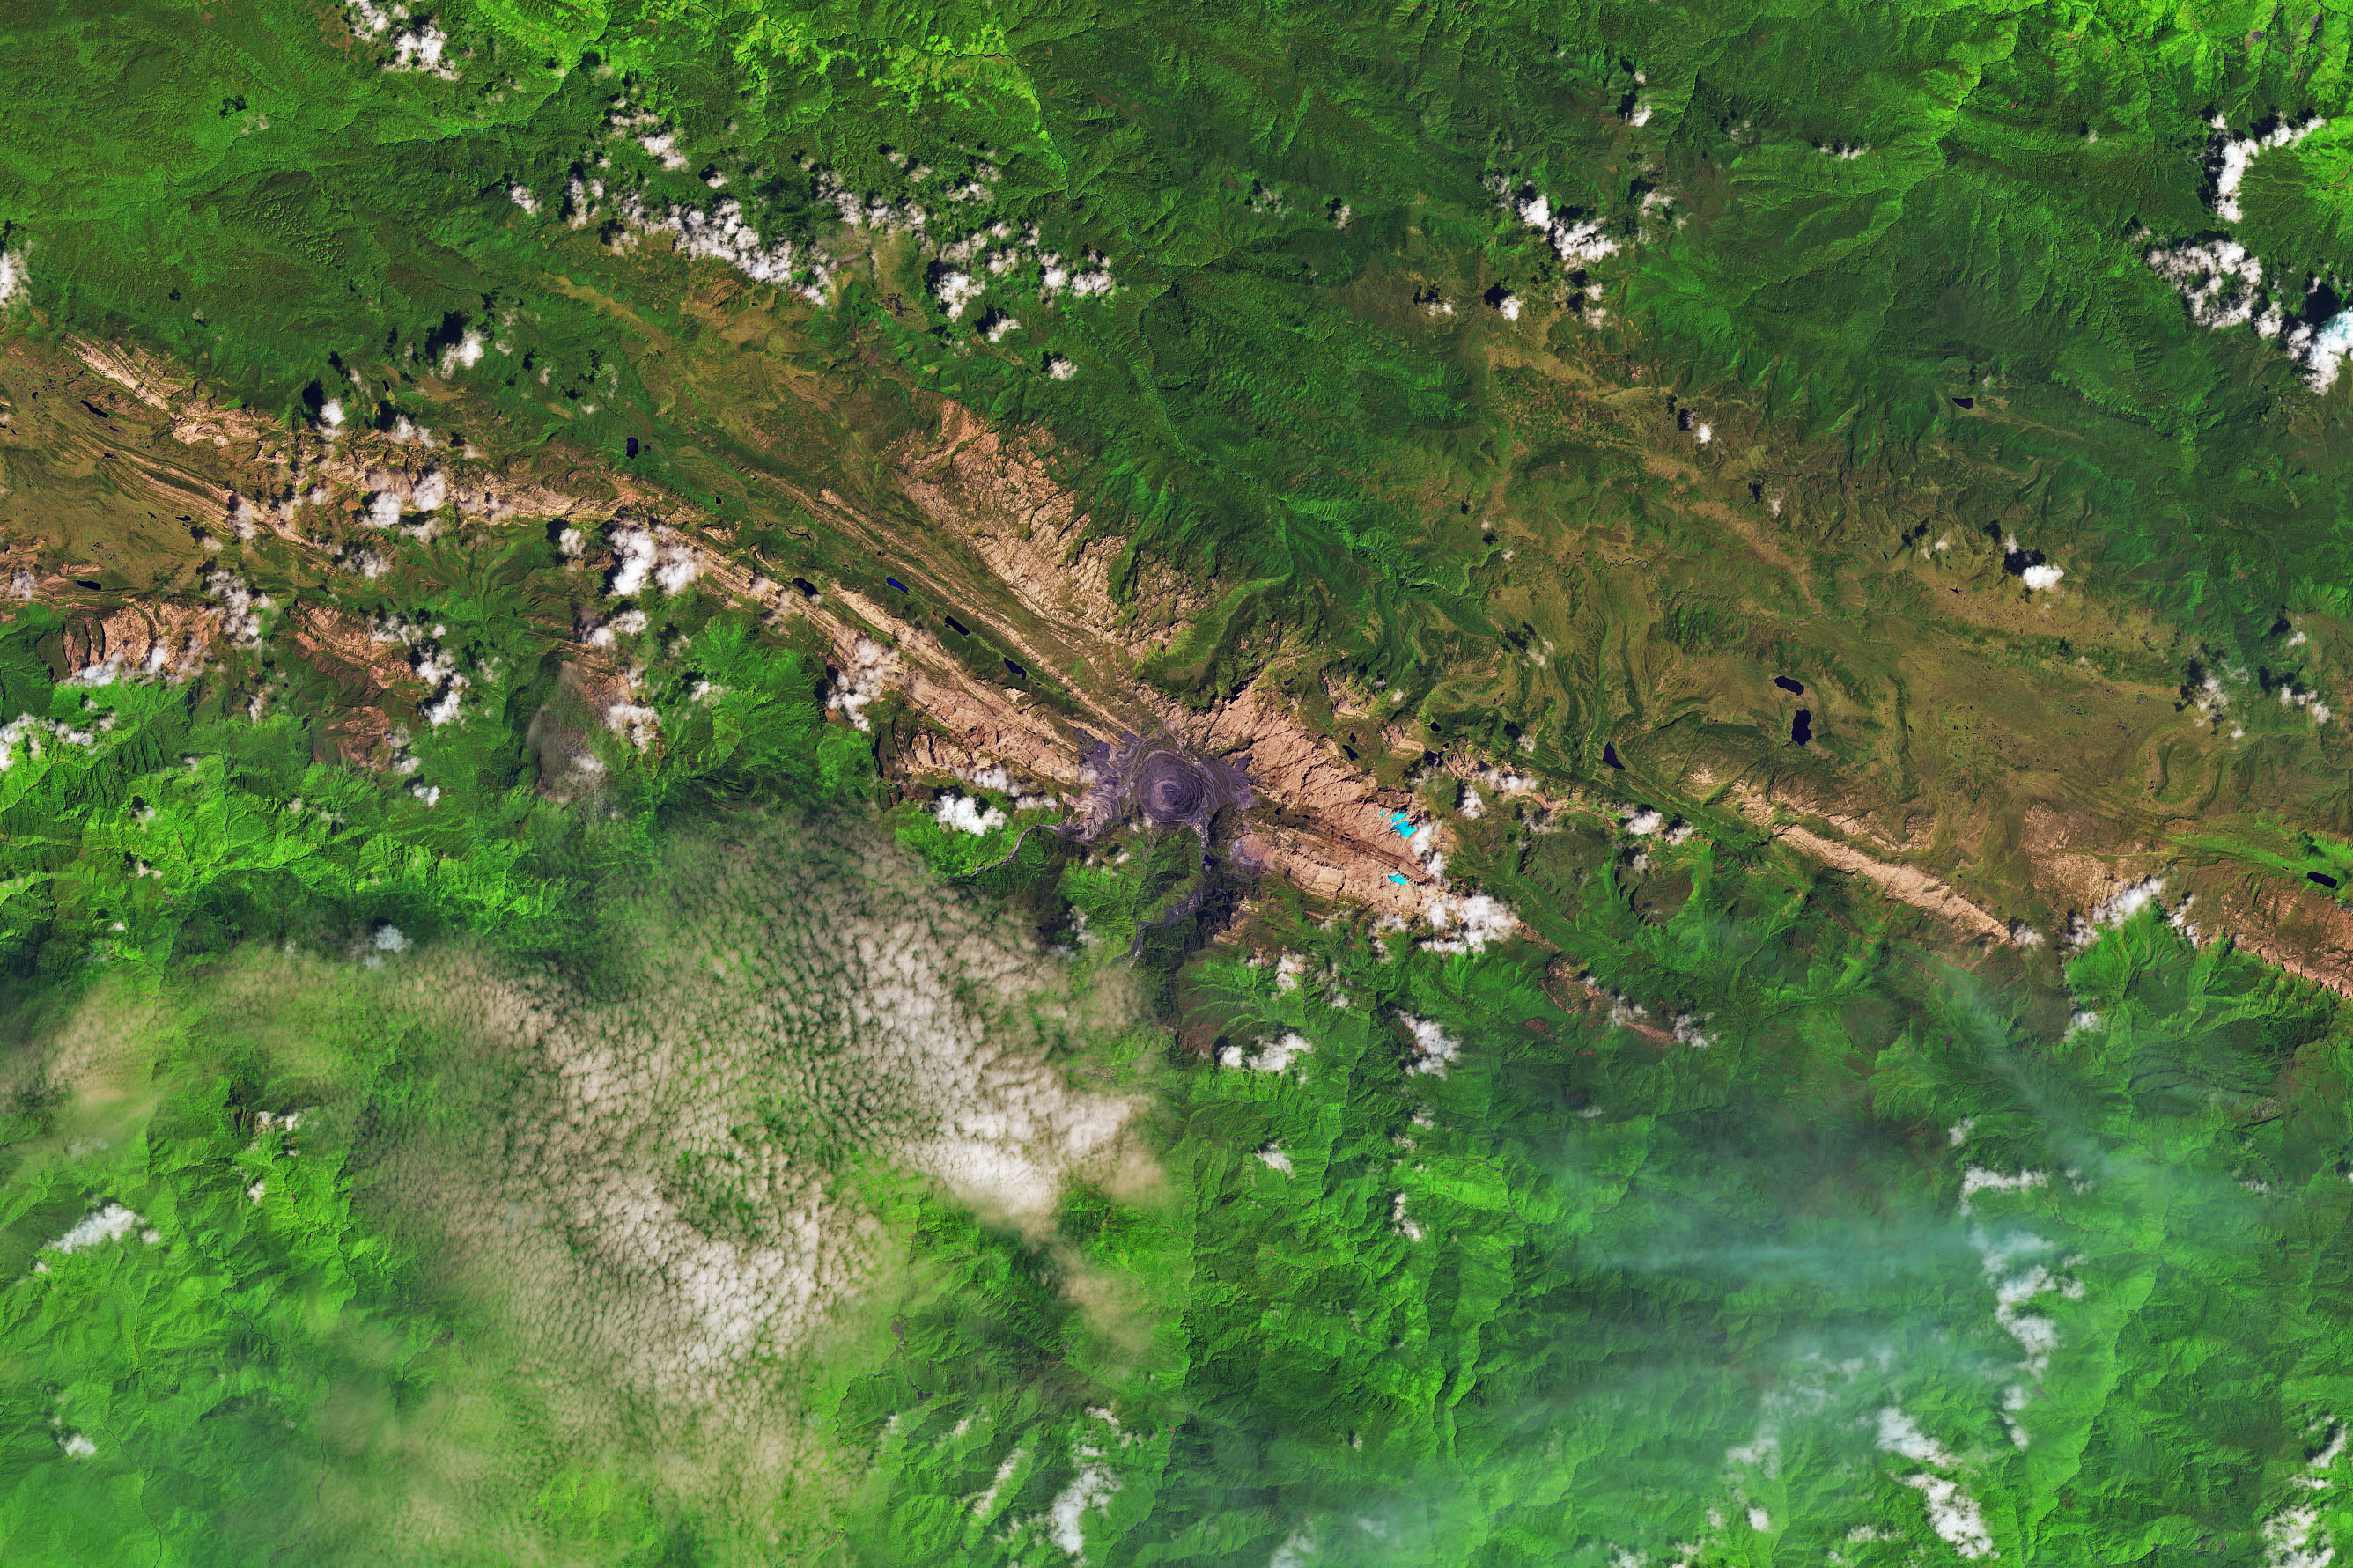
The first of these images (shown above) was acquired on November 3rd, 1988, by the Thematic Mapper instrument aboard the Landsat 5 satellite. The second image (shown below) was acquired on December 5th, 2017, by the Operational Land Imager (OLI) on the Landsat 8 satellite. These false-color images are a combination of shortwave infrared, infrared, near-infrared, and red light.
The extent of the ice fields are shown in light blue, whereas rocky areas are represented in brown, vegetation in green, and clouds in white. The gray circular area near the center of the 2017 image is the Grasberg mine, the largest gold and second-largest copper mine in the world. This mine expanded considerably between the 1980s and 2000s are a result of a boom in copper prices.
Image of the Puncak Jaya icefields in New Guinea, taken on December 5, 2017. Credit: NASA/EO
As the images show, in 1988, there were five masses of ice resting on the mountain slopes – the Meren, Southwall, Carstensz, East Northwall Firn and West Northwall Firn glaciers. However, by 2017, only the Carstensz and a small portion of the East Northwall Firn glaciers remained. As Christopher Shuman, a research professor at the University of Maryland Baltimore County and NASA’s Goddard Space Flight Center, explained:
“The ice area losses since the 1980s here are quite striking, visible in the contrast of the blue ice with the reddish bedrock. Even though the area still gets snowfalls, it is clearly not sustaining these glacial remnants.”
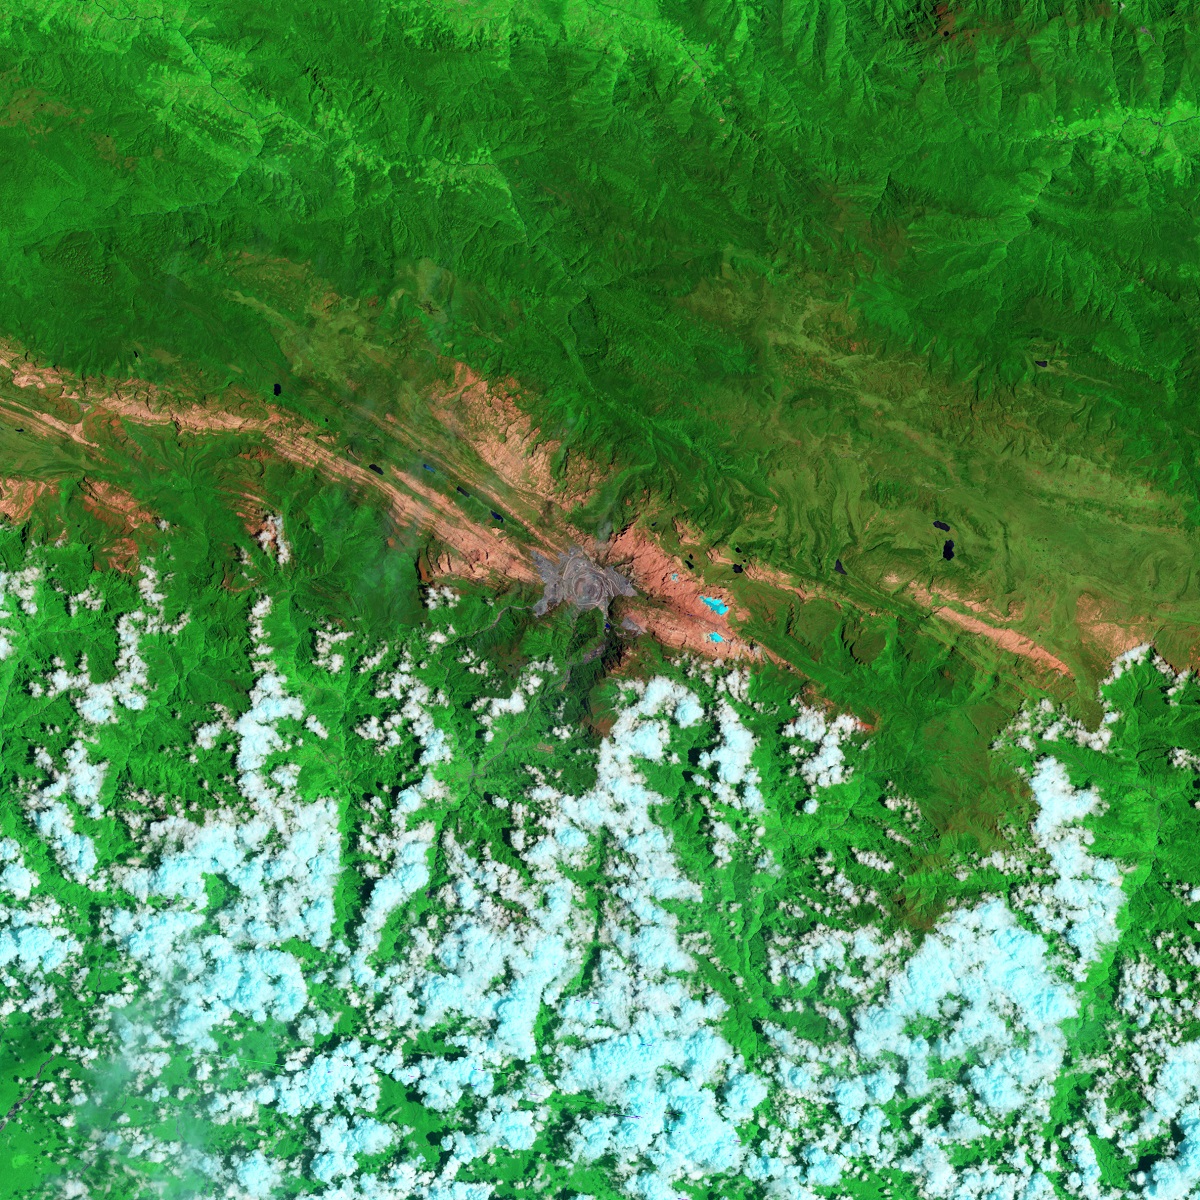
Similarly, in 2009, images taken by Landsat 5 of these same glaciers (see below) indicated that the Meren and Southwall glaciers had disappeared. Meanwhile, the Carstensz, East Northwall Firn and West Northwall Firn glaciers had retreated dramatically. Based on the rate of loss, scientists estimated at the time that all of Puncak Jaya’s glaciers would be gone within 20 years.
As these latest images demonstrate, their estimates were right on the money. At their current rate, what remains of the Carstensz and East Northwall Firn glaciers will be gone by the late 2020s. The primary cause of the ice loss is rising air temperatures, which leads to rapid sublimation. However, changes in humidity levels, precipitation patterns and cloudiness can also have an impact.
Image of the Puncak Jaya icefields in New Guinea, October 9, 2009. Credit: NASA/EO
Humidity is also important, since it affects how readily glaciers can lose mass directly to the atmosphere. Where the air is more moist, ice is able to make the transition to water more easily, and can be returned to the glacier in the form of precipitation. Where the air is predominately dry, ice makes the transition directly from a solid form to a gaseous form (aka. sublimation).
Temperature and precipitation are also closely linked to ice loss. Where temperatures are low enough, precipitation takes the form of snow, which can sustain glaciers and cause them to grow. Rainfall, on the other hand, will cause ice sheets to melt and recede. And of course, clouds affect how much sunlight reaches the glacier’s surface, which results in warming and sublimation.
For many tropical glaciers, scientists are still working out the relative importance of these factors and attempting to determine to what extent anthropogenic factors plays a role. In the meantime, tracking how these changes are leading to ice loss in the tropical regions provides scientists with a means of comparison when studying ice loss in other parts of the world.
As Andrew Klein, a geography professor at Texas A & M University who has studied the region, explained:
“Glacier recession continues in the tropics—these happen to be the last glaciers in the eastern tropics. Fortunately, the impact will be limited given their small size and the fact that they do not represent a significant water resource.”
Satellites continue to play an important role in the monitoring process, giving scientist the ability to map glacier ice loss, map seasonal changes, and draw comparisons between different parts on the planet. They also allow scientists to monitor remote and inaccessible areas of the planet to see how they too are being affected. Last, but not least, they allow scientists to estimate the timing of a glacier’s disappearance.
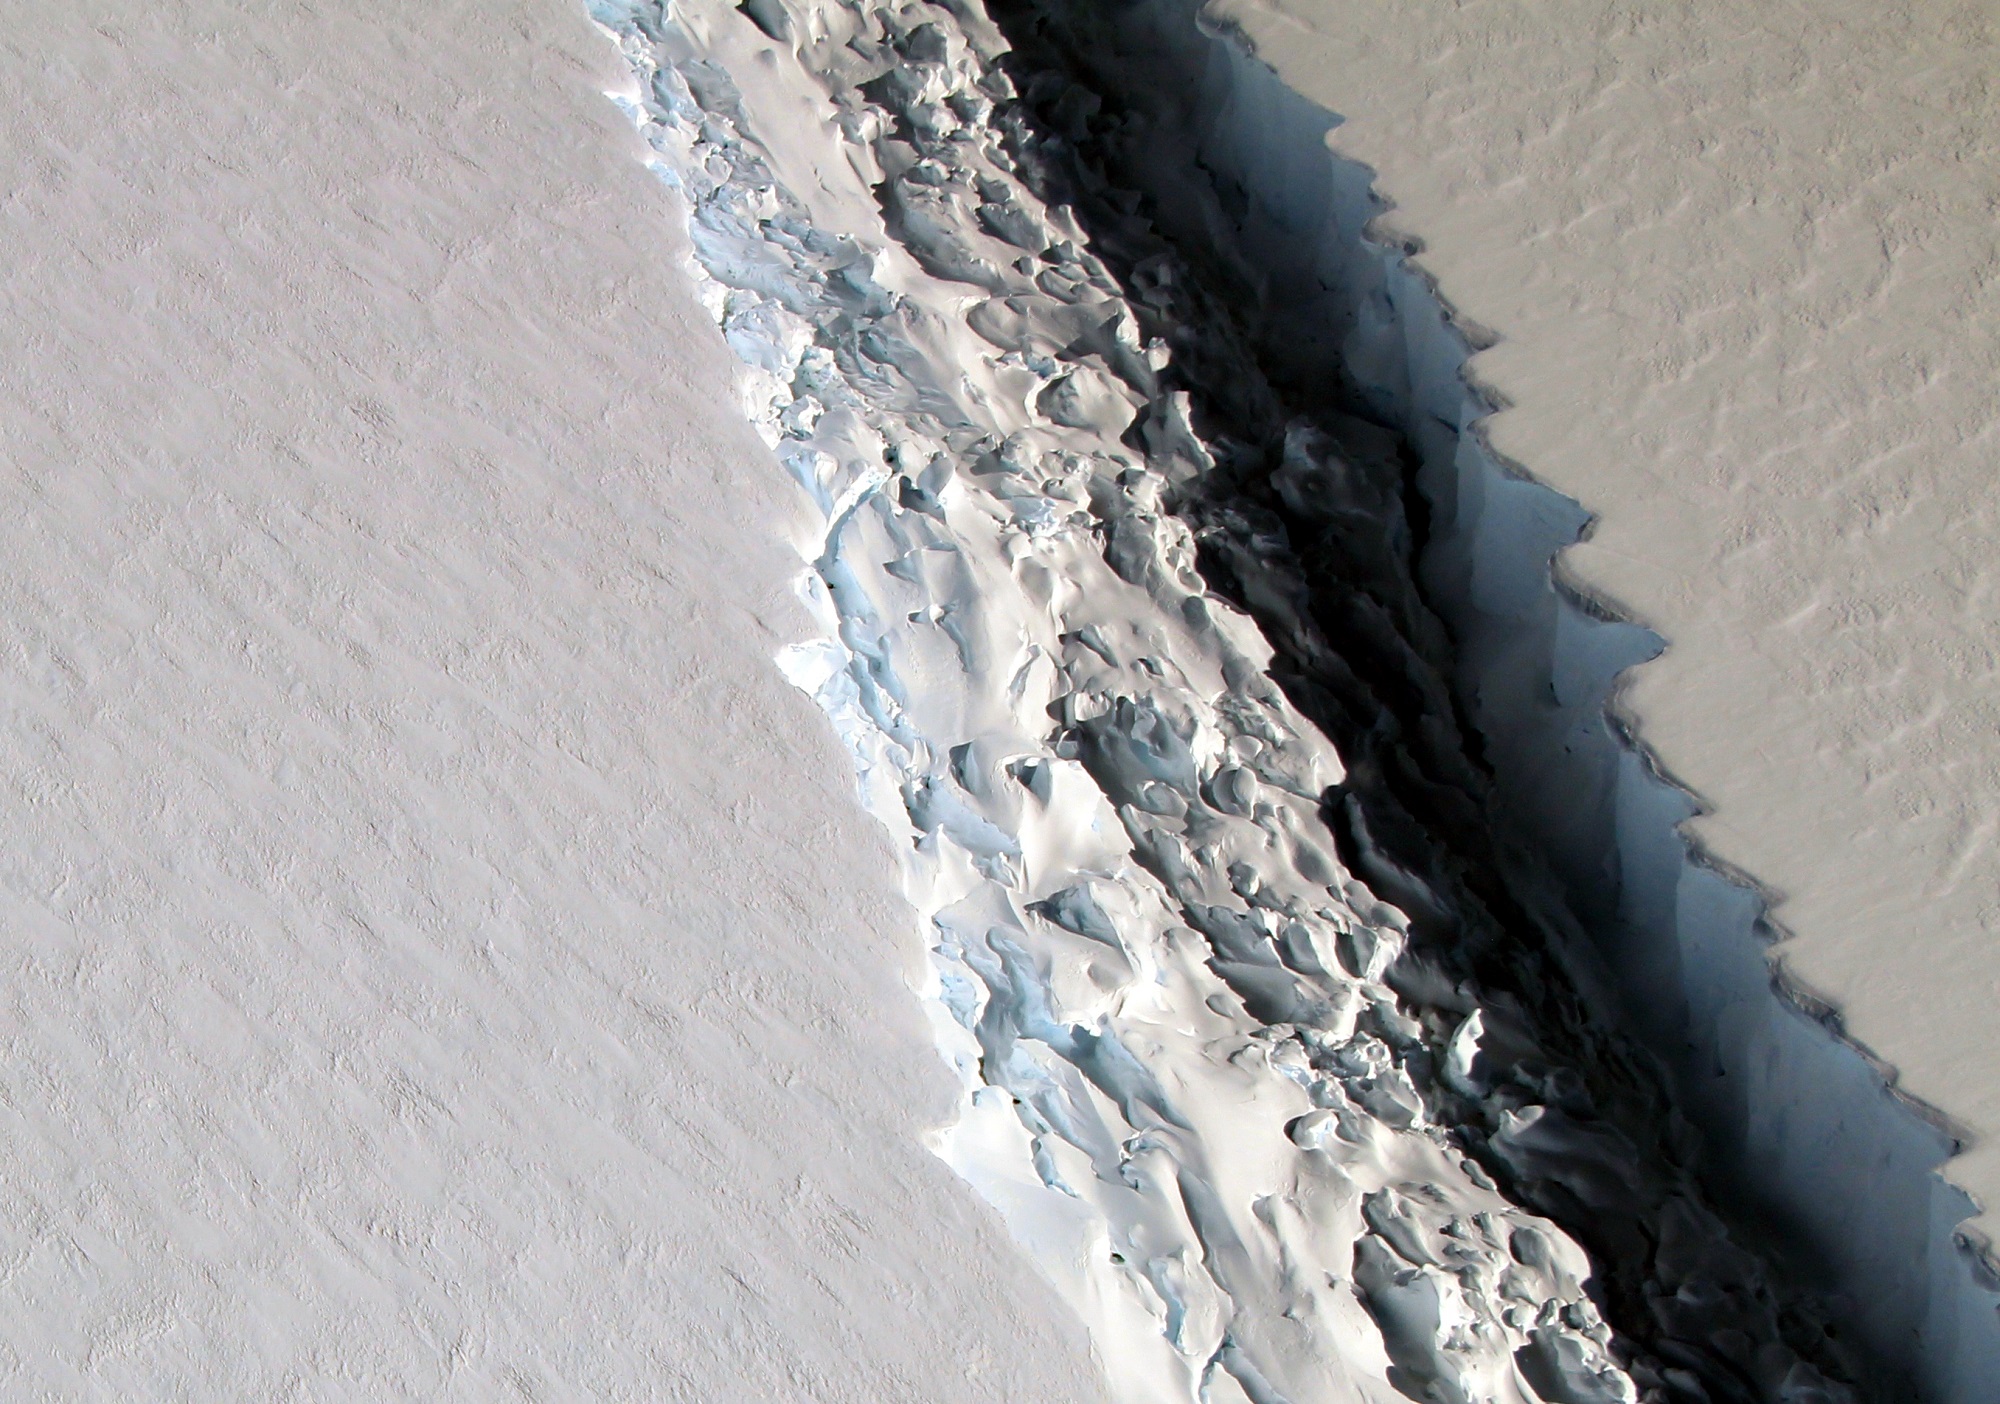
The rift in the Larsen C Ice Shelf. Credit: NASA/John Sonntag
Located along the east coast of the Antarctic Peninsula is the Larsen Ice Shelf. Named after the Norwegian Captain who explored the ice front back in 1893, this ice shelf has been monitored for decades due to its close connection with rising global temperatures. Essentially, since the 1990s, the shelf has been breaking apart, causing collapses of considerable intensity.
According to the British Antarctic Survey (BAS), the section of the ice sheet known as the Larsen C Ice Shelf could be experiencing a collapse of its own soon enough. Based on video footage and satellite evidence of the sizeable rift (which is 457 m or 15oo ft across) in the shelf, it is believed that an ice berg that is roughly 5,000 km² (1930.5 mi²) in size could be breaking off and calving into the ocean in the near future.
An ice shelf is essentially a floating extension of a land-based glacier. In this case, the Larsen Ice Shelf is seaborne section of the larger Larsen Glacier, which flows southeast past Mount Larsen and enters the Ross Sea just south of Victoria Land. These shelves often act as buttresses, holding back glaciers that flow down to the coast, thus preventing them from entering the ocean and contributing to rising sea levels.
In the past twenty-two years, the Larsen A and B ice shelves (which were situated further north along the Antarctic Peninsula) both collapsed into the sea. This resulted in the dramatic acceleration of glaciers behind them, as larger volumes of ice were able to flow down the coast and drop into the ocean. While Larsen C appeared to still be stable, in November of 2016, NASA noted the presence of a large crack in its surface.
This crack was about 110 kilometers (68 mi) long and was more than 91 m (299 ft) wide, reaching a depth of about 500 m (1,600 ft). By December, the rift had extended another 21 km (13 mi), which raised concerns about calving. In February of 2017, satellite observations of the shelf noted that the crack appeared to have grown further, which confirmed what researches from the MIDAS project had previously reported.
This UK-based Antarctic research project – which is based at Swansea University and Aberystwyth University in Wales and supported by the BAS and various international partners – is dedicated to monitoring the Larsen C ice shelf in Antarctica. Through a combination of field work, satellite observations, and computer simulations, they have catalogued how recent warming trends has caused seasonal melts of the ice shelf and affected its structure.
And in recent years, they have been monitoring the large crack, which has been fast-moving, and noted the appearance of several elongations. It was during the current Antarctic field season that members of the project filmed what the crack looked like from the air. In previous surveys, the glaciology research team has conducted research on the ice shelf using seismic techniques to survey the seafloor beneath it.
However, this past season, they did not set up on the ice shelf itself for fear of a calving event. Instead, they made a series of trips to and from the UK’s Rothera Research Station aboard twin otter aircraft. During an outing to retrieve some of their science equipment, the crew noted how the crack looked from above and started filming. As you can see from the footage, the rift is very wide and extremely long.
What’s more, the team estimates that if an iceberg from this shelf breaks off and falls into the ocean, it will likely be over three times the size of cities like London or New York City. And while this sort of thing is common with glaciers, the collapse of a large section of Larsen C could speed the flow of the Larsen Glacier towards the Antarctic Ocean.
As Dr Paul Holland, an ice and ocean modeller at the British Antarctic Survey, said in a recent press release:
“Iceberg calving is a normal part of the glacier life cycle, and there is every chance that Larsen C will remain stable and this ice will regrow. However, it is also possible that this iceberg calving will leave Larsen C in an unstable configuration. If that happens, further iceberg calving could cause a retreat of Larsen C. We won’t be able to tell whether Larsen C is unstable until the iceberg has calved and we are able to understand the behavior of the remaining ice. The stability of ice shelves is important because they resist the flow of the grounded ice inland. After the collapse of Larsen B, its tributary glaciers accelerated, contributing to sea-level rise.”
One of the greatest concerns about climate change is the feedback mechanisms it creates. In addition to increased warming trends caused by rising levels of CO² in the atmosphere, the melting of glaciers and the breakup of ice shelves can have a pronounced effect on sea levels. In the end, the depletion of glaciers in Antarctica could have dramatic consequences for the rest of the planet.
Colour-coded topographic view of the Colles Nili region, showing the relative heights and depths of terrain. Credit: ESA/DLR/FU Berlin
In the northern hemisphere of Mars, between the planet’s southern highlands and the northern lowlands, is a hilly region known as Colles Nilli. This boundary-marker is a very prominent feature on Mars, as it is several kilometers in height and surrounded by the remains of ancient glaciers.
And thanks to the Mars Express mission, it now looks like this region is also home to some buried glaciers. Such was the conclusion after the orbiting spacecraft took images that revealed a series of eroded blocks along this boundary, which scientists have deduced are chunks of ice that became buried over time.
The Mars Express images show a plethora of these features along the north-south boundary. They also reveal several features that hint at the presence of buried ice and erosion – such as layered deposits as well as ridges and troughs. Similar features are also found in nearby impact craters. All of these are believed to have been caused by an ancient glacier as it retreated several hundred million years ago.
Artist’s impression of the Mars Express spacecraft in orbit. Credit: ESA/Medialab
It is further reasoned that these remaining ice deposits were covered by debris that was deposited from the plateau as it eroded. Wind-borne dust was also deposited over time, which is believed to be the result of volcanic activity. This latter source is evidenced by steaks of dark material deposited around the blocks, as well as dark sand dunes spotted within the impact craters.
Similar features are believed to exist within many boundary regions on Mars, and are believed to represent periods of glaciation that took place over the course of eons. And this is not the first time buried glaciers have been spotted on Mars.
For instance, back in 2008, the Mars Reconnaissance Orbiter (MRO) used its ground-penetrating radar to locate water ice under blankets or rocky debris, and at latitudes far lower than any that had been previously identified. At the time, this information shed light on a long-standing mystery about Mars, which was the presence of what are called “aprons”.
These gently-sloping rocky deposit, which are found at the bases of taller features, were first noticed by NASA’s Viking orbiters during the 1970s. A prevailing theory has been that these aprons are the result of rocky debris lubricated by small amounts of ice.
Artist’s impression of the separation of the ExoMars entry, descent and landing demonstrator module (Schiaparelli) from the Trace Gas Orbiter (TGO). Credit: ESA/ATG medialab
Combined with this latest info taken from the northern hemisphere, it would appear that there is plenty of ice deposits all across the surface of Mars. The presence (and prevalence) of these icy remnants offer insight into Mars’ geological past, which – like Earth – involved some “ice ages”.
The Mars Express mission has been actively surveying the surface of Mars since 2003. On October 19th, it will be playing a vital role as the Exomars mission inserts itself into Martian orbit and the Schiaparelli lander makes its descent and landing on the Martian surface.
Alongside the MRO and the ExoMars Orbiter, it will be monitoring signals from the lander to confirm its safe arrival, and will relay information sent from the surface during the course of its mission.
The ESA will be broadcasting this event live. And given that this mission will be the ESA’s first robotic lander to reach Mars, it should prove to be an exciting event!
Mount Everest from Kalapatthar. Photo: Pavel Novak
When beholding the sheer size and majesty of mountains, ancient humans could not help but feel that they were standing in the presence of something… godlike. And within the belief systems of many ancient cultures, it was generally felt that mountains were something spiritual – either serving as the home of the Gods, a result of their activity, or a place to get closer to God.
Thanks to modern geology, we now know the true story of how mountains are formed. Simply put, they are the result of tectonic forces or volcanism. But knowing this has not diminished their impressive and awe-inspiring nature. When a geological formation is created through forces that can only be described as titanic, this is to be expected. But just how are mountains formed?
In truth, there are three ways in which mountains are formed, which correspond to the types of mountains in question. These are known as volcanic, fold and block mountains. All of these are the result of plate tectonics, where compressional forces, isostatic uplift and intrusion of igneous matter forces surface rock upward, creating a landform higher than the surrounding features.
Over the course of many million years, these uplifted sections are eroded by the elements – wind, rain, ice and gravity. These gradually wear the surface of the mountains down, cause the surface to be younger than the rocks that form them, and lead to the types of formations and distributions we are familiar with today.
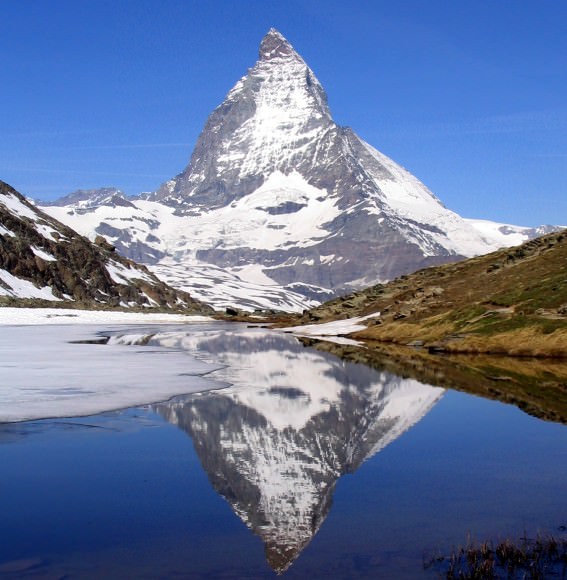
The East side of the Matterhorn, a fold mountain that measures 4,478 meters in height, mirrored in lake Riffelsee. Credit: Wikipedia Commons/Dirk Beyer
Volcanic Mountains:
Volcanic mountains are formed when a tectonic plate is pushed beneath another (or above a mid-ocean ridge or hotspot) where magma is forced to the surface. When the magma reaches the surface, it often builds a volcanic mountain, such as s shield volcano or a stratovolcano. Examples of this sort of mountains include Mount Fuji in Japan, Mauna Kea in Hawaii, Nyamuragira in the Democratic Republic of Congo, Skjaldbreiður in Iceland and Mount Etna in Sicily.
At other times, the rising magma solidifies below the surface and forms dome mountains, where material is pushed up from the force of the build-up beneath it. Examples of this formation include Navajo Mountain in San Juan County, Utah; the Chaitén lava dome of Chile, Torfajökull in Iceland, and Mount St. Helens in Washington State.
Fold Mountains:
As the name suggests, fold mountains occur when two tectonic plates collide at a convergent plate boundary, causing the crust to overthicken. This process forces the less dense crust to float on top of the denser mantle rocks – with material being forced upwards to form hills, plateaus or mountains – while a greater volume of material is forced downward into the mantle.
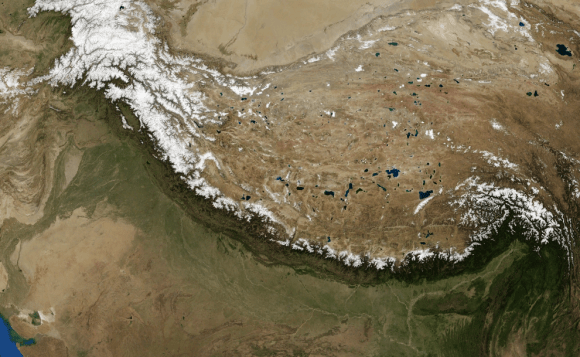
Satellite image of the Himalayan mountain chain, as imaged by NASA’s Landsat-7 satellite. Credit: NASA
The Jura Mountains, a series of sub-parallel mountain ridges located in the Alps, are an example of fold mountains. Other examples include the “Simply Folded Belt” of the Zagros mountains, which extends from northern Syria and southern Turkey to eastern Iran and the Persian Gulf. There is also the Akwapim-Togo ranges in Ghana and the Ridge-and-Valley Appalachians in the Eastern United States.
But perhaps most famous is the Himalayan mountain chain, located between northern India and Nepal. This chain formed as a result of the collision between the Indian subcontinent and Asia some 25 million years ago, and has given rise to the tallest mountain in the world – Mt. Everest.
Block Mountains:
Block mountains are caused by faults in the crust, a seam where rocks can move past each other. Also known as rifting, this process occurs when rocks on one side of a fault rise relative to the other. The uplifted blocks become block mountains (also known as horsts) while the intervening dropped blocks are known as graben (i.e. depressed regions).
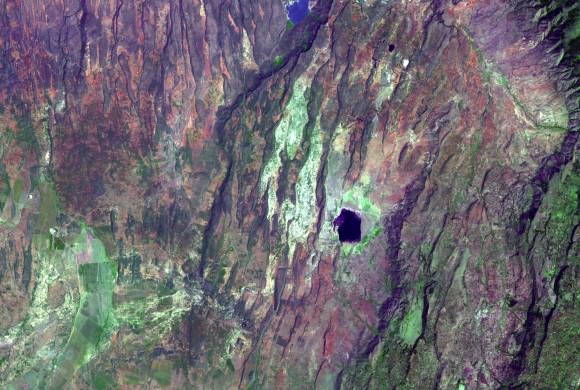
Examples of this type of terrain can be found in the Upper Rhine valley, the Vosges mountains in France, the Black Forest in Germany, and the Vindhya and Satpura horsts in India. There is also the East African Rift, an active continental rift zone with several active volcanoes that extends from Eritrea to Mozambique.
Satellite image of the East African Rift, taken on December 18th, 2002. Credit: NASA/GSFC/METI/Japan Space Systems/U.S.-Japan ASTER Science Team
Mountain Erosion:
As noted, the final way in which mountains are formed is through erosion. This occurs during and after an uplift, where a newly formed mountainous region is subjected to the effects of wind, water, ice, and gravity. These forces actively shape the surface of mountain ranges, wearing down the exposed surfaces, depositing sediment in alluvial flows, and leading to the formation of characteristic landforms.
These include pyramidal peaks, knife-edge arêtes, and bowl-shaped cirques that can contain lakes. Plateau mountains, such as the Catskills, are formed from the erosion of an uplifted plateau. And after millions of years of erosion, mountains may cease to exist entirely.
Given the size and scale of a mountain, the immense forces involved in their creation, and the immense amount of time it takes to shape and form them, it is little wonder why they are considered such a big deal. Between their religious significance (i.e. Mount Zion, Mount Olympus, Mount Ararat, and Mauna Kea, to name a few), their scenic value, the challenge they present, and their importance to the Earth sciences, these geological formations continue to enjoy a special place in our hearts, minds and culture.
As we explore other planets, we have also found new and impressive mountain formations that have taught us much about the geological activity and composition of other worlds. For example, there the volcanic mountain on Mars known as Olympus Mons, which just happens to be the largest mountain in the Solar System. And this is merely a drop in the bucket. Wherever there’s a geologically active planet, there’s mountains to be found!
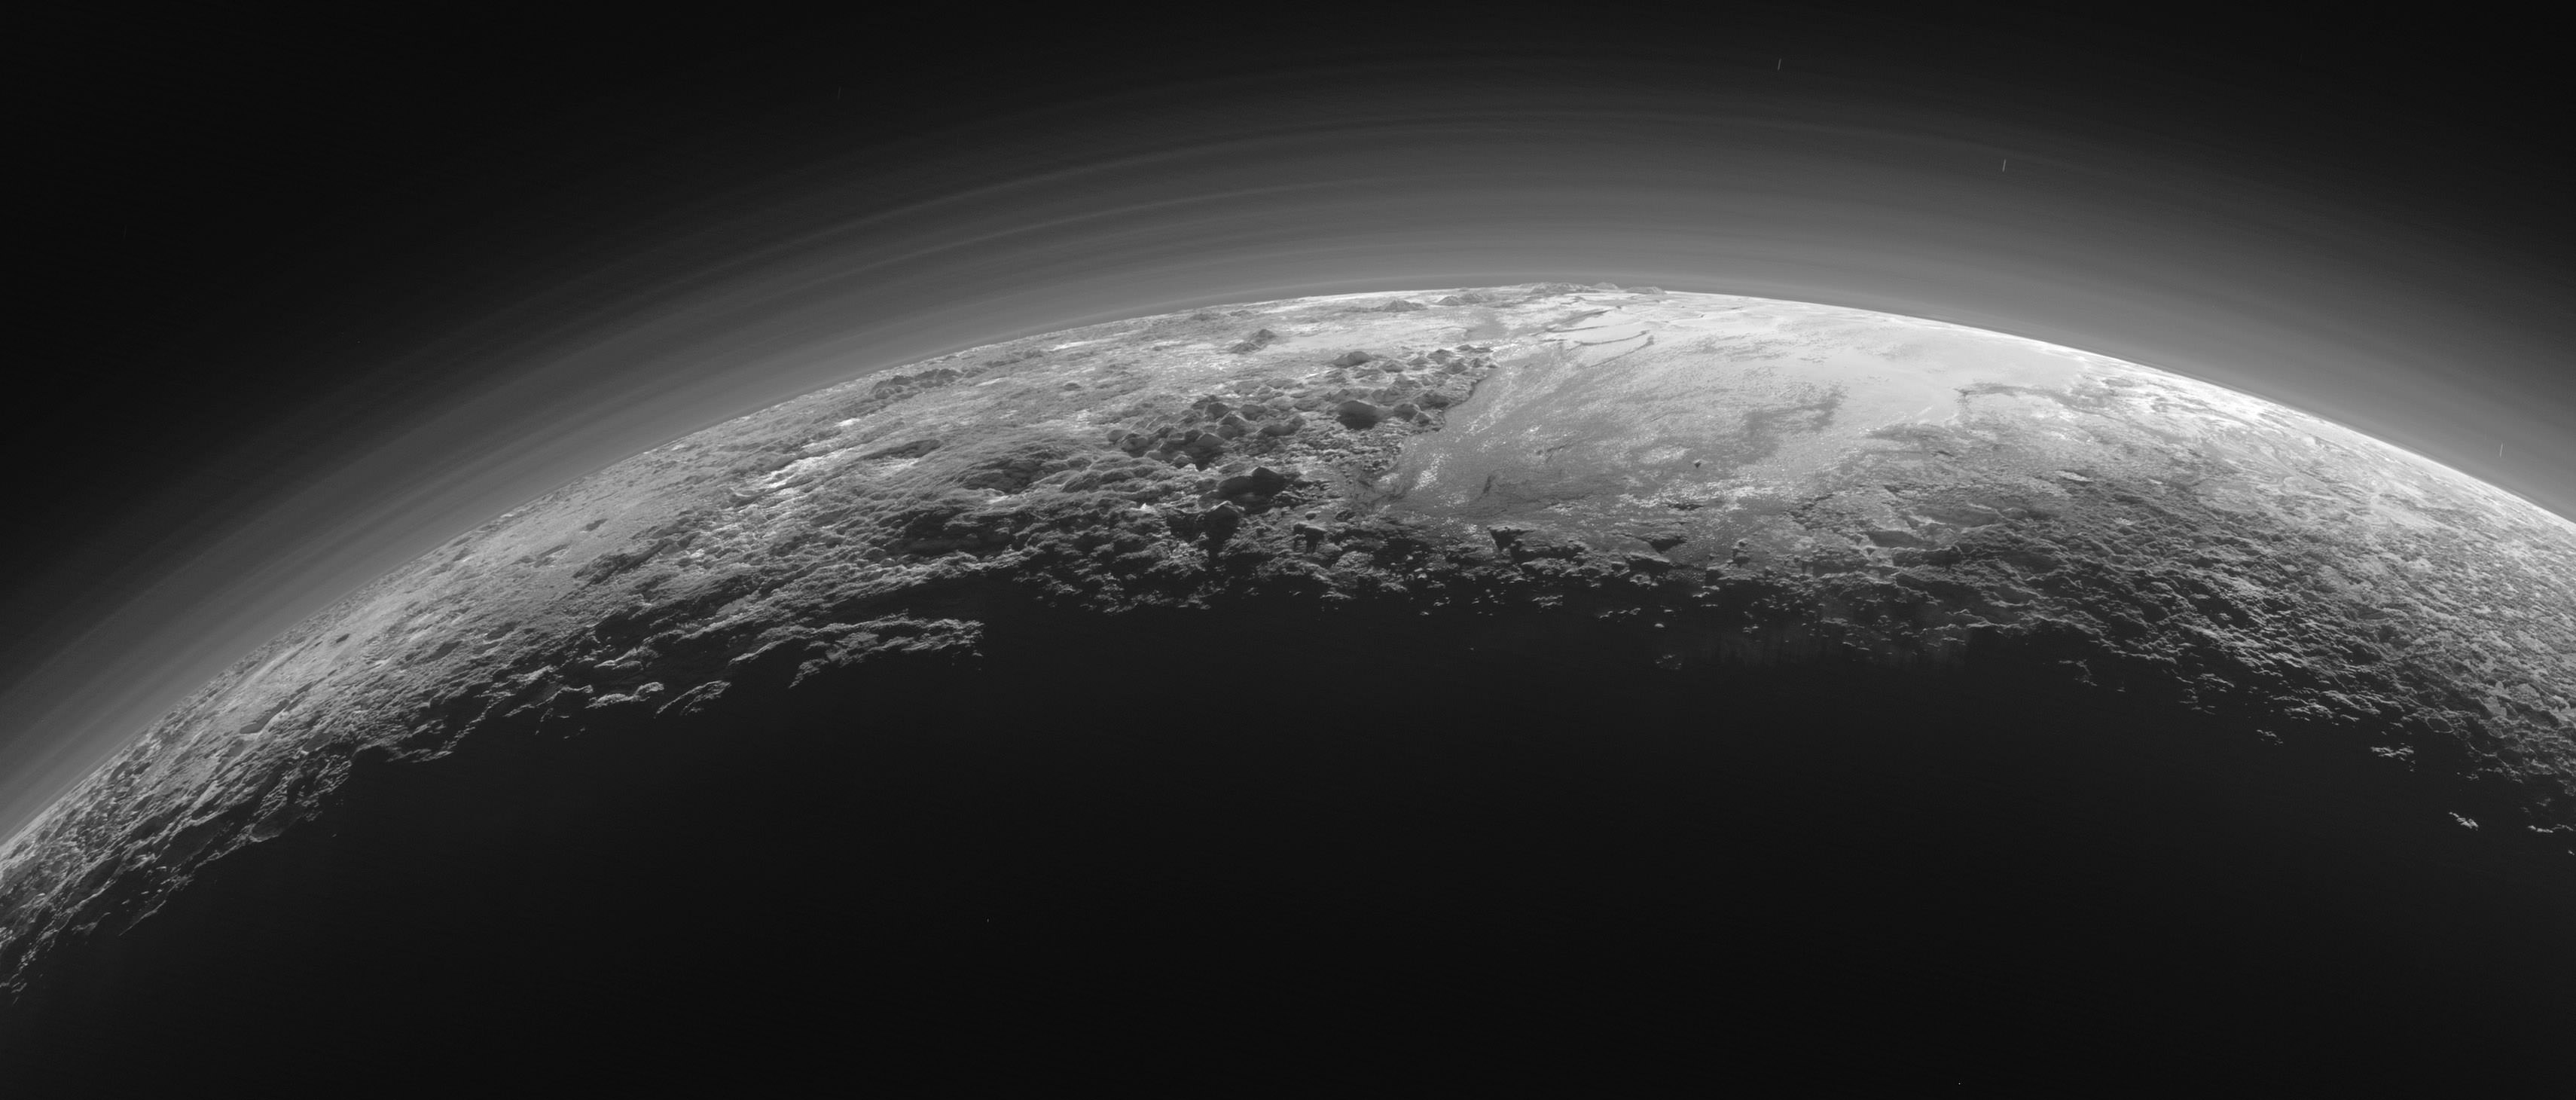
Pluto’s Majestic Mountains, Frozen Plains and Foggy Hazes: Just 15 minutes after its closest approach to Pluto on July 14, 2015, NASA’s New Horizons spacecraft looked back toward the sun and captured this near-sunset view of the rugged, icy mountains and flat ice plains extending to Pluto’s horizon. The smooth expanse of the informally named icy plain Sputnik Planum (right) is flanked to the west (left) by rugged mountains up to 11,000 feet (3,500 meters) high, including the informally named Norgay Montes in the foreground and Hillary Montes on the skyline. To the right, east of Sputnik, rougher terrain is cut by apparent glaciers. The backlighting highlights over a dozen layers of haze in Pluto’s tenuous but distended atmosphere. The image was taken from a distance of 11,000 miles (18,000 kilometers) to Pluto; the scene is 780 miles (1,250 kilometers) wide.
Credits: NASA/JHUAPL/SwRI
As the hazy, lazy days of summer come to a close, the New Horizons team released a brand new set of incredible images of a very atmospheric Pluto.
Can you believe the detail in these photos? Back-lit by the Sun, we see icy plains, rugged mountains, glacier-cut terrain and multiple layers of haze just like those on a steamy August afternoon.
Just look at those pyramidal mountain peaks right next to those relatively smooth, icy plains. The backlighting highlights more than a dozen layers of haze in Pluto’s tenuous but distended atmosphere. The image was taken from a distance of 11,000 miles (18,000 km) to Pluto; the scene is 230 miles (380 km) across. Credits: NASA/JHUAPL/SwRI)
The scene measures 780 miles (1,250 kilometers) across and was taken from a distance of 11,000 miles (18,000 km) on July 15 just after closest approach. Because backlighting highlights fine aerosols suspended in the atmosphere (think of seeing your breath on a cold winter day against the Sun), these photos show the amazing complexity of Pluto’s atmosphere with more than a dozen thin haze layers extending from near the ground to at least 60 miles (100 km) above the surface.
In this small section of the larger crescent image of Pluto, the setting sun illuminates a bank of fog or low-lying near-surface haze sliced by the parallel shadows of many local hills and small mountains. The image was taken from a distance of 11,000 miles (18,000 km), and the width of the image is 115 miles (185 km). Credits: NASA/JHUAPL/SwRI
“This image really makes you feel you are there, at Pluto, surveying the landscape for yourself,” said New Horizons Principal Investigator Alan Stern in a press release today. “But this image is also a scientific bonanza, revealing new details about Pluto’s atmosphere, mountains, glaciers and plains.”
Sputnik Planum is the informal name of the smooth, light-bulb shaped region on the left of this composite of several New Horizons images of Pluto. The brilliantly white upland region to the right may be coated by nitrogen ice that has been transported through the atmosphere from the surface of Sputnik Planum, and deposited on these uplands. The box shows the location of the glacier detail images below. Credits: NASA/JHUAPL/SwRI
I find the hazes the most amazing aspect of the photos. They remind me of crepuscular rays, those beams of sunshine that shine between breaks in the clouds near sunset and sunrise. It chills and thrills me to the bone to see such earthly sights on a bitterly cold orb more than 3 billion miles from home.
Ice, probably frozen nitrogen, appears to have accumulated on the uplands on the right side of this 390-mile (630-km) wide image is draining from Pluto’s mountains onto the informally named Sputnik Planum through the 2- to 5-mile (3- to 8-km) wide valleys indicated by the red arrows. On Earth this would be considered a valley glacier. The flow front of the ice moving into Sputnik Planum is outlined by the blue arrows. The origin of the ridges and pits on the right side of the image remains uncertain. Credits: NASA/JHUAPL/SwRI
But that’s not all that’s close to our hearts on Pluto. The photos reveal nitrogen ice apparently flowing downhill from mountainous highlands into a broad, smooth basin. Combined with other recently downloaded pictures, this new image (above) provides evidence for a remarkably Earth-like “hydrological” cycle on Pluto – but involving soft and exotic ices, including nitrogen, rather than water ice.
This might be the most remarkable image of all. It covers the same region as the image above, but is re-projected from the oblique, backlit view shown in the new crescent image of Pluto. The backlighting highlights the intricate flow lines on the valley glaciers. The flow front of the ice moving into the informally named Sputnik Planum is outlined by the blue arrows. We’re looking at a scene 390 miles (630 km) across. Credits: NASA/JHUAPL/SwRI
Nitrogen ice in the vast, relatively smooth Sputnik Planum may have vaporized in sunlight and then redeposited as ice in the bright, rugged region to its east. The new Ralph imager panorama also reveals glaciers flowing back from the blanketed mountain region into Sputnik Planum; these features are similar to the frozen streams on the margins of ice caps on Greenland and Antarctica.
Who knew that by going to Pluto we’d see such familiarity? But there you have it.