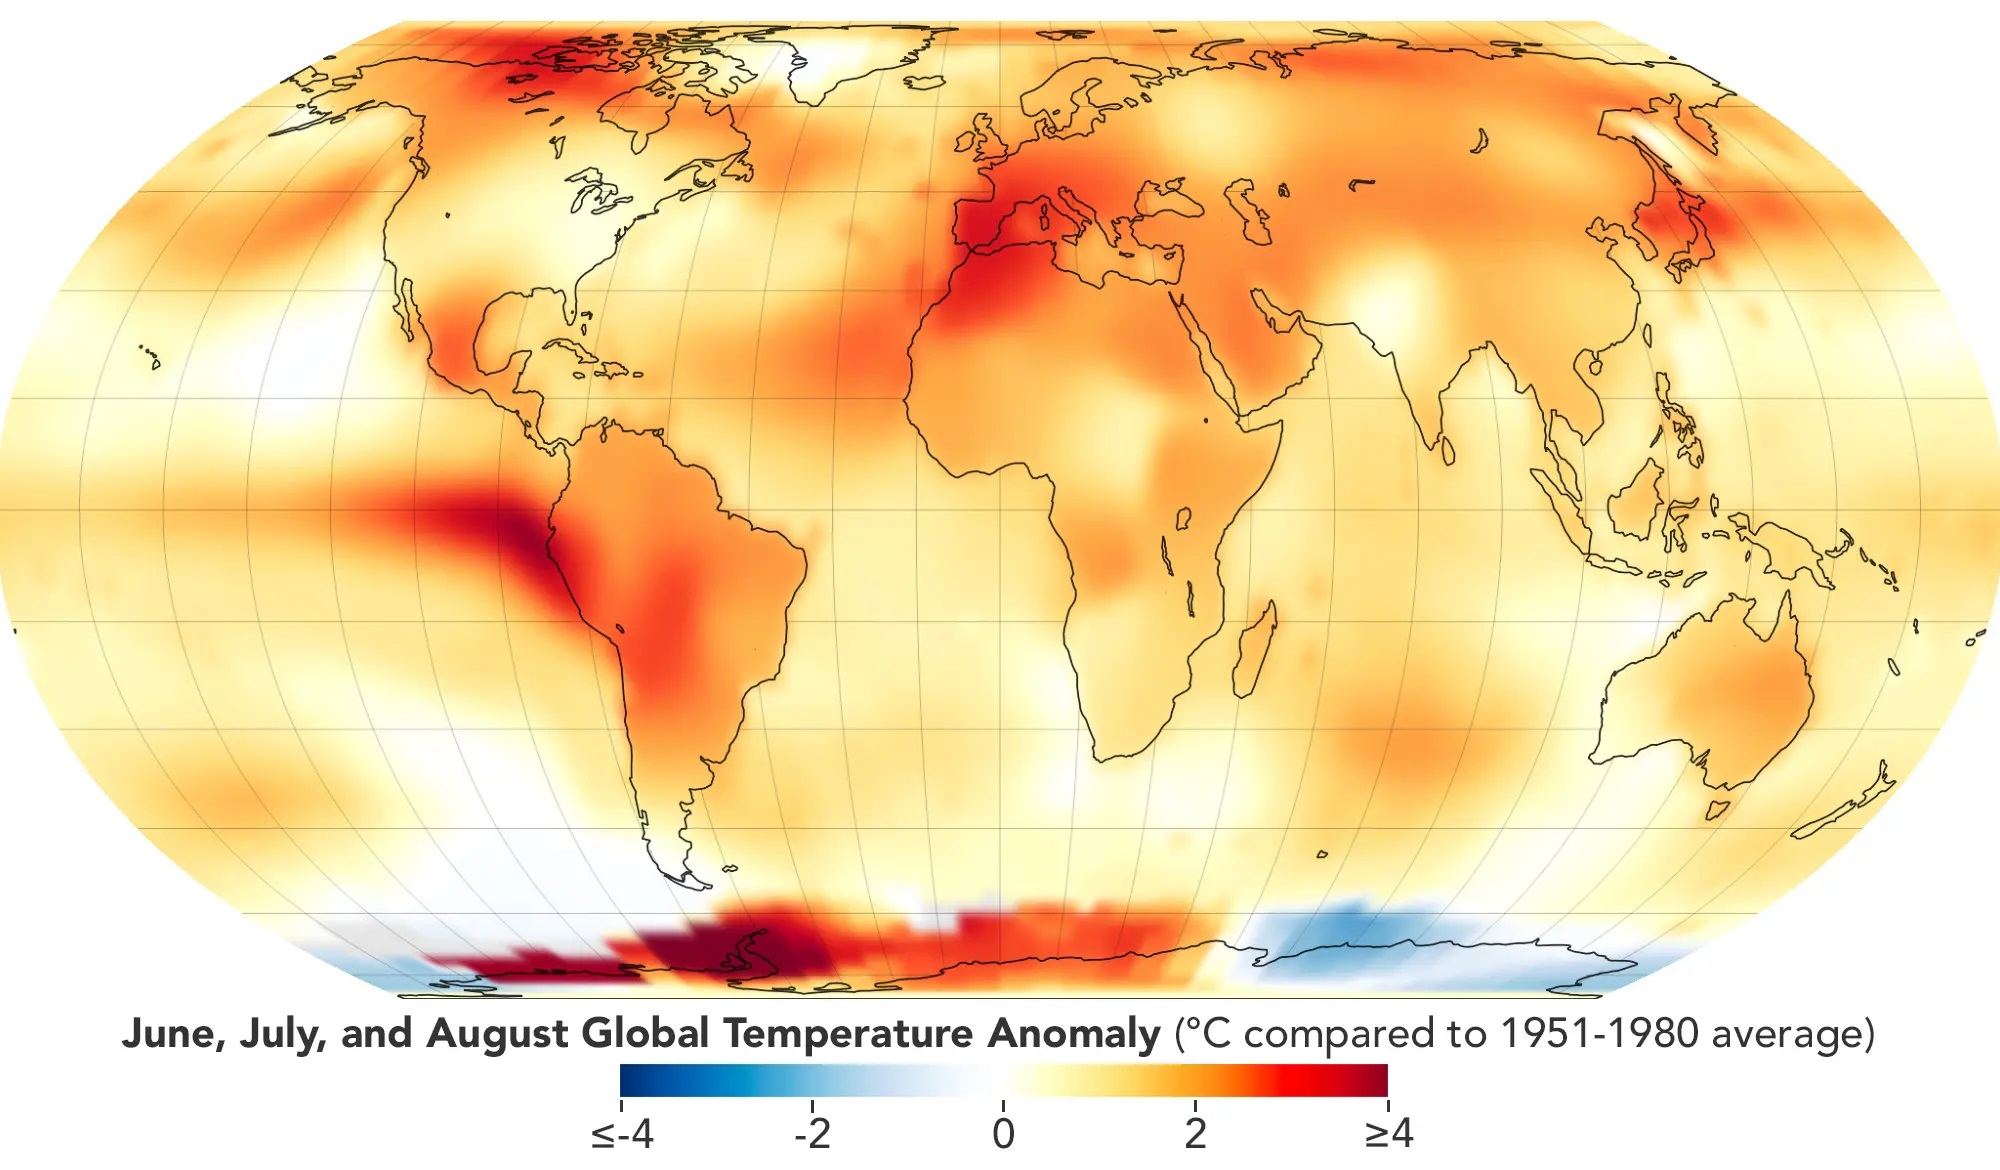
This map depicts global temperature anomalies for meteorological summer in 2023 (June, July, and August). It shows how much warmer or cooler different regions of Earth were compared to the baseline average from 1951 to 1980. Credit: NASA's Earth Observatory/Lauren Dauphin
Yesterday, NASA’s Goddard Institute of Space Studies (GISS) announced that the summer of 2003 was the hottest on record. This year saw a massive heat wave that swept across much of the world and was felt in South America, Japan, Europe, and the U.S. This exacerbated deadly wildfires in Canada and Hawaii (predominantly on the island of Maui) and are likely to have contributed to severe rainfall in Italy, Greece, and Central Europe. This is the latest in a string of record-setting summers that are the direct result of anthropogenic climate change.
Artist’s impression of a Super-Earth planet orbiting a Sun-like star. Credit: ESO/M. Kornmesser
When searching for potentially habitable exoplanets, scientists are forced to take the low-hanging fruit approach. Since Earth is the only planet we know of that is capable of supporting life, this search basically comes down to looking for planets that are “Earth-like”. But what if Earth is not the meter stick for habitability that we all tend to think it is?
That was the subject of a keynote lecture that was recently made at the Goldschmidt Geochemistry Congress, which took place from Aug. 18th to 23rd, in Barcelona, Spain. Here, a team of NASA-supported researchers explained how an examination of what goes into defining habitable zones (HZs) shows that some exoplanets may have better conditions for life to thrive than Earth itself has.
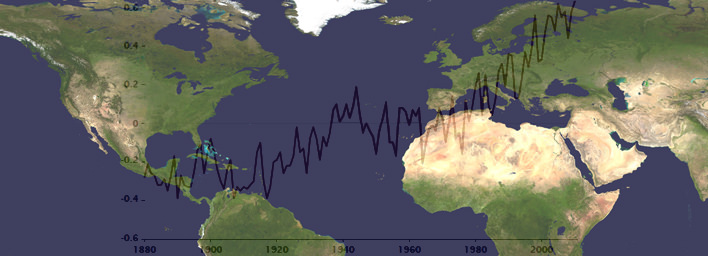
World map with global temperature changes from 1880 to 2010. Credit: NASA GISS
[/caption]
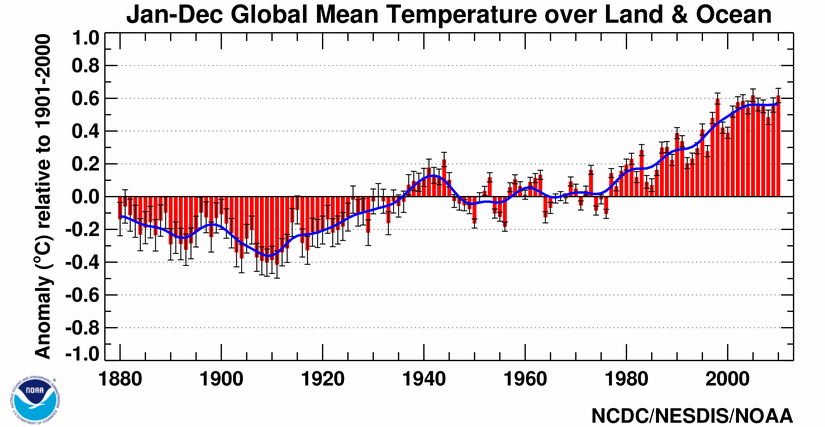
Newly released scientific data shows that 2010 equals 2005 as the Earths warmest year on record over the last 131 years, say researchers from NOAA and NASA. Temperature measurements from instrumented monitoring stations date back to 1880.
The past decade from 2001 to 2010 was the warmest on record and includes 9 of the 10 hottest years. A NOAA ranking of the 15 hottest years globally shows they all occurred in the last 15 years since 1995.
2010 was the 34th consecutive year with global temperatures above the 20th century average of 57.0 F (13.9°C), according to NOAA data. 1976 was the last year with a below average global temperature. Updated.
Global surface temperature anomalies for 2010. Credit: NOAA
Overall, the combined global land and ocean surface temperatures for 2010 and 2005 has risen 1.12 F (0.62 C) compared with the 20th century average, according to NOAA. The average global temperature in 2010 was 58.12 degrees compared to 57.0 F (13.9°C) as the average for all of 20th century. 2010 was also the wettest year on record.
The rise in Earths’ global temperature has been accompanied by a decline in arctic sea ice. Specifically, surface air temperatures in the arctic were warmer than normal during the summer of 2010. The sea ice extent measured in September 2010, was the 3rd lowest on record since accurate monitoring began in 1979, states NOAA in the annual Arctic report card. See Video below.
Scientists from NOAA’s National Climatic Data Center (NCDC) in Asheville, N.C. and NASA’s Goddard Institute for Space Studies (GISS) in New York City announced the findings on Jan 12. The temperature data are collected by weather stations that span across the globe.
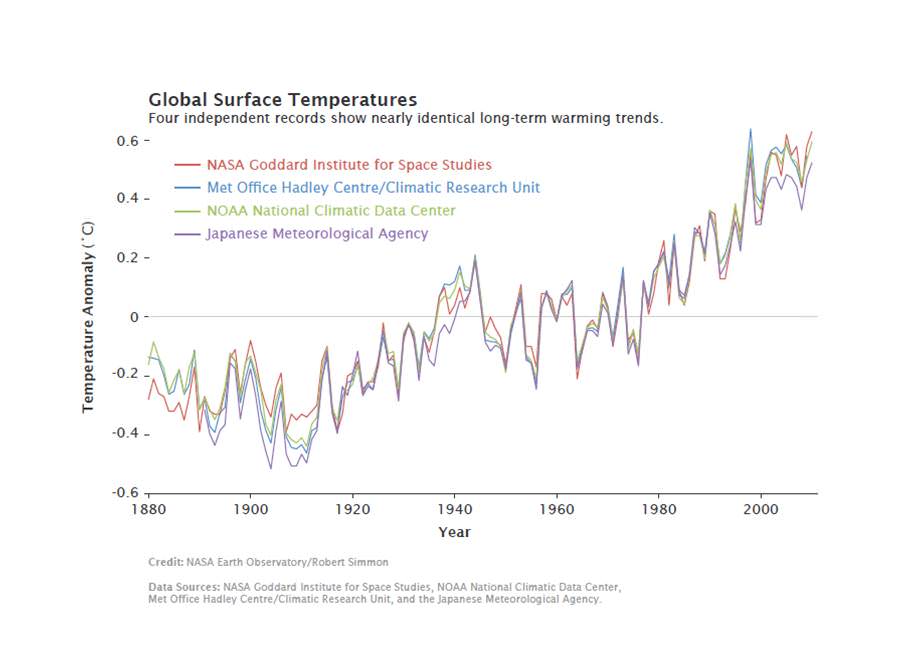
Global measurements by independent researchers in the UK at the Met Office Hadley Centre and at the Japanese Meteorological Agency closely match the trend of warming temperatures gathered by NOAA NCDC and NASA GISS.
The graphic below combines the actual temperature data collected independently by the four research agencies. The temperature trend lines are remarkably consistent.
Multiple institutions monitor global surface temperatures. Despite subtle differences in the ways the scientists perform their analyses, these four widely referenced records show remarkable agreement. Credit: NASA Earth Observatory/Robert Simmon
Much of the rise in global temperatures has taken place since the late 1970’s, says NASA. The rate of increase has been about 0.36 F per decade. The NASA GISS weather data were collected using over 1000 meteorological stations around the world, satellite observations of sea surface temperature and Antarctic research station measurements.
2010 average annual temperature ranks by state in the US. Credit: NOAA
The data are fed into a computer program which then calculates temperature anomalies — the difference between surface temperature in a given month and the average temperature for the same period during 1951 to 1980. NASA GISS uses that three-decade period as the baseline for analysis against which climate change can be tracked. NOAA uses the entire 20th century.
For the contiguous United States, NOAA analysis shows that “2010 was the 14th consecutive year with an annual temperature above the long-term average. Since 1895, the temperature across the US has increased at an average rate of approximately 0.12 F per decade.”
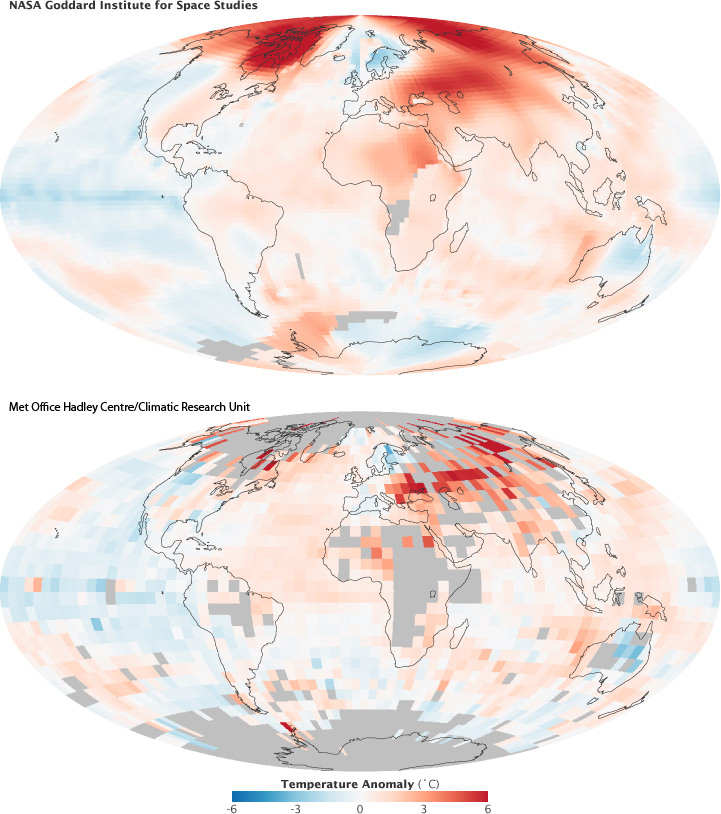
There are large areas in the Arctic without weather stations. NASA GISS approaches the problem by filling in gaps with data from the nearest land stations. The Climatic Research Unit at the University of East Anglia, which works jointly with the Met Office Hadley Centre, leaves much of the region out of its global temperature analysis. Credit: NASA Earth Observatory/Robert Simmon
2010 Global Significant Weather and Climate Events. Credit: NOAA
Global Temperatures.
The year 2010 tied with 2005 as the warmest year since records began in 1880. The annual global combined land and ocean surface temperature was 0.62°C (1.12°F) above the 20th century average. The range associated with this value is plus or minus 0.07°C (0.13°F). The 2010 combined land and ocean surface temperature in the Northern Hemisphere was also the warmest on record, while the combined land and ocean surface temperature in the Southern Hemisphere was the sixth warmest such period on record. Credit: NOAA